Asset Panel
# Asset Panel
The Asset Panel is the fastest way to stay on one ticker while switching between chart, news, technicals, earnings, options, and financial context without leaving your current workflow.
Use it when you already know the asset you want to inspect and need a focused workspace instead of a general chat answer.
How to Open It
Common entry points:
- From chat — Click a ticker or asset tag that appears in an Agent response.
- From screener results — Click a symbol row to open that asset directly.
- From other asset-linked surfaces — When Tritonix shows an asset shortcut, you can usually open the same ticker into the Asset Panel.
What You Can Do First
Most users use the Asset Panel in one of these ways:
- Open a ticker and inspect the live chart
- Switch to another ticker without closing the panel
- Read the latest news tied to the same asset
- Check technical signals across timeframes
- Review earnings documents, financials, or options if the asset supports them
- Add the asset to your watchlist
- Send a follow-up prompt back to the Agent using the quick action chips
- Open the trade side panel or broker account area when you want to act on the setup
Header Controls
The top area of the panel is designed for quick navigation.
Switch the asset
Click the ticker symbol in the header to open search and jump to another asset without closing the panel.
This is useful when you want to compare names quickly, for example:
- Move from
NVDAtoAMD - Jump from a stock to an index
- Switch from spot crypto context to another pair
Read price and session context
The header shows the latest price, the current percentage move, and live-connection status when streaming data is available.
Add to watchlist
When logged in, the round + button lets you save the asset to your watchlist.
If it is already saved, it changes to the same check/minus interaction used elsewhere in the product.
Close the panel
Use the × button in the top-right corner to dismiss the panel.
Main Tabs
The panel is tab-based. You can stay on the same symbol and move across different types of context.
Chart
This is the default view.
Use it when you want to:
- Inspect live price structure
- Change timeframe or chart type
- Add advanced indicators or drawings
- Continue from a saved layout
- Turn chart work into a publishable idea
This is the best place to do hands-on chart review.
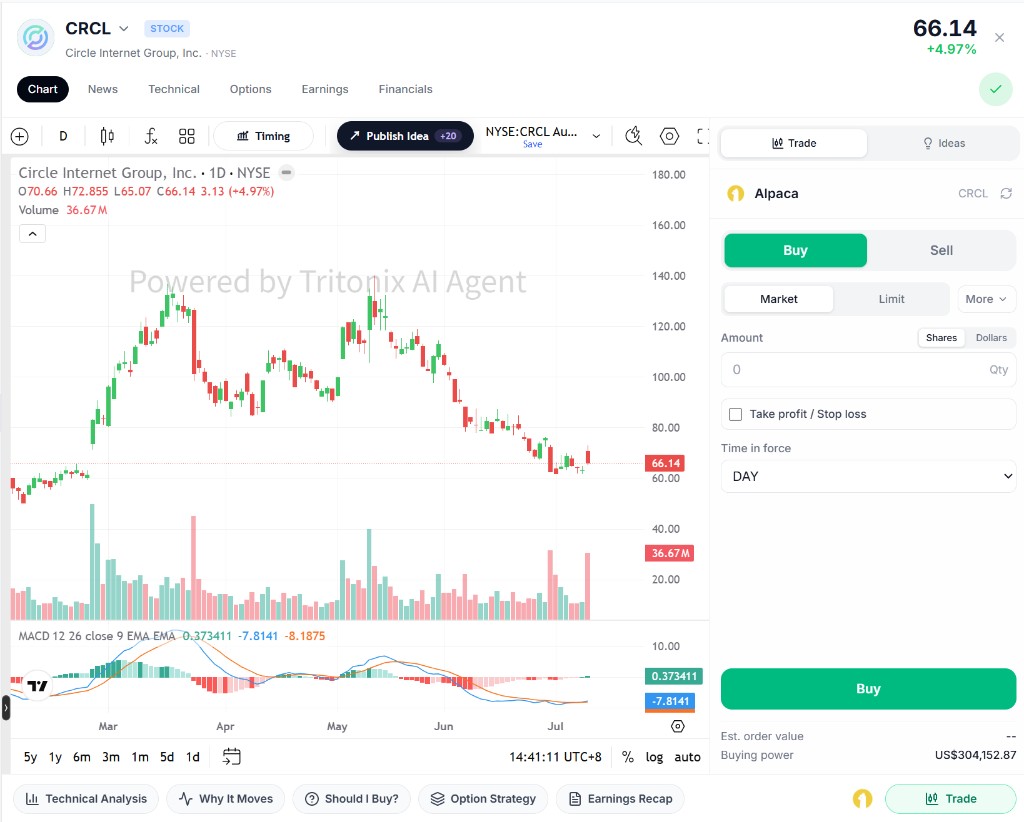
Example: the default Chart view keeps the live chart, quick action chips, and trade entry in one workspace.
News
The News tab keeps the asset context fixed and shows related coverage in the current help-center language when available.
Use it for:
- Checking what may be driving the move
- Reading recent headlines before asking follow-up questions
- Comparing chart action with catalyst flow
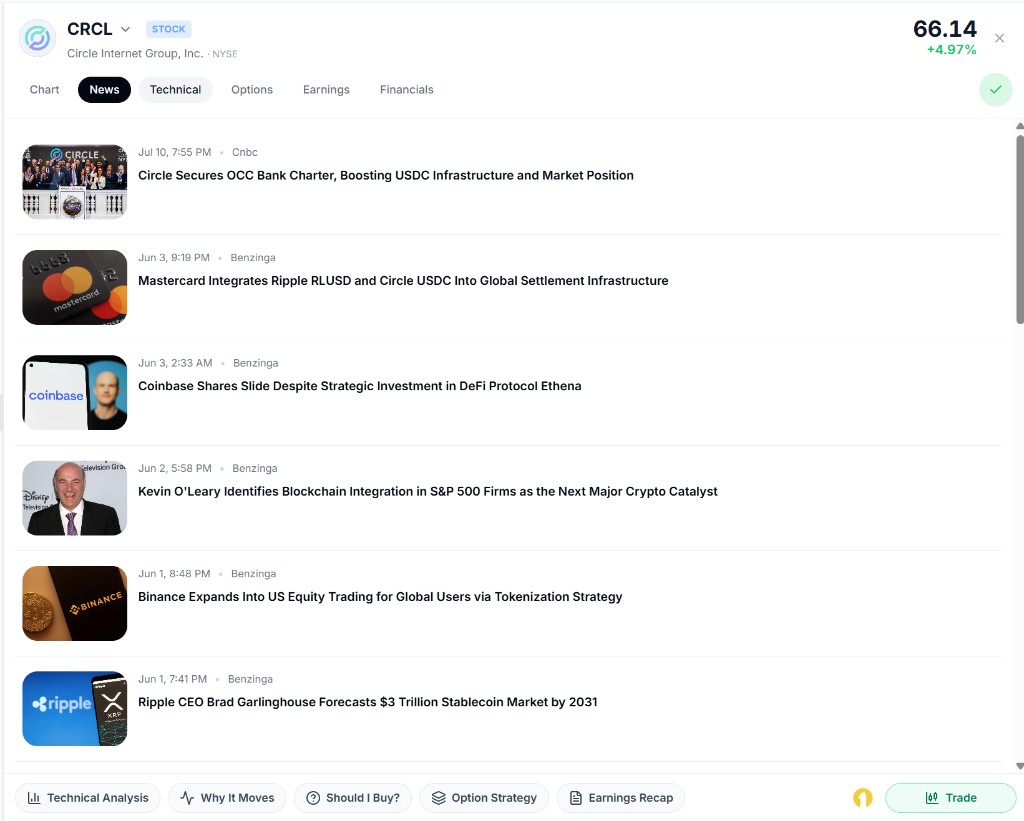
Example: the News tab keeps the same ticker selected while you scan the latest headlines and catalysts.
Technical
The Technical tab is for quick signal-checking rather than full manual chart work.
Use it when you want to:
- Check multi-timeframe technical ratings
- Review pivots and indicator summaries
- See whether short-term and higher-timeframe signals agree
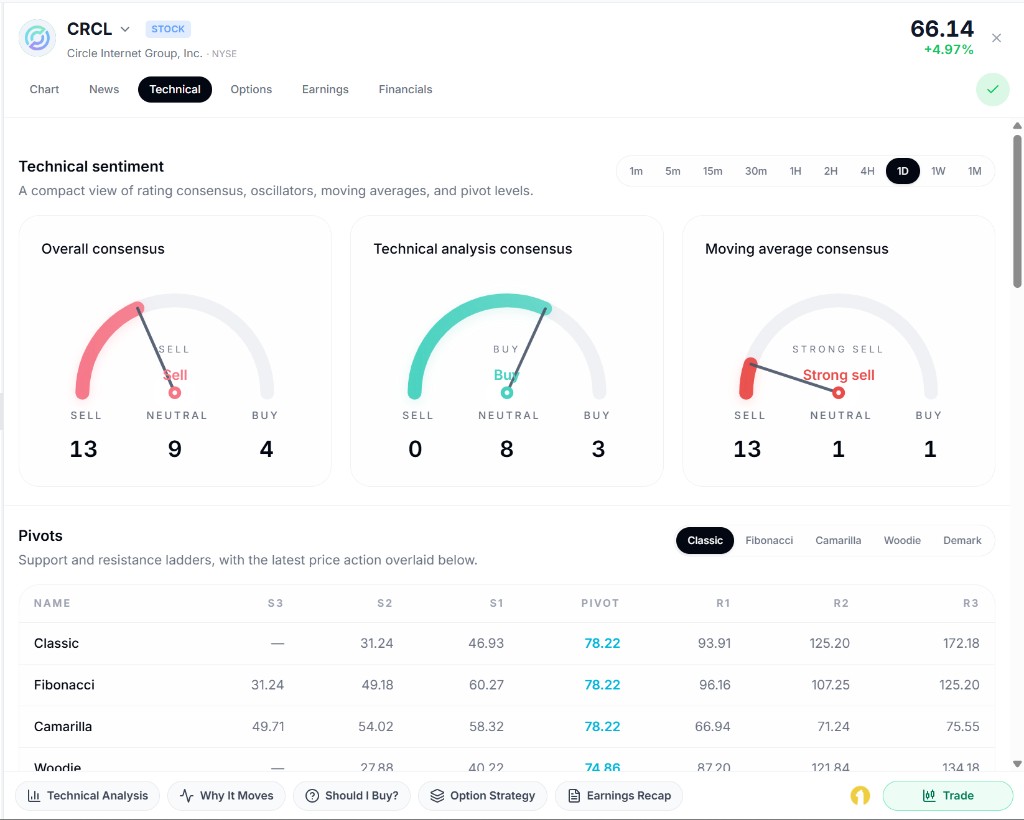
Example: the Technical tab gives you a fast read on consensus, moving averages, and pivot levels across timeframes.
Earnings
For supported equities, the Earnings tab is where you review reporting context.
Use it for:
- Looking at earnings history and estimates
- Opening transcripts, slides, and reports
- Jumping from the price chart into the company reporting trail
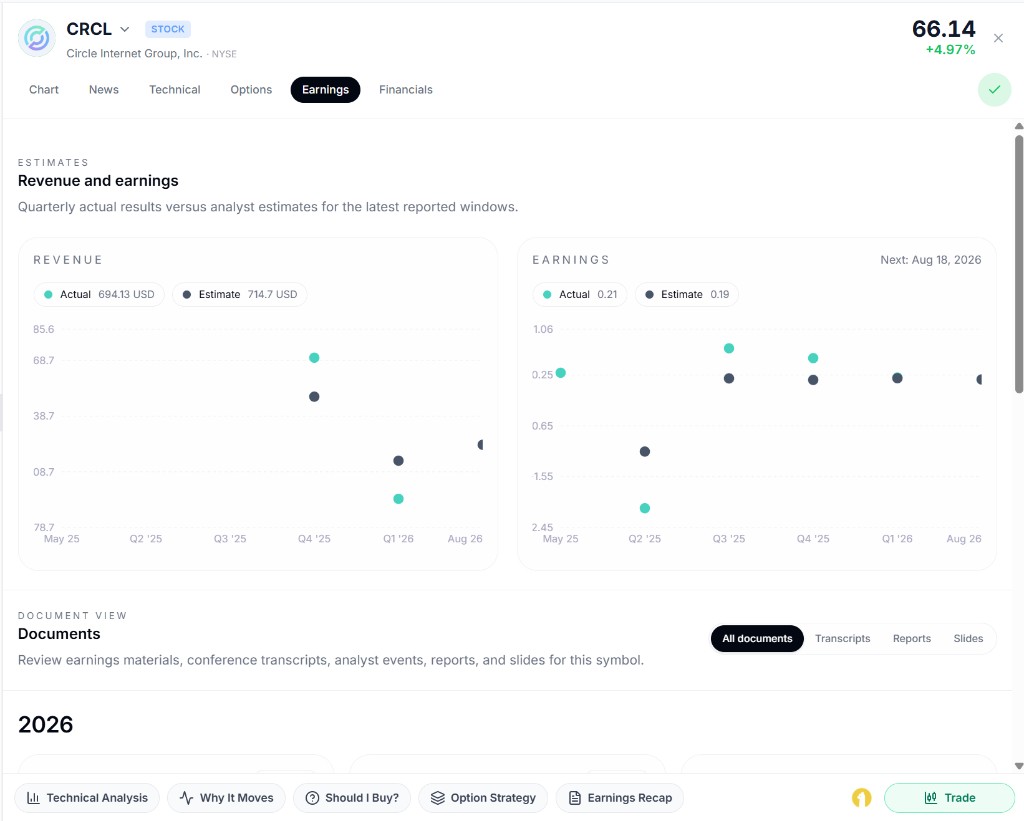
Example: the Earnings tab combines estimates with transcripts, reports, and slides for the same company.
Financials
For supported equities, the Financials tab helps you move from price action into business quality.
Use it for:
- Reviewing revenue, margins, debt, cash flow, and valuation
- Flipping between overview, key indicators, and statement views
- Getting a fast sense of whether the fundamentals match the chart story
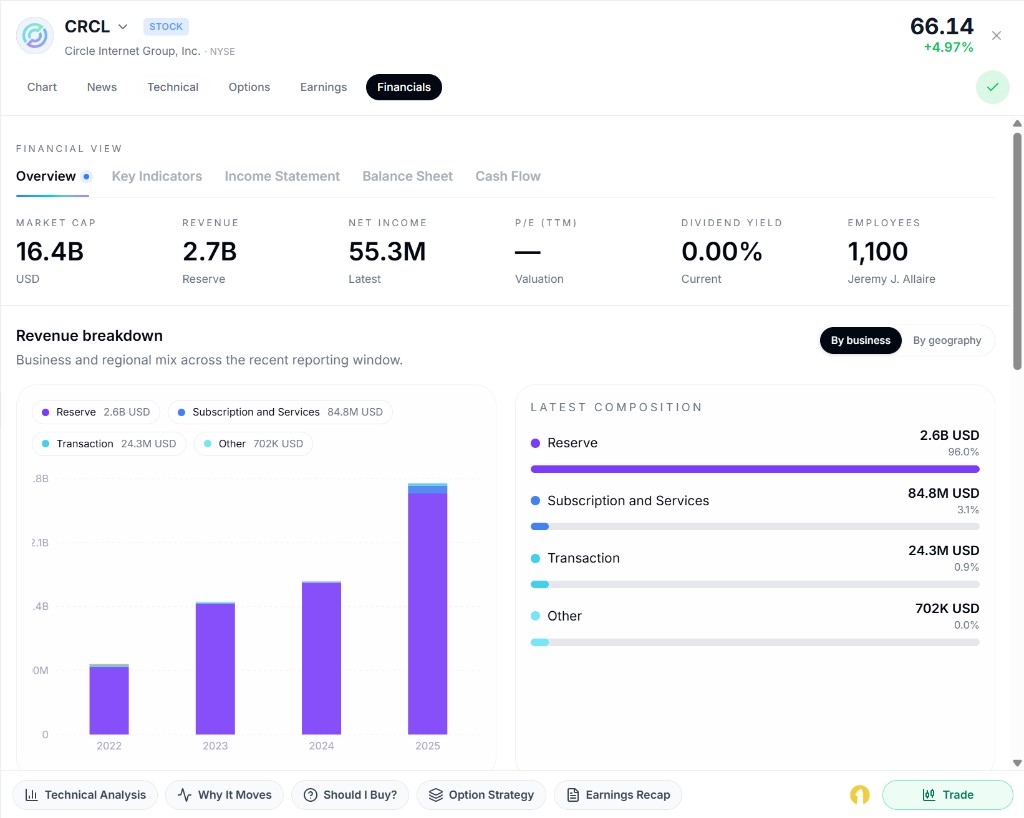
Example: the Financials tab helps you move from chart action into revenue mix, valuation, and statement-level context.
Options
For supported equities, the Options tab is where you inspect option activity and strategy ideas.
Use it for:
- Looking at the option chain
- Reviewing options analytics and positioning clues
- Browsing strategy candidates when you want a structured options angle
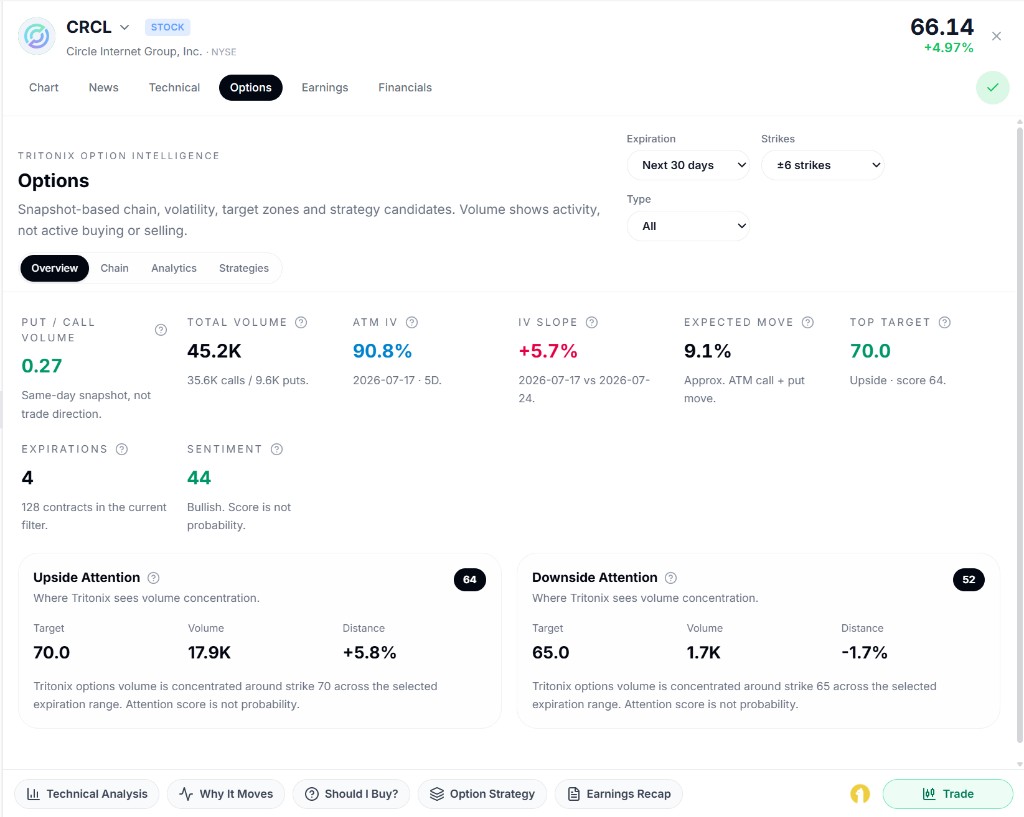
Example: the Options tab shows a snapshot of positioning, expected move, and strategy-oriented context for the selected ticker.
Not every asset shows every tab. Stocks usually have the fullest set. Crypto and indices may only show the relevant subset.
Trade Area and Broker Access
At the bottom-right of the panel, Tritonix can show trading entry controls when the asset supports that workflow.
Trade button
The Trade button opens the side trade area for the current asset.
Use it when you want to move from research into action, such as:
- Reviewing public trade ideas tied to the chart
- Asking the Agent to analyze the current chart setup
- Moving toward a trade workflow without leaving the asset context
Broker / account button
If you are logged in, the wallet or broker icon opens the account area.
Use it to:
- Connect a broker account
- Check the currently connected account
- Open the account panel while staying on the same asset
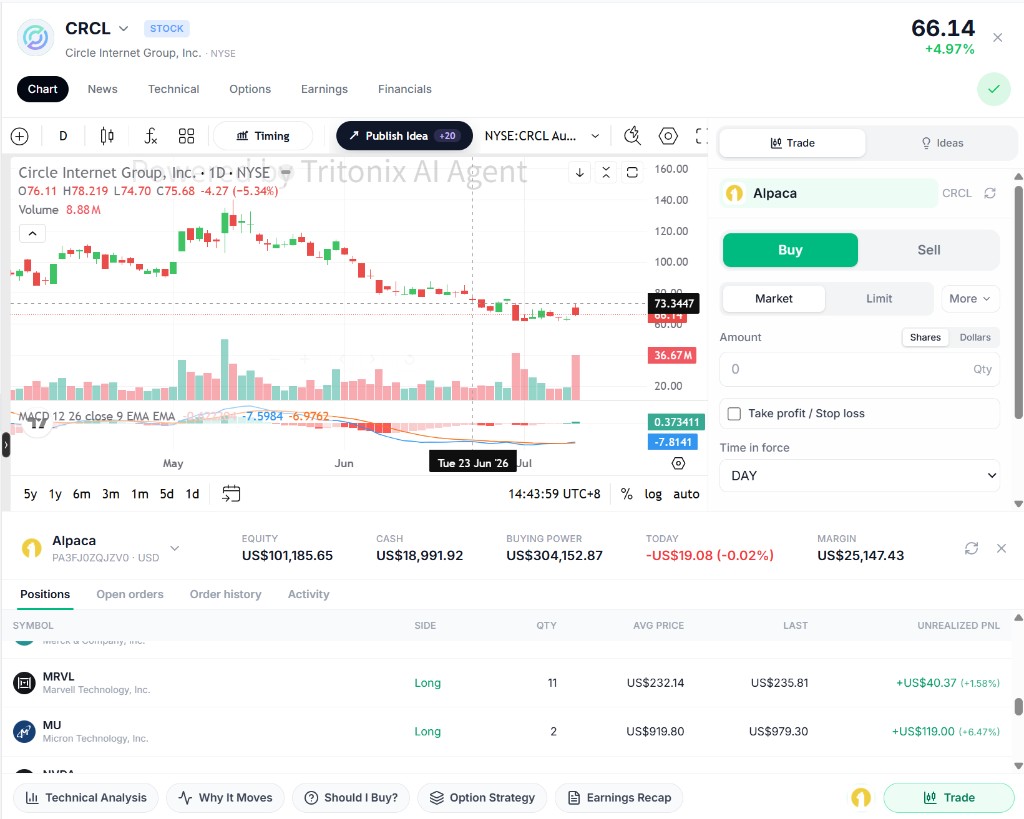
Example: after opening broker access, you can keep the chart visible while reviewing account balances, positions, and order history.
Quick Action Chips
At the bottom of the Asset Panel, Tritonix can show one-tap prompts that send the current asset back into the Agent.
Typical examples include:
Technical AnalysisWhy It MovesShould I Buy?Option StrategyEarnings Recap- Crypto-specific prompts such as positioning or catalyst reads
These are useful when you do not want to manually rewrite the ticker in chat.
They keep the prompt anchored to the asset you already have open.
Publishing From the Chart
If you build a chart setup inside the panel, Tritonix can open a publish flow directly from the chart workspace.
That flow lets you prepare:
- A title
- Direction (
Long,Short, orWatch) - A short summary
- A longer article body
Use this when you want to turn a chart setup into a community-facing idea instead of keeping it only as private research.
A Good Default Workflow
If you are not sure how to use the panel efficiently, this is a solid pattern:
- Open the asset from chat or screener
- Check the live chart first
- Read the News tab for current catalysts
- Review Technical for alignment across timeframes
- If it is a stock, inspect Earnings / Financials / Options as needed
- Use a quick action chip to ask the Agent a sharper follow-up question
- Save to watchlist or move into Trade / broker actions if the setup is actionable
Related Guides
- For BUY / SELL marks on the live chart: Advanced Indicators
- For chart-native analysis workflows: AI Technical Analysis
- For everyday research prompts: Tritonix Investment Agent
- For screen-first discovery flows: Screener Panel