AI Technical Analysis
AI Technical Analysis
This guide explains Tritonix's advanced chart-analysis workflow: the Agent marks a real TradingView chart in the same chat, then can generate a Trade Idea.
If your question is mostly about company research, market news, or screening, start with Tritonix Investment Agent. Use this page when the task becomes chart-native and you want the Agent to work directly on a chart.
When to Use Chart Analysis
Ask Tritonix in Studio chat when you want a deeper single-asset chart read.
It is a good fit for prompts like:
- "Do a technical analysis of TSLA."
- "Mark support and resistance on BTC."
- "Update the last chart you made for NVDA and show me the new key levels."
- "Turn this setup into a chart-backed trade idea."
Compared with a one-line quote or a static chart, this workflow is for tasks that need chart inspection, indicators, markup, and a more explicit technical thesis.
What It Can Do
In the same conversation, Tritonix can:
- Read price structure on a real chart
- Use technical indicators as confirmation, not just list them
- Mark support, resistance, trend lines, and key zones directly on the chart
- Add labels, annotations, and path-style markup when helpful
- Reopen and continue from a previous AI-generated chart layout
- Create a structured Trade Idea card after the analysis is in place
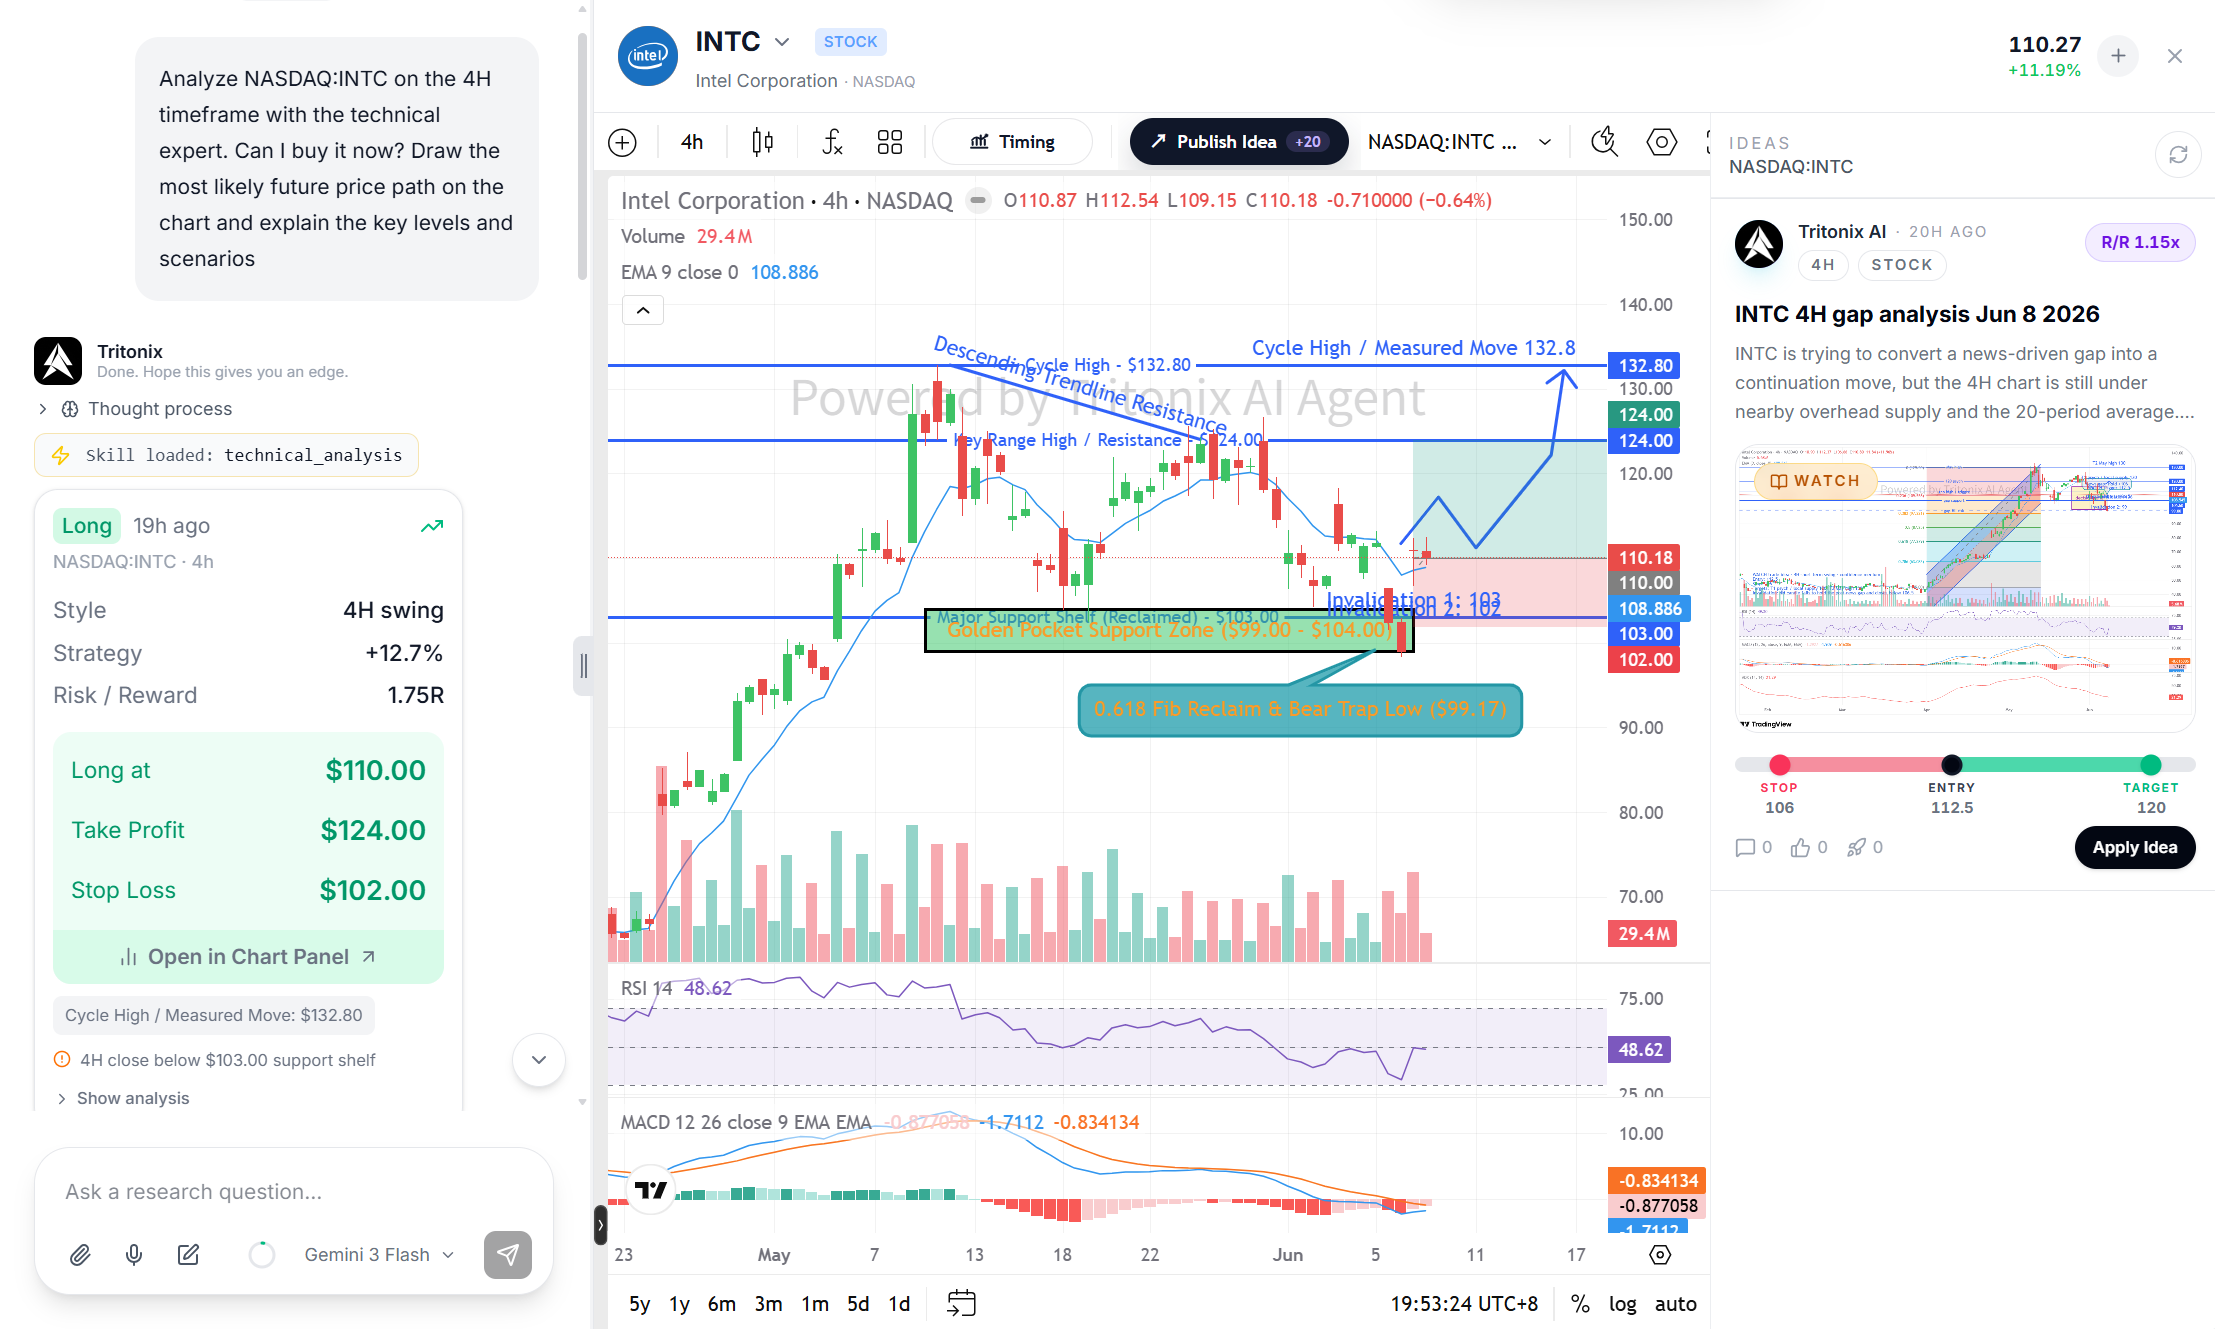
Example: Tritonix working directly on a real chart, marking structure, reading levels, and turning the setup into a visual trade idea.
This is especially useful when you want the output to be visual, not just descriptive.
Chart Markup and Drawing
One of the biggest differences from a normal chatbot is that Tritonix can express a view on the chart itself.
Depending on the setup, it can add:
- Trend lines
- Support and resistance lines
- Channels and structure zones
- Fibonacci-style analysis markup
- Text labels and callouts
- Scenario paths or projection-style annotations
- Pattern markup when the structure is clear
You can also ask it to revise existing drawings, for example:
- "Move the resistance level slightly higher."
- "Delete the old path and draw the bearish scenario instead."
- "Keep the support zone but update the trend line."
Follow-ups stay in the same chat. You do not need to start over.
What a Typical Workflow Looks Like
For a deeper technical prompt, Tritonix usually follows a flow like this:
- Open the relevant chart workspace
- Load the symbol and timeframe
- Inspect price structure and apply indicators when useful
- Capture and review the chart state
- Draw or edit markup on the chart
- Generate a trade idea when the setup is actionable
- Save the layout so you can revisit it later
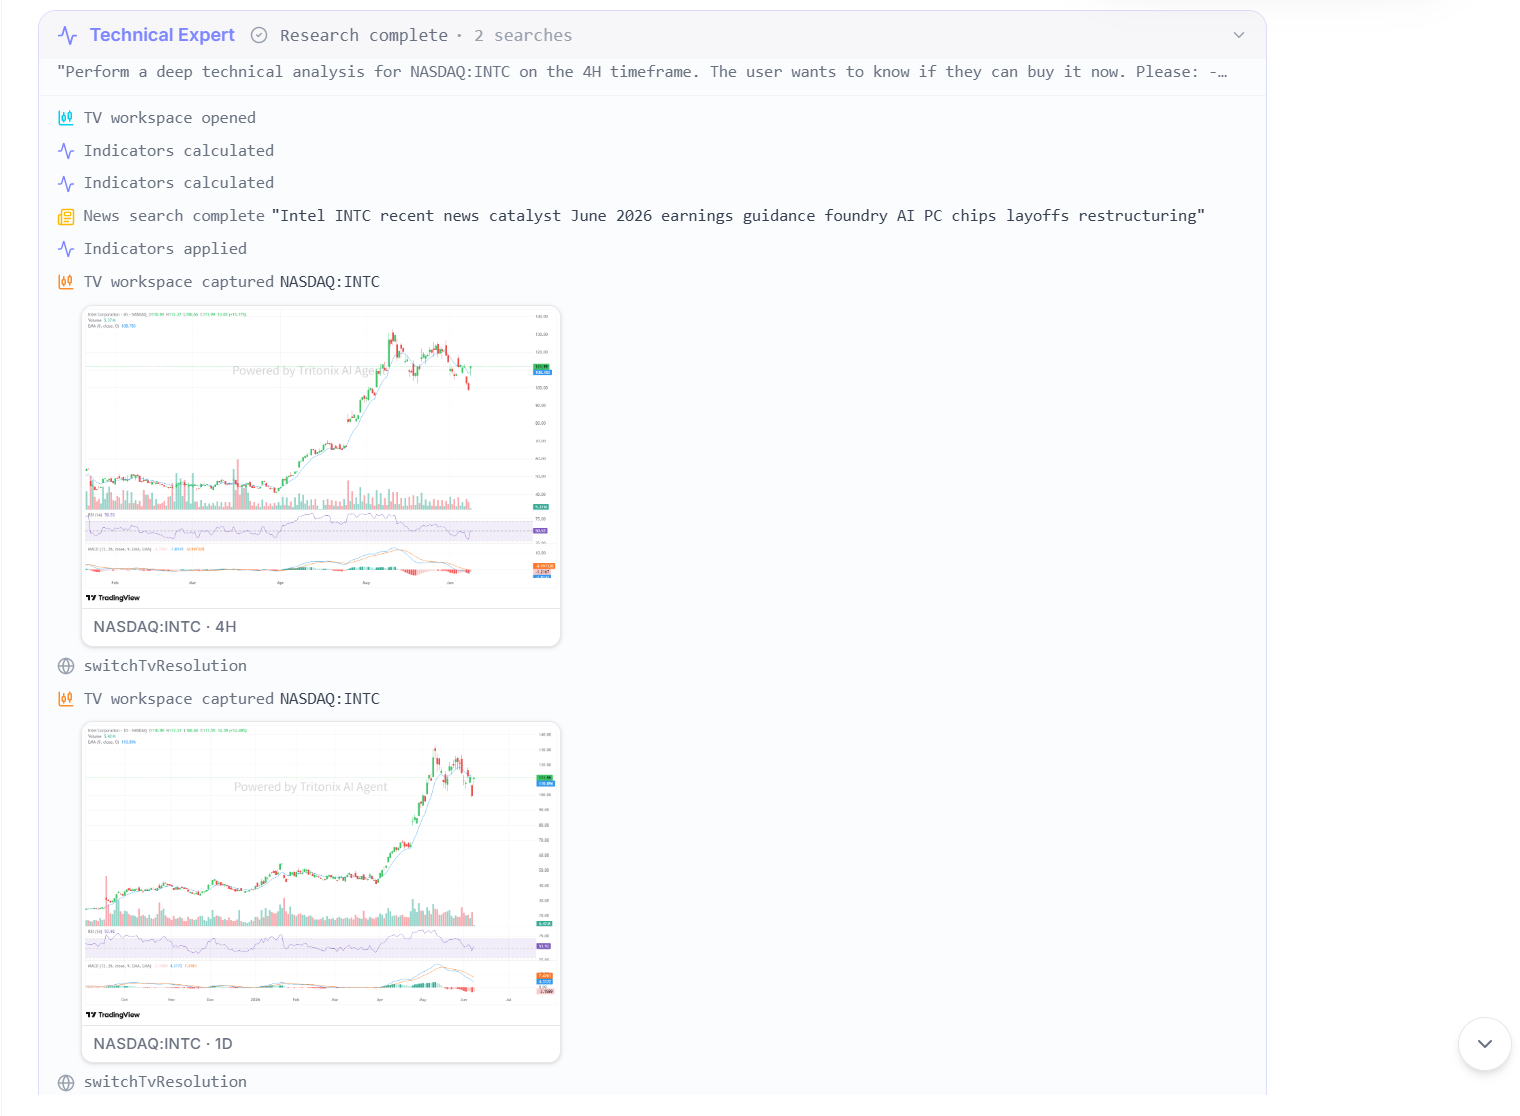
Example: a deeper technical workflow showing chart workspace steps such as opening the workspace, applying indicators, capturing chart state, and iterating across timeframes before finishing the analysis.
You do not need to request each step manually. A natural prompt is usually enough.
Trade Idea Output
After chart analysis, Tritonix can generate a Trade Idea card.
This typically includes:
- Direction such as long, short, or watch
- Entry idea
- Target
- Stop
- Risk/reward framing
- Written setup summary
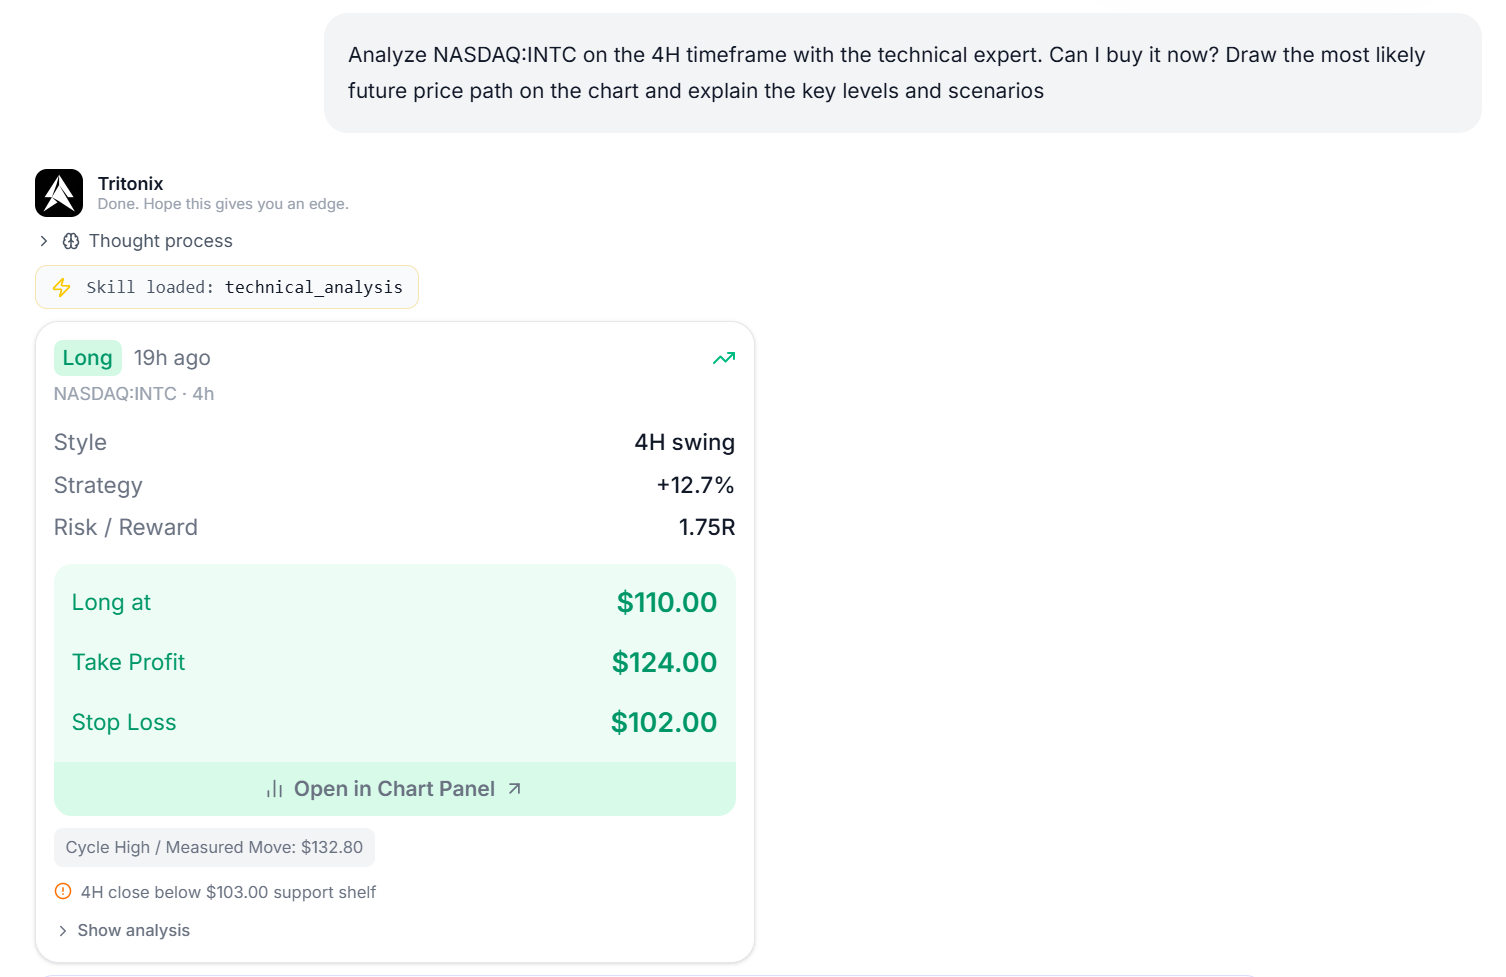
Example: a Trade Idea card showing direction, entry, target, stop, risk/reward, and a short setup summary after the analysis is complete.
Important: this is analysis output, not an order or live position.
Example Prompts
Basic technical read
- "Do a technical analysis of ETH on the 4H chart."
- "What are the key levels for AAPL right now?"
Drawing and markup
- "Draw the support and resistance levels for NVDA."
- "Mark the trend line and breakout area on this chart."
Continue prior work
- "Update the chart you made for TSLA yesterday."
- "Keep the same setup and add a bearish alternative scenario."
Trade setup
- "If this breakout holds, turn it into a trade idea."
- "Create a watch setup for BTC with entry, stop, and first target."
Where the Result Appears
Technical analysis results can show up as:
- A written explanation in chat
- Chart markup tied to the asset workflow
- A saved chart layout you can continue later
- A Trade Idea card
- Context inside the Asset Panel
What This Guide Does Not Mean
Chart markup is not meant for every question.
You usually do not need it for:
- Simple price lookups
- Basic company summaries
- News-only questions
- Broad multi-asset screens
For those, the normal Tritonix Investment Agent flow is often enough.
Next Steps
- For everyday research examples: Tritonix Investment Agent
- For publishing chart-backed setups: Publish Ideas
- For chart context and asset detail views: Asset Panel