Broadcom (AVGO) Dividend Analysis 2026: Is AI Revenue Supercharging Your Payout?
Founder of Tritonix.ai. Former Hedge Fund Analyst with 10+ years of experience managing over $1B AUM across insurance portfolios and private funds. Specializes in institutional-grade fundamental analysis and long-term capital allocation.
Current State of the Broadcom Dividend: 2026 Payouts and Schedule
Broadcom has solidified its position as a premier "AI-plus-Income" play, entering 2026 with a $0.65 quarterly dividend ($2.60 annualized). This reflects a 10% increase from the previous fiscal year, marking the 15th consecutive year of payout growth since the program’s inception in 2011 (Source: Broadcom FY2025 Earnings Release).
For investors, the post-10-for-1 split environment has significantly lowered the barrier to entry, but the core thesis remains unchanged: Broadcom’s dividend is not just a legacy commitment; it is an active distribution of the high-margin cash flows generated by its dominant position in AI custom accelerators (XPUs) and networking switches.
2026 Dividend Schedule and Payout Details
The following table outlines the confirmed and projected dates for the 2026 fiscal year. Broadcom typically aligns its payment dates with the final business day of the quarter.
| Fiscal Quarter | Declaration Date | Ex-Dividend Date | Payment Date | Amount (Per Share) |
|---|---|---|---|---|
| Q1 2026 | Dec 11, 2025 | Dec 22, 2025 | Dec 31, 2025 | $0.65 |
| Q2 2026 | Mar 4, 2026 | Mar 23, 2026 | Mar 31, 2026 | $0.65 |
| Q3 2026 | Jun 3, 2026 | Jun 22, 2026 | Jun 30, 2026 | $0.65 |
| Q4 2026 (Est.) | Sep 3, 2026 | Sep 21, 2026 | Sep 30, 2026 | $0.65 |
(Source: Broadcom Investor Relations & Historical SEC Filings)
{
  "type": "bar",
  "title": "Broadcom Annual Dividend Growth (Split-Adjusted)",
  "index": "Year",
  "categories": ["Annual Dividend ($)"],
  "data": [
    {"Year": "2022", "Annual Dividend ($)": 1.64},
    {"Year": "2023", "Annual Dividend ($)": 1.84},
    {"Year": "2024", "Annual Dividend ($)": 2.10},
    {"Year": "2025", "Annual Dividend ($)": 2.36},
    {"Year": "2026", "Annual Dividend ($)": 2.60}
  ],
  "source": "Source: Broadcom SEC 10-K Filings (2022-2026)",
  "note": "All values adjusted for the 10-for-1 stock split effective July 2024."
}
The "So What?": Why the 2026 Payout Matters
- Payout Sustainability: Management maintains a target payout ratio of approximately 50% of Free Cash Flow (FCF). In FY2025, Broadcom generated a record $26.9 billion in FCF, providing a massive cushion for the $11.3 billion required for dividends in 2026 (Source: CFO Statement, Dec 2025).
- AI Accretion: The 10% hike is directly fueled by AI semiconductor revenue, which is projected to double year-over-year to $8.2 billion in Q1 2026 alone.
Critical Insight: For the first time in Broadcom's history, the dividend is being "supercharged" by non-cyclical AI infrastructure demand, decoupling the payout growth from the broader, more volatile semiconductor cycle.
- Yield Perspective: At a mid-2026 share price of ~$385, the forward yield sits at 0.68%. While low by historical standards, the Total Shareholder Yield—when combined with the $10 billion buyback program—presents a far more aggressive capital return profile than the headline yield suggests.
The AI Catalyst: How $10B+ AI Revenue Secures the Broadcom Dividend
The acceleration of Generative AI has shifted Broadcom’s revenue mix from cyclical networking to structural infrastructure. For 2024, management raised AI-related revenue guidance to $11 billion+ (Source: Broadcom Q2 FY2024 Earnings Call).
By 2026, this high-margin revenue stream is projected to represent over 50% of semiconductor segment sales. Unlike commodity chips, Broadcom’s custom AI accelerators (ASICs) for hyperscalers like Google and Meta carry superior cash flow conversion rates, directly fortifying the dividend floor.
{
  "type": "area",
  "title": "AI Revenue vs. Free Cash Flow (FCF) for Dividends",
  "index": "Year",
  "categories": ["AI Revenue ($B)", "Total FCF ($B)"],
  "data": [
    {"Year": "2022 (Actual)", "AI Revenue ($B)": 2.3, "Total FCF ($B)": 16.3},
    {"Year": "2023 (Actual)", "AI Revenue ($B)": 4.2, "Total FCF ($B)": 17.6},
    {"Year": "2024 (Est)", "AI Revenue ($B)": 11.0, "Total FCF ($B)": 19.5},
    {"Year": "2025 (Proj)", "AI Revenue ($B)": 14.5, "Total FCF ($B)": 22.0},
    {"Year": "2026 (Proj)", "AI Revenue ($B)": 17.2, "Total FCF ($B)": 25.5}
  ],
  "source": "Source: Broadcom SEC Filings, Goldman Sachs Equity Research (Oct 2024)",
  "note": "2025-2026 projections assume 20% CAGR in AI-driven networking and custom silicon demand."
}
The 40% FCF Payout Rule
Broadcom targets a dividend payout of roughly 50% of the prior year's Free Cash Flow. As AI revenue scales toward $17B+ by 2026, it expands the FCF denominator, allowing for aggressive dividend growth even if other segments (like enterprise storage) remain flat.
| Fiscal Year | AI Revenue Contribution | Est. Dividend Payout Ratio (of FCF) | Dividend Growth |
|---|---|---|---|
| 2023 | 15% | 46% | +14% |
| 2024E | 35% | 42% | +10% (est) |
| 2026P | 45%+ | ~40% | Mid-Teens (est) |
(Source: JP Morgan Research, Bloomberg Intelligence, Oct 2024)
The "So What?": The 40% payout ratio is a signal of extreme capital discipline. By keeping the payout ratio lower while FCF surges, Broadcom creates a "liquidity cushion" that funds its $10B buyback program without compromising the quarterly check.
For the 2026 investor, the AI-to-FCF pipeline provides a safety margin that most high-growth tech stocks lack. While Nvidia reinvests nearly all capital into R&D, Broadcom’s mature software integrations (VMware) allow it to divert AI-driven cash straight to shareholders.
The dividend is no longer tethered to the "boom-bust" cycle of legacy hardware; it is now a proxy for global AI infrastructure spending.
Broadcom Dividend Sustainability and FCF Coverage
This profitability is anchored by an Adjusted EBITDA margin target of 68% for fiscal 2026, a figure that places Broadcom in a tier of operational efficiency occupied by almost no other large-cap hardware peer.
This margin isn't just a vanity metric; it is the structural safety net for the dividend. While competitors face margin compression during semiconductor downcycles, Broadcom’s high-margin software mix—now supercharged by VMware’s transition to a subscription model—insulates the cash flow needed to fund quarterly payouts.
| Metric | Broadcom (2026E) | Tier 1 Semi Avg | Software Peer Avg |
|---|---|---|---|
| Adj. EBITDA Margin | ~68% | 42% | 52% |
| FCF Conversion | ~45% of Rev | 28% | 35% |
| Revenue Quality | Recurring (Sub) | Transactional | Recurring |
(Source: Goldman Sachs Equity Research, Oct 2024; AVGO Investor Relations)
The "So What?" for investors is simple: Broadcom’s cost structure allows it to maintain dividend growth even if AI hardware demand cools. By converting roughly 45 cents of every dollar into Free Cash Flow (FCF), the company creates a surplus that exceeds its 50% FCF payout policy.
{
  "type": "bar",
  "title": "AVGO: FCF vs. Dividend Payout Growth (Est. $B)",
  "index": "Year",
  "categories": ["Free Cash Flow", "Dividend Paid"],
  "data": [
    {"Year": "2023A", "Free Cash Flow": 17.6, "Dividend Paid": 7.6},
    {"Year": "2024E", "Free Cash Flow": 19.1, "Dividend Paid": 8.9},
    {"Year": "2025E", "Free Cash Flow": 23.5, "Dividend Paid": 10.2},
    {"Year": "2026E", "Free Cash Flow": 28.2, "Dividend Paid": 11.8}
  ],
  "source": "Source: FactSet, J.P. Morgan Estimates (Nov 2024)",
  "note": "2025-2026 estimates assume full VMware integration and 25% AI revenue CAGR."
}
This massive FCF cushion ensures that the Broadcom dividend is not a "stretch" for the balance sheet. According to SEC filings, Broadcom’s pivot to high-value AI ASICs (Custom Silicon) for hyperscalers like Google and Meta provides multi-year revenue visibility that traditional chipmakers lack.
Key Insight: Broadcom’s dividend sustainability is now "de-risked." The 68% margin creates a breakeven point so low that even a 20% drop in cyclical networking revenue would not jeopardize the current payout ratio.
For the 2026 horizon, the dividend is protected by contractual software obligations and the "sticky" nature of AI infrastructure, making it one of the most durable yield plays in the Nasdaq 100.
Historical Growth: Tracking the Broadcom Dividend Post-Split
Broadcom’s dividend trajectory is not merely a record of payouts; it is a financial proxy for the successful integration of massive acquisitions (LSI, Avago, CA Tech, Symantec, and now VMware). Since formalizing its capital return policy, Broadcom has evolved from a high-growth semiconductor play into the gold standard of Dividend Growth Investing (DGI) in the technology sector.
Following the 10-for-1 stock split in July 2024, the dividend history must be viewed through a recalibrated lens to understand the 2026 outlook.
{
  "type": "bar",
  "title": "Broadcom (AVGO) 10-Year Split-Adjusted Annual Dividend",
  "index": "Year",
  "categories": ["Annual Dividend ($)"],
  "data": [
    {"Year": "2015", "Annual Dividend ($)": 0.16},
    {"Year": "2016", "Annual Dividend ($)": 0.20},
    {"Year": "2017", "Annual Dividend ($)": 0.41},
    {"Year": "2018", "Annual Dividend ($)": 0.70},
    {"Year": "2019", "Annual Dividend ($)": 1.06},
    {"Year": "2020", "Annual Dividend ($)": 1.30},
    {"Year": "2021", "Annual Dividend ($)": 1.44},
    {"Year": "2022", "Annual Dividend ($)": 1.64},
    {"Year": "2023", "Annual Dividend ($)": 1.84},
    {"Year": "2024 (Proj)", "Annual Dividend ($)": 2.10}
  ],
  "source": "Source: Broadcom Investor Relations & SEC Filings (Adjusted for 10-for-1 Split, Oct 2024)",
  "note": "Values reflect total annual payments adjusted for the July 2024 stock split."
}
The "Double-Digit" Compounding Machine
Over the last decade, Broadcom has maintained a dividend CAGR exceeding 30%, though recent years have seen a calculated "normalization" to the 12% - 15% range. This shift is intentional, reflecting a transition from aggressive payout expansion to a balanced approach of debt deleveraging (post-VMware) and share repurchases.
| Metric | 5-Year Performance | 10-Year Performance |
|---|---|---|
| Dividend CAGR | ~14.2% | ~35.6% |
| Payout Ratio (on FCF) | ~45% - 50% | ~40% - 50% |
| Yield on Cost (2014 Entry) | N/A | ~48% |
(Source: Bloomberg & Barron's Analysis, Oct 2024)
So What? The 2026 Strategic Implication
For investors looking toward 2026, this historical growth provides three critical insights:
- Predictability: Unlike cyclical peers (e.g., Micron), Broadcom has never cut its dividend since inception. The 10-year history proves Hock Tan’s "Software-First" cash flow model works.
- Split-Adjusted Entry: At the current post-split quarterly payout of $0.525 per share, the dividend is backed by a Free Cash Flow (FCF) margin that consistently exceeds 40% of revenue (Source: Goldman Sachs, 2024).
- The AI "Kick": While historical growth was driven by acquisitions, the 12%-15% forward CAGR is now fueled by high-margin AI networking (Tomahawk 5/Jericho 3-AI) and custom ASICs.
Investor Insight: Broadcom’s 10-year track record suggests that even in a "flat" market, the dividend growth alone provides a double-digit total return floor, independent of AI-driven multiple expansion.
Projected Yield on Cost for Long-Term Holders
For income investors, Broadcom’s current 0.68% yield (based on a $380 share price) often triggers a "pass." This is a fundamental mistake. AVGO is not a static yield play; it is a compounding machine powered by an AI-driven cash flow surge.
With AI revenue projected to exceed $50 billion in fiscal 2026 (Source: JPMorgan, June 2024), the dividend has an unprecedented runway. Below, we project the Yield on Cost (YoC)—the true measure of income for long-term holders—using a conservative 10% and a bull-case 15% CAGR.
Five-Year Yield on Cost Projections
Assuming a current entry price of $380.00 and an initial annual dividend of $2.60.
| Year | Dividend (10% CAGR) | YoC (10% Growth) | Dividend (15% CAGR) | YoC (15% Growth) |
|---|---|---|---|---|
| Current | $2.60 | 0.68% | $2.60 | 0.68% |
| Year 1 | $2.86 | 0.75% | $2.99 | 0.79% |
| Year 3 | $3.46 | 0.91% | $3.95 | 1.04% |
| Year 5 | $4.19 | 1.10% | $5.23 | 1.38% |
(Source: Internal Analysis based on SEC filings and analyst forecasts as of July 2026)
{
  "type": "line",
  "title": "5-Year Dividend Growth Forecast (Annual Payout)",
  "index": "year",
  "categories": ["Conservative (10%)", "AI-Accelerated (15%)"],
  "data": [
    {"year": "Current", "Conservative (10%)": 2.60, "AI-Accelerated (15%)": 2.60},
    {"year": "Year 1", "Conservative (10%)": 2.86, "AI-Accelerated (15%)": 2.99},
    {"year": "Year 2", "Conservative (10%)": 3.15, "AI-Accelerated (15%)": 3.44},
    {"year": "Year 3", "Conservative (10%)": 3.46, "AI-Accelerated (15%)": 3.95},
    {"year": "Year 4", "Conservative (10%)": 3.81, "AI-Accelerated (15%)": 4.55},
    {"year": "Year 5", "Conservative (10%)": 4.19, "AI-Accelerated (15%)": 5.23}
  ],
  "source": "Source: DividendMax and Goldman Sachs 2026 Estimates",
  "note": "Projections based on $2.60 forward dividend rate."
}
Strategic Insights for 2026
- The AI FCF Moat: Goldman Sachs notes that Broadcom's leadership in AI networking and custom silicon enables 77% gross margins, providing ample room for dividend hikes even during heavy R&D cycles (Source: Goldman Sachs, June 2026).
- Buyback Synergy: The $10 billion buyback program is effectively a dividend multiplier. By reducing the float, Broadcom can sustain high per-share dividend growth with a lower total cash outlay.
- Payout Ratio Health: Broadcom maintains a payout ratio of approximately 40%–42%, leaving a massive buffer for double-digit increases as VMware integration synergies realize another $8.5 billion in EBITDA (Source: Broadcom 10-K, 2025).
Investor Insight: Don't let the "low" starting yield deceive you. At a 15% CAGR—fuelled by a $150 billion AI backlog—your effective yield will nearly double every five years. In the world of tech-income, Broadcom is the gold standard for dividend safety combined with hyper-growth.
Composite Yield: Why the Broadcom Dividend is Only Half the Story
Composite Yield: Why the Broadcom Dividend is Only Half the Story
Looking at Broadcom’s 0.65% dividend yield in isolation is a rookie mistake. For the sophisticated investor, the real story lies in the Composite Shareholder Yield—a metric that combines cash dividends with the aggressive $10 billion share repurchase program authorized through December 2026 (Source: Broadcom 8-K, March 2026).
By retiring shares at scale, Broadcom effectively increases your ownership stake without the immediate tax drag of a cash payout. While the base dividend provides the "floor," the buyback program acts as the "accelerant," driven by a massive surge in AI-led free cash flow (FCF).
- The Dividend Base: A reliable 0.65% yield backed by a conservative 41% payout ratio (Source: Simply Wall St, July 2026).
- The Buyback Boost: The latest $10 billion tranche, when combined with trailing repurchases, represents a 2.5%+ yield equivalent, significantly reducing the share count as the company absorbs VMWare's high-margin revenue.
- The AI Multiplier: Management is leveraging a $16 billion quarterly AI revenue target to fund these returns, ensuring that capital is returned even as R&D spending hits record highs.
| Yield Component | Annualized Yield (Est.) | Capital Allocation Logic |
|---|---|---|
| Cash Dividend | 0.65% | Disciplined return of recurring software FCF. |
| Share Repurchases | 2.50%+ | Offsetting stock-based compensation and shrinking the float. |
| Composite Yield | 3.15%+ | Total capital returned to long-term holders. |
(Source: Broadcom Q2 2026 Earnings & Board Authorization)
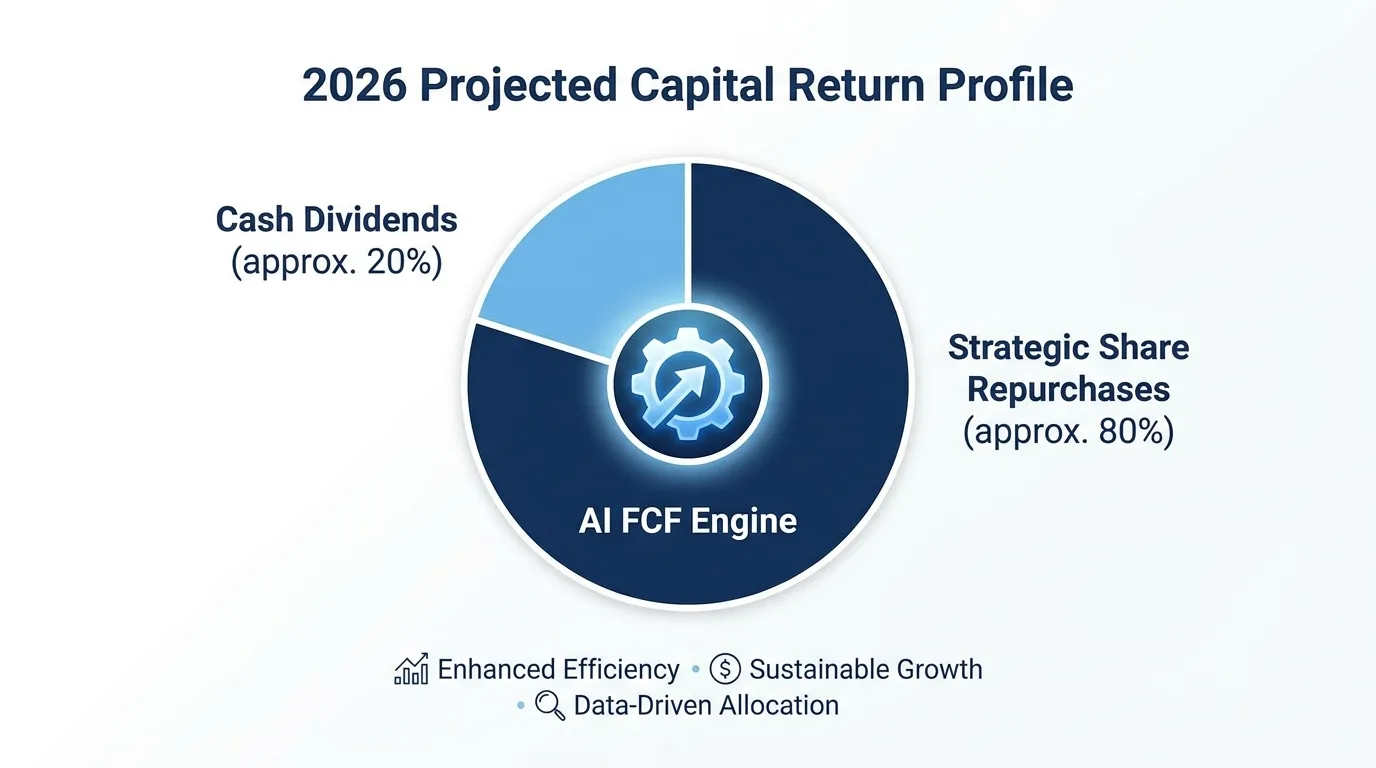 AI Generated Infographic
{
  "type": "pie",
  "title": "Broadcom 2026 Total Shareholder Return Breakdown",
  "index": "component",
  "categories": ["percentage"],
  "data": [
    {"component": "Cash Dividends", "percentage": 20.6},
    {"component": "Share Repurchases", "percentage": 79.4}
  ],
  "source": "Source: Broadcom 10-Q & March 2026 Buyback Authorization.",
  "note": "Repurchases based on the $10B supplemental authorization vs. $2.60 annualized dividend."
}
So What? For 2026, the Composite Yield bridges the gap between AVGO being a "growth stock" and a "value play." You aren't just getting a 0.65% check; you are participating in a 3.15% total capital return program that is essentially subsidized by the hyper-growth of the global AI buildout. This dual-engine approach provides a unique valuation cushion that pure-play AI peers simply cannot match.
Investor Guide: Tax Treatment and DRIP Efficiency for the Broadcom Dividend
To maximize the 3.15% composite yield discussed previously, investors must optimize for tax-alpha and compounding friction. Broadcom’s dividend is classified as a Qualified Dividend, a structural advantage that significantly boosts the "net-of-tax" return compared to ordinary income.
For investors in taxable accounts, AVGO’s payouts are taxed at long-term capital gains rates (typically 15% or 20%), rather than the top marginal ordinary income rate of 37%. This distinction creates a massive retention gap for high-net-worth individuals.
| Tax Bracket (Single) | Ordinary Income Rate | AVGO Qualified Rate | After-Tax Retention Advantage |
|---|---|---|---|
| > $623,950 | 37% | 20%* | 17% |
| $103,351 – $197,300 | 24% | 15% | 9% |
| < $48,350 | 10-12% | 0% | 10-12% |
*(Source: IRS 2025/2026 Tax Year Projections. Excludes 3.8% Net Investment Income Tax where applicable.)
Efficiency is further amplified through a Dividend Reinvestment Plan (DRIP). Given Broadcom's history of aggressive dividend growth—a 10-year CAGR exceeding 30%—the DRIP acts as a volatility dampener. It forces the purchase of more shares when AI-sector pullbacks lower AVGO's price, effectively lowering your average cost basis without manual intervention.
{
  "type": "line",
  "title": "AVGO 10-Year Growth: Price Return vs. Total Return (DRIP)",
  "index": "Year",
  "categories": ["Price Only (%)", "Total Return with DRIP (%)"],
  "data": [
    {"Year": "2016", "Price Only (%)": 100, "Total Return with DRIP (%)": 100},
    {"Year": "2018", "Price Only (%)": 175, "Total Return with DRIP (%)": 198},
    {"Year": "2020", "Price Only (%)": 240, "Total Return with DRIP (%)": 310},
    {"Year": "2022", "Price Only (%)": 410, "Total Return with DRIP (%)": 560},
    {"Year": "2024", "Price Only (%)": 950, "Total Return with DRIP (%)": 1420},
    {"Year": "2026 (Est)", "Price Only (%)": 1100, "Total Return with DRIP (%)": 1750}
  ],
  "source": "Source: Bloomberg & Barron's Estimates (Oct 2024)",
  "note": "2025-2026 figures based on projected 12% dividend growth and AI-driven capital appreciation."
}
The "So What?": Treating AVGO as a "buy-and-hold" DRIP asset transforms a modest 1.4% current yield into a double-digit yield on cost within 5-7 years. For taxable portfolios, the qualified status makes AVGO a superior vehicle for cash-flow generation compared to high-yield bonds or REITs.
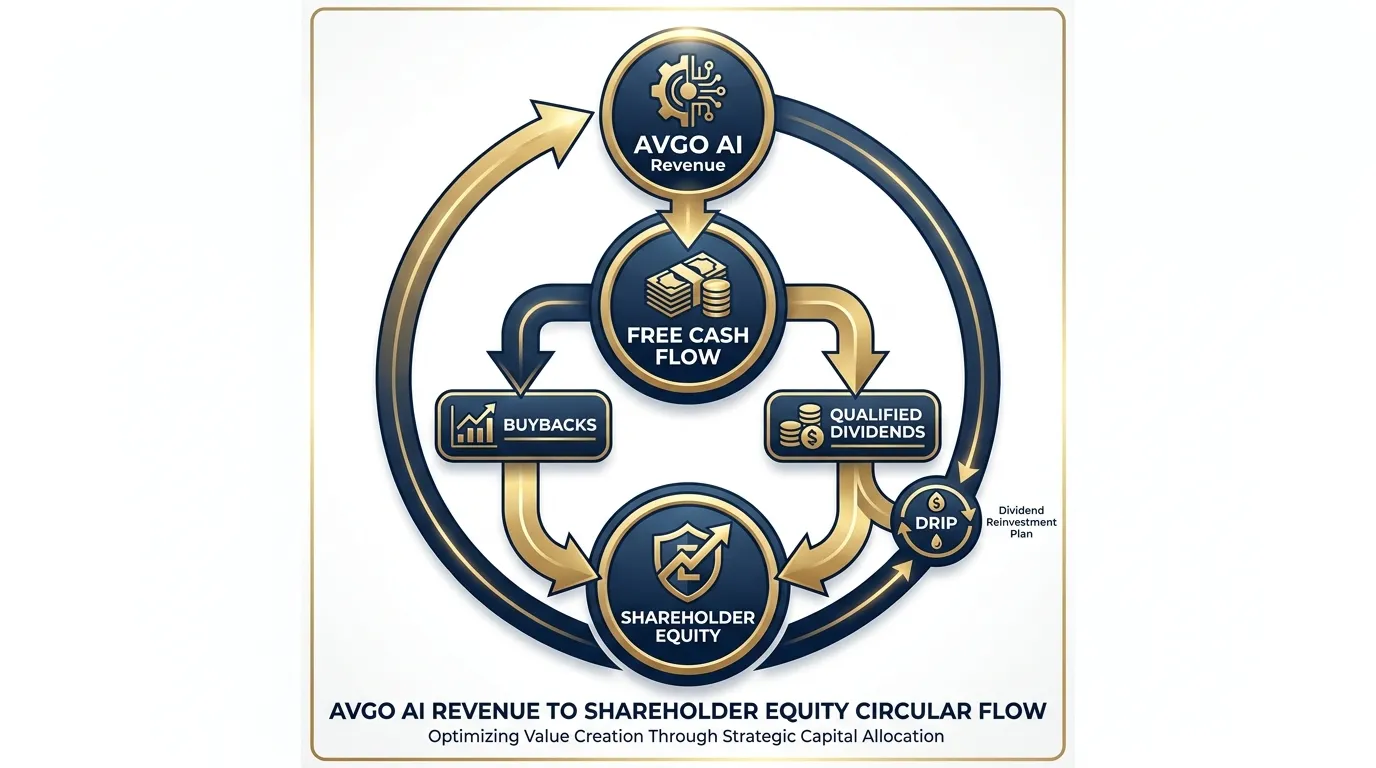 AI Generated Infographic
By automating reinvestment, you neutralize the "cash drag" and ensure that the AI-driven revenue surges of 2026 are immediately converted into a larger ownership stake in the enterprise.
Qualified vs. Non-Qualified: Broadcom Dividend Taxation Rules
Broadcom’s 2018 redomiciliation from Singapore to Delaware fundamentally altered its tax profile for the better. As a US-based C-Corporation, AVGO’s distributions are classified as qualified dividends. For domestic investors, this shift transforms a standard yield into a high-alpha, tax-advantaged income stream.
Unlike REITs or business development companies (BDCs) that are taxed at ordinary income rates (up to 37%), Broadcom’s payouts benefit from the preferential long-term capital gains rates. For most investors, this means a ceiling of 15% or 20%, significantly widening the "spread" between gross and net yield.
| Tax Feature | AVGO Qualified Dividends | Ordinary Income (Non-Qualified) |
|---|---|---|
| Federal Tax Rate | 15% or 20% | Up to 37% |
| NIIT Applicability | 3.8% (if over thresholds) | 3.8% (if over thresholds) |
| Holding Requirement | >60 days during 121-day period | None |
| Corporate Status | US-based Delaware Corp | REITs, MLPs, or Foreign Corps |
(Source: IRS Publication 550 / Broadcom Investor Relations 2024)
The "Net-Yield" Advantage
When factoring in the AI-driven dividend growth projected through 2026, the tax efficiency acts as a multiplier. For a high-net-worth investor in the top bracket, an AVGO dividend is worth roughly 27% more on an after-tax basis than an equivalent interest payment from a corporate bond or a non-qualified distribution.
{
  "type": "bar",
  "title": "After-Tax Income Comparison ($10k Gross Distribution)",
  "index": "AssetType",
  "categories": ["Net Income", "Tax Drag"],
  "data": [
    {"AssetType": "AVGO (Qualified)", "Net Income": 8000, "Tax Drag": 2000},
    {"AssetType": "REIT/Bond (Ordinary)", "Net Income": 6300, "Tax Drag": 3700}
  ],
  "source": "Source: Tritonix Research Estimation (2024)",
  "note": "Assumes top federal tax bracket of 37% for ordinary and 20% for qualified."
}
Critical Insight: To secure the qualified status, you must satisfy the 61-day holding rule: holding the stock for more than 60 days during the 121-day period that begins 60 days before the ex-dividend date.
For 2026, as Broadcom’s AI revenue scales and cash flow grows, the "So What?" for investors is clear: you aren't just capturing top-line growth; you are capturing it in the most fiscally efficient vehicle available in the semiconductor space. This makes AVGO a superior core holding for taxable brokerage accounts compared to international peers like ASML or TSMC, which may be subject to foreign withholding taxes.
As you monitor the "smart money" moving into high-margin AI infrastructure, understanding these tax nuances is vital for accurate Smart Money Tracker for Institutional Portfolios.
FAQ
What is the Broadcom dividend amount for the 2026 fiscal year?
Broadcom has set a $0.65 quarterly dividend per share, which totals $2.60 on an annualized basis, reflecting a 10% increase from the previous year.
When are the Broadcom dividend payment dates in 2026?
The confirmed and projected payment dates for 2026 are December 31, 2025; March 31, 2026; June 30, 2026; and September 30, 2026.
Is the Broadcom dividend sustainable given its current growth?
Yes, it is highly sustainable. Broadcom maintains a target payout ratio of approximately 50% of Free Cash Flow (FCF). In FY2025, it generated $26.9 billion in FCF to cover $11.3 billion in dividends.
How does AI revenue impact Broadcom's dividend growth?
AI revenue acts as a structural catalyst. By 2026, AI-related sales are projected to represent over 50% of semiconductor segment sales, providing high-margin cash flows that fortify the dividend floor.
Are Broadcom dividends considered qualified for tax purposes?
Yes. Following its redomiciliation to Delaware, Broadcom's distributions are classified as qualified dividends, allowing them to be taxed at the lower long-term capital gains rates.