Home / Ideas / CRWV 5m buy-now analysis
Long · CRWV · 5m · Stocks · 2026-06-09
CRWV 5m buy-now analysis
CRWV has stabilized above VWAP after a sharp gap-driven flush and recovery, but price is still trapped inside a 101.7-103.1 balance area with weak trend strength. The actionable long is not at current price; it is on a clean 5m reclaim through 103.10 that holds above VWAP and turns the right-edge range into continuation. If triggered, prior session liquidity near 104.2 can open a push toward 104.8, with 106.2 as a stretch if momentum expands. Any failed reclaim or 5m close back below 101.70 invalidates the setup.
Entry 103.15 · Stop 101.7 · Target 104.8
Analysis
CRWV 5m verdict: Wait, not a buy right now.
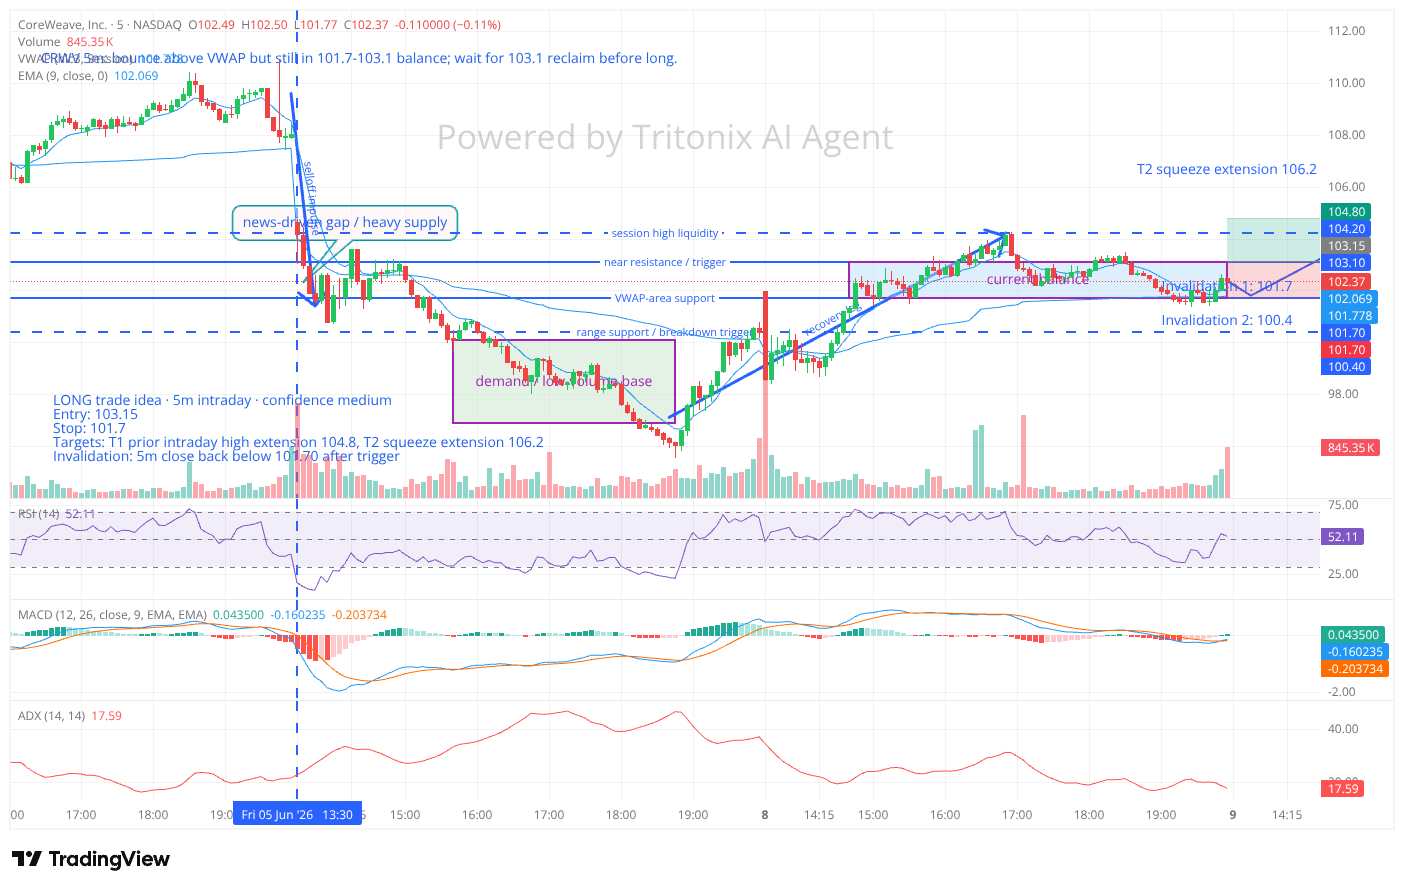
Annotated chart:
https://orxjyttejsgrinpotlvz.supabase.co/storage/v1/object/public/charts/tv-snapshots/NASDAQ_CRWV/2026-06-09/1780975818405-7czh4w7f.png
Saved layoutId: f4e02648-b08e-4182-8eb7-e0bd6d4e85e4
1) 5-minute technical read
Timeframe: 5m
- CRWV had a sharp news-driven gap/selloff on June 5, then built a mid-chart demand base around the high-96s to ~100.
- From that base, price staged a recovery leg into June 8, reaching roughly 104.2 before stalling.
- On the far right of the chart, price is now in a tight balance area between ~101.7 and 103.1.
- Current price is slightly above VWAP (~101.78) and above the 9 EMA (~102.07), which is constructive short term, but:
- RSI ~52 = neutral, not impulsive
- MACD has only barely turned positive
- ADX ~17.6 = weak trend strength / chop regime
Interpretation
This is not a clean momentum continuation entry yet.
It looks more like a range-bound reset after a recovery move, sitting just under nearby resistance. Buying inside this balance zone gives poor edge unless price reclaims 103.1 cleanly.
2) Key levels
Support
- 101.7 — first support / VWAP-area support / local balance floor
- 100.4 — more important support; losing this likely shifts setup bearish
- 96.9-100.1 — larger prior demand base from the visible left/middle structure
Resistance
- 103.1 — immediate trigger level / near resistance
- 104.2 — prior session high / liquidity pocket
- 104.8 — first logical breakout target
- 106.2 — stretch squeeze target
Liquidity / decision zones
- 101.7-103.1 — current intraday balance zone
- Above 104.2 — likely stops/short-cover fuel
- Below 100.4 — likely opens downside liquidity sweep
3) Scenario map
Bull case
- Price holds 101.7
- Reclaims 103.1 on a solid 5m close
- Holds above VWAP after breakout
- Then can squeeze into 104.2 -> 104.8 -> 106.2
Bear case
- Fails again under 103.1
- Loses 101.7
- Then a break of 100.4 would likely open a move back toward the prior lower acceptance area
Base case / most likely
- More chop inside 101.7-103.1 first
- Then either:
- breakout through 103.1, or
- breakdown through 101.7/100.4
- Right now the chart favors waiting for confirmation, not anticipating
4) Buy now or wait?
Decision: WAIT
I would not buy CRWV at current 5m price.
Reason:
- You’d be buying inside resistance, not through it
- Momentum is only modestly improving
- ADX says this is still a weak-trend / chop environment
- The better trade is to let price prove itself above 103.1
5) Structured trade idea
I did create a setup, but it is a triggered long, not a “buy-now” long.
Direction: Long
Timeframe: 5m intraday
Confidence: Medium
- Entry: 103.15
- Stop: 101.70
- Target 1: 104.80
- Target 2: 106.20
Why this setup works
- It waits for a range breakout
- Entry is above the immediate cap at 103.1
- Stop sits below the current balance floor
- T1 targets the prior high extension area with acceptable R/R
Invalidation
- 5m close back below 101.70 after trigger
- Failed breakout through 103.10 with heavy selling
- Loss of VWAP and momentum rollover
6) Volume / gap context
Relevant here.
- The chart shows a clear heavy-volume selloff gap on June 5, which matches recent news around insider selling pressure.
- The recovery that followed was real, but the stock is now digesting that move rather than trending strongly.
- Latest 5m quantitative read:
- RVOL > 3 on the latest bar cluster = still active
- But the market is not trending cleanly
- Practical read: volume is present, but it’s not yet directional enough to justify a blind buy into resistance.
7) Chart work completed
Done:
- Marked the news-driven gap
- Marked the selloff impulse
- Marked the demand base
- Marked the recovery leg
- Drew support/resistance
- Drew the most likely future price path
- Added a trade idea box
- Captured final annotated workspace
- Closed the workspace
If you want, I can also turn this into a one-paragraph user-facing answer for the main user, in a more concise “buy / wait / invalidation” format.