Home / Ideas / HYPEUSDT 1D wait-bias projected path Jun 25 2026
Watch · HYPEUSDT.P · 1D · Perp · 2026-06-25
HYPEUSDT 1D wait-bias projected path Jun 25 2026
The 1D trend is still broadly up, but current momentum is cooling: price is below the 9EMA, RSI is near 49, MACD is bearish, and ADX has faded. The cleaner long is not 'buy now' but a reclaim setup above 66.8 after support stabilizes, targeting 74.5 first and then a retest of 76.9. If 60-58 fails on a daily closing basis, the bullish continuation thesis weakens materially.
Entry 66.8 · Stop 59.8 · Target 74.5
Analysis
Done — I opened, marked up, projected, saved, and closed the 1D chart.
Final bias: WAIT
- Not a “buy now” on the 1D.
- The bigger trend is still bullish, but the current daily setup is cooling off, not re-accelerating.
Annotated chart
- Image: https://orxjyttejsgrinpotlvz.supabase.co/storage/v1/object/public/charts/tv-snapshots/BINANCE_HYPEUSDT.P/2026-06-25/1782361270381-jw4i8sdz.png
- Saved layout ID:
e61ce33a-da6d-4731-987f-920937b0a2a7
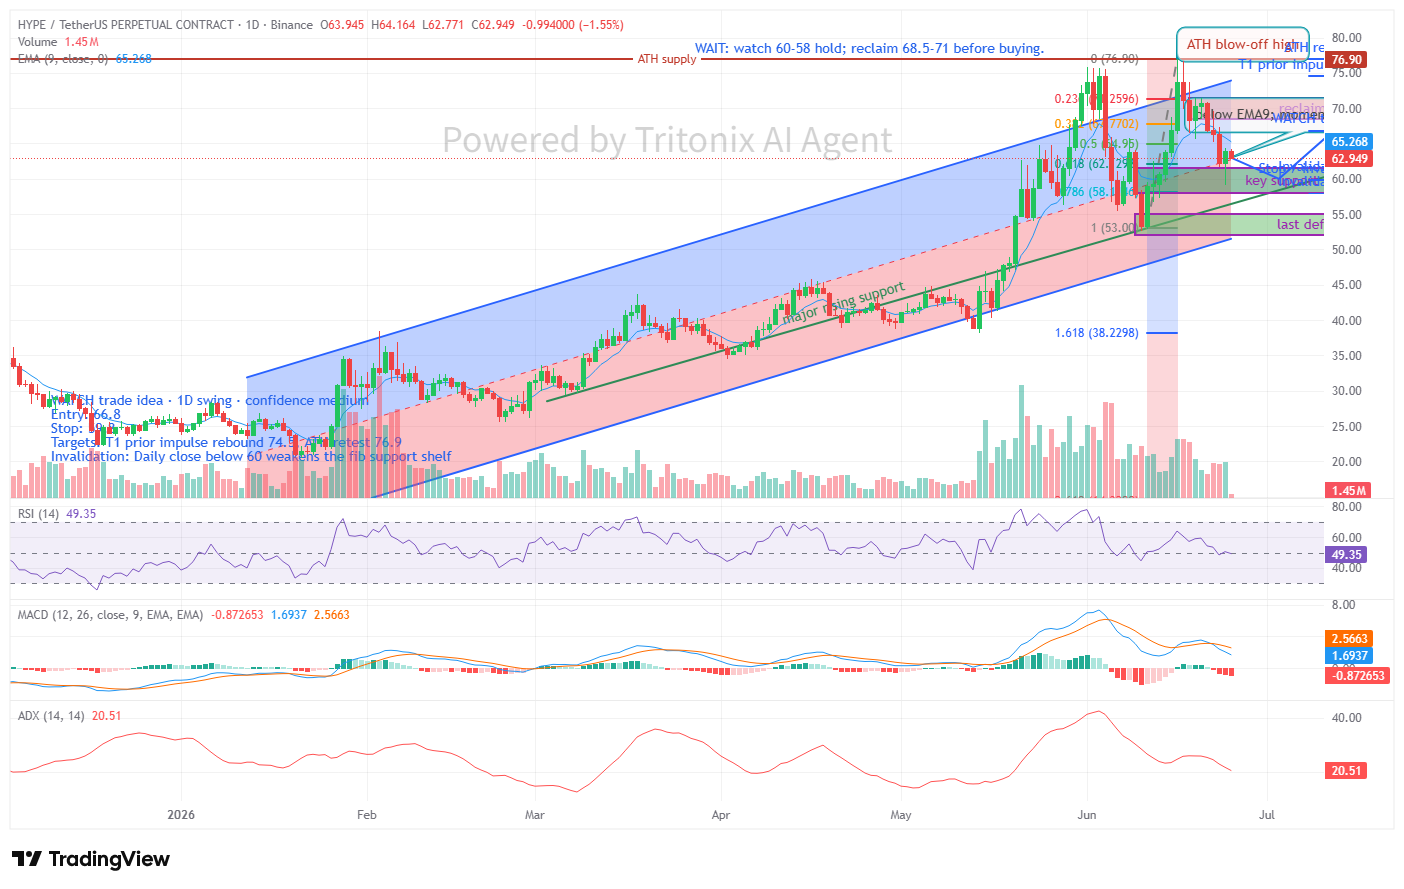
What I drew
- Rising macro trend channel / regression trend
- Major rising support ray
- Fib retracement from the Jun 11 low (~53) to the Jun 16 ATH (~76.9)
- Support zones and reclaim/resistance zone
- A forward path projection showing the most likely base case
Core read
Facts from the chart
- Price is around 62.95
- EMA9 ≈ 65.27 → price is below it
- RSI ≈ 49.35 → neutral to soft, not strong
- MACD is bearish / rolling lower
- ADX ≈ 20.5 → trend strength has faded
- Structure remains bullish on a larger basis, but short-term momentum is no longer clean
Interpretation
- This looks more like a post-ATH digestion / pullback than a fresh buy-now breakout.
- The chart favors chop or a retest into support first, then a possible rebound if buyers defend the zone.
Key levels
Support
- 60 to 58 = main support / fib pullback zone
- 55 to 52 = last defense if 58 breaks
Resistance
- 68.5 to 71 = reclaim zone; needs to be recovered before a cleaner long
- 74.5 = first upside objective on recovery
- 76.9 = ATH supply / major resistance
Most likely path
Base case I drew:
- Short-term dip / retest into 60–58
- Bounce toward 66–69
- Some chop / retest
- If price reclaims 68.5–71, then continuation toward 74.5, possibly 76.9
Bearish alternate
- A daily close below 58 weakens the bullish continuation thesis and opens a deeper pullback toward the low-50s.
Trade plan
This is not an active buy-now setup, so I framed it as a watch setup:
- Direction: neutral-watch
- Trigger / entry: 66.8
- Stop: 59.8
- Target 1: 74.5
- Target 2: 76.9
News context
Recent HYPE headlines have been fundamentally supportive:
- ETF / platform activity and buyback narrative helped fuel the run to ATH
- But there’s also token unlock / supply-overhang chatter, which fits the current volatile pullback behavior
Bottom line
Can they buy now?
No — better to wait.
Best bullish confirmation:
- 60–58 holds
- then price reclaims 68.5–71
Best invalidation:
- Daily close below 58
If you want, I can also do a 2nd pass on 4H to refine the entry timing inside this daily setup.