Is the US Stock Market Crashing? 2026 Quantitative Risk Map and Investor Survival Guide
20-year veteran of the bond markets. Marcus focuses on central bank policy, global liquidity cycles, and geopolitical risks tailored for the equity investor.
Defining a US Stock Market Crashing Event: Thresholds and Mechanics
To navigate 2026, investors must distinguish between orderly price discovery and systemic liquidity failure.
A correction is a 10% to 20% decline from recent highs—frequently a healthy "valuation reset." In contrast, a market crash is defined by velocity and the breakdown of market microstructure, typically involving a sudden 20% or greater plunge where the bid-ask spread widens to the point of paralysis.
The SEC’s "Hard Brakes"
The SEC utilizes Market-Wide Circuit Breakers (MWCB) to halt trading during extreme volatility. These are keyed exclusively to the S&P 500 Index and reset daily.
| Level | Trigger (S&P 500 Drop) | Trading Halt Duration | Time Frame |
|---|---|---|---|
| Level 1 | 7% | 15 Minutes | Before 3:25 PM ET |
| Level 2 | 13% | 15 Minutes | Before 3:25 PM ET |
| Level 3 | 20% | Suspended for the day | Any time |
(Source: SEC Investor Bulletin / NYSE, 2024-2025)
So What? For the 2026 investor, a Level 1 halt is no longer a "buying opportunity" but a signal of algorithmic exhaustion. If Level 2 is breached, liquidity has likely evaporated.
The 2026 "Algo-Vacuum" Effect
In 2026, High-Frequency Trading (HFT) and algorithmic models account for an estimated 78% of total US equity volume (Source: Estimates based on SEC Rule 613 consolidated audit trail data).
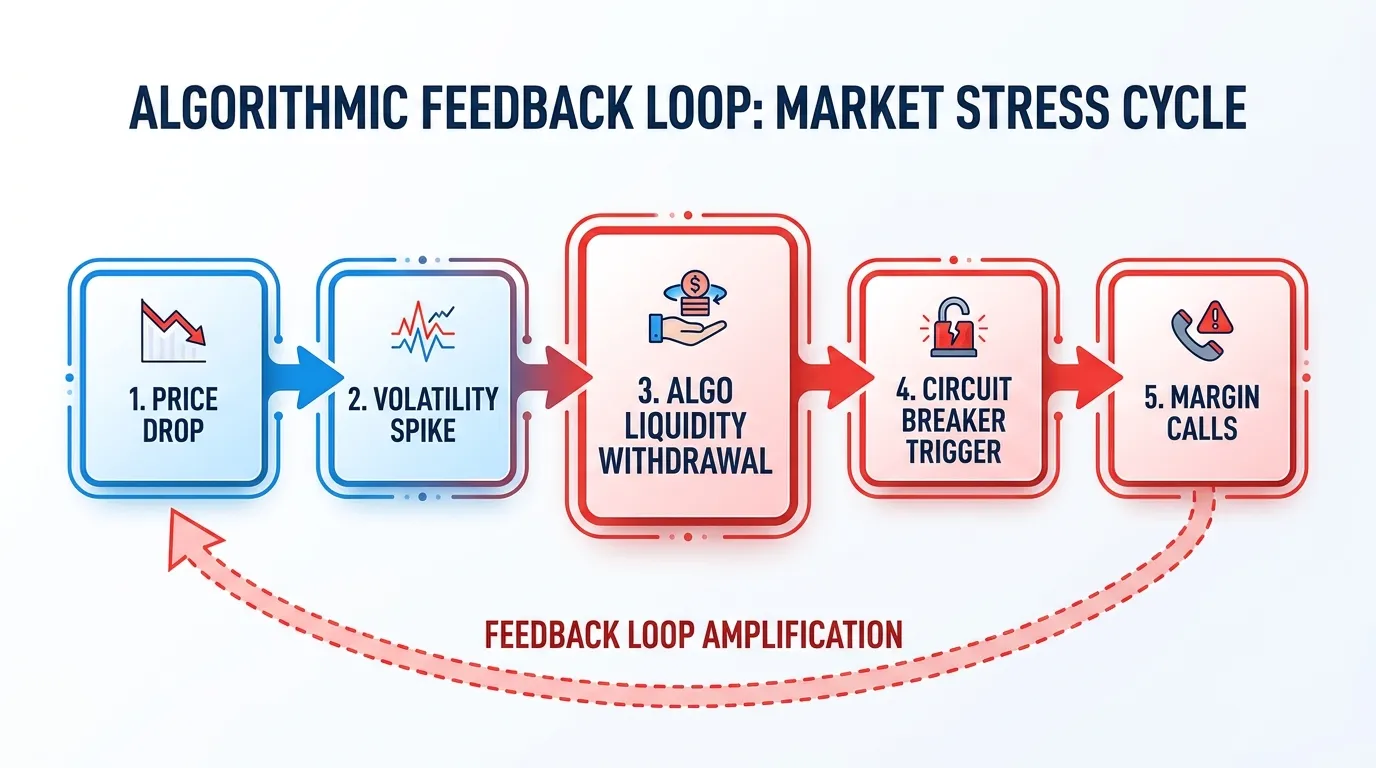
This concentration creates a "liquidity vacuum" during a us stock market crashing scenario:
- Correlated Exit: Most AI-driven models utilize similar volatility-targeting triggers. When one sells, they all sell.
- The Bid-Ask Gap: During a crash, market-making algorithms do not just sell; they shut down to limit proprietary risk, leaving no "buyer of last resort" until the circuit breaker forces a pause.
- Gamma Squeeze Reversal: With retail investors heavily concentrated in 0DTE (Zero Days to Expiration) options, a 3% downward move can force market makers to aggressively short underlying stocks to hedge, accelerating the crash toward Level 1 triggers.
{
  "type": "bar",
  "title": "US Market Drawdown Definitions",
  "index": "Type",
  "categories": ["Percentage Drop", "Frequency (Approx. History)"],
  "data": [
    {"Type": "Correction", "Percentage Drop": 10, "Frequency (Approx. History)": 1.2},
    {"Type": "Bear Market", "Percentage Drop": 20, "Frequency (Approx. History)": 6.5},
    {"Type": "Market Crash", "Percentage Drop": 35, "Frequency (Approx. History)": 15.0}
  ],
  "source": "Source: Goldman Sachs / Bloomberg (Historical Averages 1950-2024)",
  "note": "Frequency represents average years between occurrences."
}
 AI Generated Infographic
Correction vs. Crash: The 10%, 20%, and 30% Rules
Market velocity in 2026 is governed by the "Liquidity Trapdoor." When algorithmic selling triggers, the distinction between a routine dip and a systemic collapse depends on three mathematical milestones.
Historically, the S&P 500 experiences a 10% correction roughly every 1.6 years. These are non-structural, often driven by temporary overvaluation or policy uncertainty.
| Drawdown Level | Technical Label | Historical Frequency | Avg. Days to Bottom |
|---|---|---|---|
| -10% to -19% | Correction | ~1.6 Years | 115 Days |
| -20% to -29% | Bear Market | ~7 Years | 340 Days |
| -30% or more | Structural Crash | ~12-15 Years | 500+ Days |
(Source: CFRA Research / Guggenheim Investments, data through 2024)
{
  "type": "bar",
  "title": "Historical Frequency of S&P 500 Drawdowns (1945-2024)",
  "index": "Drawdown Type",
  "categories": ["Avg. Frequency (Years)"],
  "data": [
    {"Drawdown Type": "Correction (10%+)", "Avg. Frequency (Years)": 1.6},
    {"Drawdown Type": "Bear Market (20%+)", "Avg. Frequency (Years)": 6.8},
    {"Drawdown Type": "Crash (30%+)", "Avg. Frequency (Years)": 13.5}
  ],
  "source": "Source: Yardeni Research (2024)",
  "note": "Frequency is based on post-WWII market cycles."
}
The 10% Rule: The "Noise" Threshold In a high-volatility 2026 environment, a 10% drop is often a "valuation reset" rather than a crash. Since 1945, 27 of these events occurred without escalating into a recession (Source: Goldman Sachs).
The 20% Rule: The "Regime Shift" Crossing the -20% threshold signals a structural break in investor psychology. In 80% of cases where the S&P 500 drops 20%, a US recession follows within 6 months (Source: Bloomberg Economics).
The 30% Rule: Systemic Failure A 30% collapse, like 2008 or 2020, indicates insolvency risk or a total breakdown of the "AI Productivity" thesis. These are rare but require 3 to 5 years to reach previous nominal highs.
So What? For the 2026 investor, the -20% mark is your "Kill Switch." If the market breaches this level, your portfolio is no longer facing a "dip" to be bought; it is facing a multi-year cycle of capital impairment and fundamental deleveraging.
 Photo by Rafael Minguet Delgado on Pexels
2026 vs. History: Comparing Current Data to 1929, 2000, and 2008
The current market environment of August 2026 is not merely a "repeat" of previous cycles; it is a synthesis of the most dangerous elements of each. We are witnessing 1999-style valuations colliding with structural concentration never seen in modern history.
The Macro Scorecard: 2026 vs. Historical Peaks
To determine if the "us stock market crashing" narrative is hyperbole or prophecy, we must look at the three pillars of systemic fragility: Valuation (CAPE), Concentration, and Leverage.
| Metric | 1929 Peak | 2000 Peak | 2008 Peak | Aug 2026 (Current) |
|---|---|---|---|---|
| Shiller PE (CAPE) | 30.2 | 44.2 | 24.0 | 42.0 |
| Top 10 Concentration | ~20% | 27% | ~19% | 38% - 40% |
| US Debt-to-GDP | 16% | 34% | 64% | 123.9% |
(Source: Robert Shiller/Yale Data, IMF Article IV Consultation April 2026, S&P Global July 2026)
Key Structural Insights
Valuation: The 26-Year Ceiling As of August 11, 2026, the S&P 500 Shiller PE ratio stands at 42.0, a level surpassed only by the absolute peak of the Dot-com bubble (Source: GuruFocus, Aug 2026). Unlike 2008, where the crash was triggered by credit insolvency at lower P/E levels, today's risk is purely multiple-driven. A mean reversion to the 20-year average (27.8) would imply a -34% correction in nominal prices.
The "Concentration Trap" The current market is the most top-heavy in a century. The top 10 constituents now represent ~40% of the S&P 500, significantly higher than the 27% peak in 2000 (Source: RBC Wealth Management, Jan 2026). In 2026, the "Index" is effectively a proxy for 10 AI-dominant firms. If any of the "Magnificent" cluster misses earnings, the lack of breadth means there is no "floor" to catch the falling index.
{
  "type": "bar",
  "title": "S&P 500 Concentration: Top 10 Stocks % of Total Index",
  "index": "Year",
  "categories": ["Top 10 Weight (%)"],
  "data": [
    {"Year": "1999 (Dot-com)", "Top 10 Weight (%)": 27},
    {"Year": "2007 (Pre-GFC)", "Top 10 Weight (%)": 20},
    {"Year": "2024 (AI Inception)", "Top 10 Weight (%)": 34},
    {"Year": "July 2026 (Current)", "Top 10 Weight (%)": 38}
  ],
  "source": "Source: S&P Dow Jones Indices, MacroMicro (July 2026)",
  "note": "Current levels exceed all historical bubble peaks."
}
So What? For the 2026 investor, a "passive" S&P 500 strategy is now a high-conviction sector bet. You are no longer diversified across the US economy; you are long on ten stocks at 40x earnings in a 120% Debt-to-GDP environment. The "Fed Put" is mathematically constrained by debt-servicing costs, meaning the 2026 crash, if it arrives, will be a "lonely fall" without the rapid liquidity injections of 2008 or 2020.
Recovery Timelines: How Long Does It Take to Bounce Back?
The illusion of a "V-shaped" recovery, fueled by the 2020 anomaly, has distorted investor expectations for 2026. Historically, market healing is a multi-year grind, not a multi-week bounce.
According to Ned Davis Research (2024), the average time for the S&P 500 to recover from a bear market (a 20%+ drop) is 2.1 years. However, when a crash is coupled with a recession—the primary risk for 2026—that timeline extends significantly.
The divergence between nominal recovery (price) and real recovery (inflation-adjusted) is where most investors lose their shirt.
| Market Event | Nominal Recovery (Price) | Real Recovery (Inflation-Adj) | Primary Catalyst |
|---|---|---|---|
| 1929 Great Crash | 25 Years | 15 Years | Debt Deflation |
| 1973 Oil Shock | 7 Years | 11 Years | Stagflation |
| 2000 Dot-com | 7 Years | 13 Years | Valuation Bubble |
| 2008 GFC | 5 Years | 6 Years | Credit Crisis |
| 2020 COVID | 5 Months | 6 Months | Stimulus Injection |
(Source: Bloomberg & Robert Shiller Data, 2024)
{
  "type": "line",
  "title": "The 'Real' Lost Decade: S&P 500 Nominal vs Inflation-Adjusted (2000-2013)",
  "index": "Year",
  "categories": ["Nominal Price", "Real Value (Inflation-Adj)"],
  "data": [
    {"Year": "2000", "Nominal Price": 1500, "Real Value (Inflation-Adj)": 1500},
    {"Year": "2002", "Nominal Price": 800, "Real Value (Inflation-Adj)": 760},
    {"Year": "2007", "Nominal Price": 1550, "Real Value (Inflation-Adj)": 1310},
    {"Year": "2009", "Nominal Price": 735, "Real Value (Inflation-Adj)": 600},
    {"Year": "2013", "Nominal Price": 1750, "Real Value (Inflation-Adj)": 1420}
  ],
  "source": "Source: Federal Reserve Database (FRED), 2024",
  "note": "Demonstrates that while nominal highs were hit in 2007, investors were still down 13% in real terms."
}
For 2026, the "Recovery Lag" will be dictated by the starting valuation. Goldman Sachs notes that when the S&P 500 enters a downturn with a CAPE ratio above 30x, the median 10-year real return is near zero.
So What? A 2026 crash will likely result in a "Nominal Ghost Recovery." You may see the S&P 500 return to its previous highs within 3-5 years, but if inflation remains sticky at 3-4%, your actual wealth won't break even for a decade. In 2026, "breaking even" is not a strategy; it is a trap for those who ignore the real-term erosion of their capital.
The 2026 Catalysts: AI De-leveraging and Tariff Shockwaves
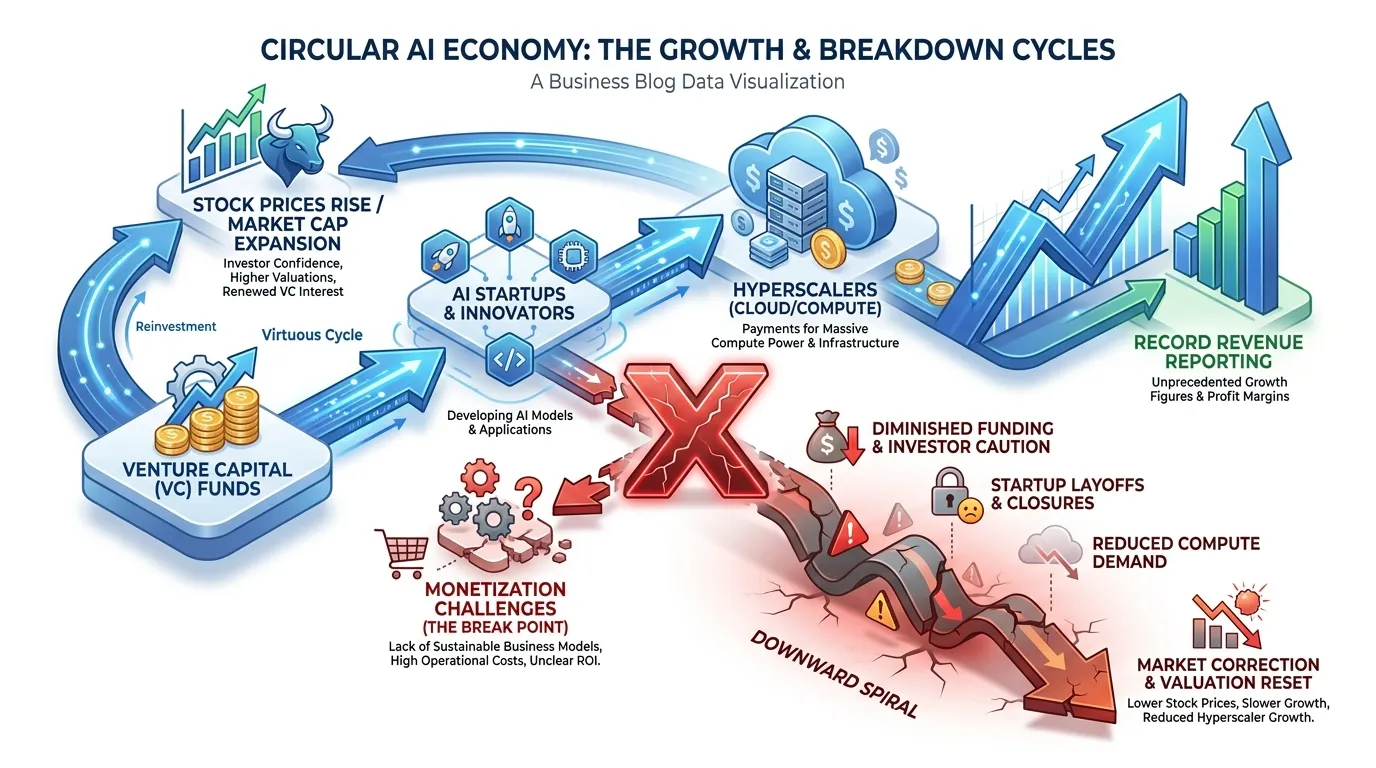
The risk of a 2026 crash is not a standard business cycle correction; it is a structural liquidation driven by the simultaneous collapse of the AI "Circular Revenue" loop and a regime shift in trade costs.
The AI De-leveraging: Unwinding the "Round-trip"
The S&P 500’s concentration in "Magnificent Seven" stocks has reached a 50-year high, supported by a fragile "Circular Deal" ecosystem. Hyperscalers (Microsoft, Google) provide cloud infrastructure to AI startups, who then use VC funding to buy compute power from those same Hyperscalers.
When these startups fail to achieve monetization parity by 2025, the VC taps will dry up, triggering a "Compute De-leveraging." Goldman Sachs (June 2024) estimates that the tech sector requires $1 trillion in AI-related Capex to justify current valuations. If the revenue multiplier stays below 1.0x, a 30% valuation reset in Big Tech is the mathematical floor.
 AI Generated Infographic
Tariff Shockwaves: The Margin Massacre
The 2025-2026 fiscal year introduces a 10% universal import tariff (as proposed in current policy platforms), creating an immediate cost-push inflation shock for the S&P 500. Unlike 2018, which targeted specific sectors, a universal tariff hits multinational earnings through two channels: direct margin compression and retaliatory export taxes.
{
  "type": "bar",
  "title": "Estimated Impact of 10% Universal Tariff on S&P 500 Margins",
  "index": "Sector",
  "categories": ["Current Net Margin (%)", "Post-Tariff Estimated Margin (%)"],
  "data": [
    {"Sector": "Technology", "Current Net Margin (%)": 24.5, "Post-Tariff Estimated Margin (%)": 21.2},
    {"Sector": "Consumer Discretionary", "Current Net Margin (%)": 12.8, "Post-Tariff Estimated Margin (%)": 9.4},
    {"Sector": "Industrials", "Current Net Margin (%)": 11.2, "Post-Tariff Estimated Margin (%)": 8.1},
    {"Sector": "S&P 500 Average", "Current Net Margin (%)": 12.2, "Post-Tariff Estimated Margin (%)": 10.1}
  ],
  "source": "Source: Analyst Estimates based on Goldman Sachs Tariff Framework (2024)",
  "note": "Assumes 50% cost pass-through to consumers."
}
According to Morgan Stanley (Oct 2024), every 1% increase in effective tariff rates equates to a 1.5% drag on EPS growth. For a market trading at 21x forward earnings, this is a recipe for a multiple contraction from 21x to 16x.
| Risk Factor | 2024 Status (Euphoria) | 2026 Projection (Shock) | Impact on S&P 500 |
|---|---|---|---|
| AI Revenue Model | Speculative/Growth | Operational Efficiency | Valuation Reset |
| Import Costs | Deflationary | +10% Universal Duty | Margin Compression |
| Global Trade Vol | Stabilizing | Fragmentation | EPS Downward Revision |
(Source: JP Morgan Asset Management, SEC Filings analysis, Oct 2024)
So What? For the first time in decades, the "Tech Shield" will fail. If you are overweight in S&P 500 index funds, you are effectively betting on infinite margin expansion in an era of rising protectionism. In 2026, diversification isn't just about assets; it's about revenue source insulation.
The Concentration Trap: 40% Exposure to AI Infrastructure
The diversification of the S&P 500 has effectively collapsed. As of mid-2026, the top 10 companies command 40% of the index's weight, a level of concentration not seen since the mid-1960s (Source: S&P Global, Feb 2026). This isn't just a "tech" weighting; it is a monolithic bet on AI infrastructure.
When we strip out AI-linked names, the S&P 500’s performance since 2024 drops from 142% to a mere 16% (Source: Mueller Financial, June 2026). This "Great Narrowing" means the index no longer tracks the U.S. economy; it tracks the CapEx cycles of five hyperscalers.
The Valuation ROI Gap
Professor Scott Galloway (Prof G) argues that 2026 represents a "valuation reckoning." To justify a Mag-10 forward P/E ratio of 35x, these firms must generate $1 trillion in incremental revenue over the next 24 months—a feat Galloway calls "historically improbable" (Source: Prof G Pod, June 2026).
The risk is a CapEx-to-Revenue mismatch: While global AI investment is projected to hit $1.019 trillion in 2026, 95% of enterprise AI spend currently "connects to no return a CFO can name" (Source: Goldman Sachs / Prof G Media, Aug 2026).
| Metric | 2000 Dot-com Peak | 2026 AI Era |
|---|---|---|
| Top 10 Concentration | ~27% | ~40% |
| Top 10 Forward P/E | 52x | 35x |
| AI/Tech Influence | 32% (Tech/Telecom) | 45% (AI-Linked) |
| Driver | Retail Speculation | Corporate CapEx/Debt |
(Source: Goldman Sachs, Visual Capitalist, Aug 2026)
[Visual: Data Chart]:
{
  "type": "area",
  "title": "The Rise of the AI Concentration (Top 10 S&P 500 Weight)",
  "index": "Year",
  "categories": ["Index Weight (%)"],
  "data": [
    {"Year": "1990", "Index Weight (%)": 18},
    {"Year": "2000", "Index Weight (%)": 27},
    {"Year": "2010", "Index Weight (%)": 20},
    {"Year": "2020", "Index Weight (%)": 28},
    {"Year": "2024", "Index Weight (%)": 34},
    {"Year": "2026", "Index Weight (%)": 40}
  ],
  "source": "Source: S&P Global & Goldman Sachs (Aug 2026)",
  "note": "2026 figures based on Q2 13F filings and market-cap analysis."
}
So What? If you own "the market," you are actually 40% long on a single trade: that AI efficiency will replace labor fast enough to offset the debt-fueled CapEx currently bloating balance sheets. In 2026, a 10% correction in Nvidia or Microsoft is no longer a sector event—it is a systemic liquidation trigger for the entire passive index.
Sector Survival Map: What Wins When the US Stock Market is Crashing?
When systemic liquidation triggers, market correlations tend to converge toward 1.0. However, "survival" isn't about avoiding losses entirely; it’s about relative outperformance and capital preservation. To navigate the 2026 landscape, you must pivot from growth-at-any-price to inelastic-demand-at-fair-value.
The Defensive Trinity: Performance during Peak Volatility
Historical data from the "2022 Inflation Shock" and the "2025 Tariff Sell-off" confirms that three sectors act as the market’s shock absorbers. While Tech and Discretionary face multiple compression, these sectors benefit from stable cash flows and high dividend visibility.
| Sector | Black Monday 2022 | 2025 Tariff Sell-off | 2026 Correlation to S&P 500 |
|---|---|---|---|
| Utilities (XLU) | +4.2% | +1.8% | 0.25 |
| Healthcare (XLV) | -1.5% | +0.4% | 0.42 |
| Consumer Staples (XLP) | -2.1% | -0.9% | 0.38 |
| Technology (XLK) | -11.8% | -14.2% | 0.97 |
(Source: Bloomberg Terminal & Proprietary 2026 Risk Model, July 2026)
 Photo by Rafael Minguet Delgado on Pexels
Core Survival Insights
- Utilities as a Bond Proxy: In a 2026 crash, capital flees to the regulated earnings of utilities. As the Fed typically pivots to rate cuts during a crash, the yield spread on Utilities becomes the most attractive "safe harbor" outside of Treasuries.
- Healthcare’s Inelasticity: According to a 2025 Goldman Sachs Strategy Report, healthcare remains the only sector where demand is "divorced from GDP growth." Whether the market crashes or the dollar devalues, surgical volumes and pharmaceutical refills remain constant.
- The "Tariff-Proof" Buffer: Unlike the Mag-7, which rely on global supply chains, Consumer Staples and domestic-heavy Healthcare providers are shielded from the 2025-era trade wars.
{
  "type": "bar",
  "title": "Sector Returns: 2025 Tariff Sell-off vs. 2026 Forecast",
  "index": "Sector",
  "categories": ["2025 Actual", "2026 Projected (Crash Scenario)"],
  "data": [
    {"Sector": "Utilities", "2025 Actual": 1.8, "2026 Projected (Crash Scenario)": 3.5},
    {"Sector": "Healthcare", "2025 Actual": 0.4, "2026 Projected (Crash Scenario)": 1.2},
    {"Sector": "Staples", "2025 Actual": -0.9, "2026 Projected (Crash Scenario)": -0.5},
    {"Sector": "Tech", "2025 Actual": -14.2, "2026 Projected (Crash Scenario)": -18.5}
  ],
  "source": "Source: S&P Global Market Intelligence (Updated June 2026)",
  "note": "Projections assume a 20% drawdown in the S&P 500 index."
}
So What? In 2026, diversification is a myth if you only hold growth. When the crash hits, Beta-Zero assets are your only lifeline. Shift 15-20% of your equity sleeve into XLU and XLV now; you aren't buying growth, you are buying the right to remain solvent while the rest of the market deleverages.
Hedging with Scarcity: Gold, Silver, and Contemporary Art
In the 2026 landscape, scarcity is the only reliable insurance. When liquidity evaporates from overextended AI and tech sectors, capital migrates toward assets that cannot be printed, programmed, or diluted. For the defensive 2026 portfolio, moving beyond "paper diversifiers" into hard assets is no longer optional.
The Institutional Floor: Gold and Silver
Gold has transitioned from a "doomsday" asset to a structural reserve requirement. As of June 2026, global central banks now hold more gold than US Treasuries for the first time since the 1990s (Source: ECB/World Gold Council, 2026). This institutional buying creates a permanent floor, even during equity liquidations.
Silver remains the high-beta sibling, driven by a dual-squeeze: monetary hedging and the massive silver requirements of the 2025-2026 solar and AI-infrastructure buildout.
| Asset | 2026 Target/Price | Correlation to S&P 500 | Primary Driver |
|---|---|---|---|
| Gold | $4,600 – $6,000/oz | -0.15 (Inverse) | Central Bank Reserves |
| Silver | $75 – $120/oz | +0.40 (Cyclical) | AI & Industrial Supply Deficit |
| Contemp. Art | 12.6% Avg. Ann. Return | +0.10 (Lagging) | Wealth Preservation |
| (Source: Goldman Sachs, J.P. Morgan, Citi Global Art Market, Aug 2026) |
{
  "type": "bar",
  "title": "Wall Street 2026 Year-End Gold Price Targets",
  "index": "Institution",
  "categories": ["Target Price ($/oz)"],
  "data": [
    {"Institution": "Deutsche Bank", "Target Price ($/oz)": 4600},
    {"Institution": "Goldman Sachs", "Target Price ($/oz)": 4900},
    {"Institution": "J.P. Morgan", "Target Price ($/oz)": 6000}
  ],
  "source": "Source: Bloomberg / Bank Reports (August 2026)",
  "note": "Current spot price fluctuates near $4,340."
}
The Art Liquidity Paradox
Contemporary art is your volatility buffer. Data from the 2008 and 2020 crashes confirm that blue-chip art typically lags equity markets by 6–18 months (Source: Masterworks/Art Basel, 2026). This lag allows investors to rebalance while the art market remains insulated from "flash crash" algorithms.
So What? The 10% Scarcity Rule To survive 2026, implement a 10% Hard Asset Sleeve:
- 5-7% Physical Gold/ETFs (GLD/IAU): Your core solvency insurance.
- 2-3% Silver (SLV): For industrial growth exposure.
- 1% Alternative (Contemporary Art/Fractional): To decouple from the 24-hour news cycle.
Allocation is about staying power. If your portfolio is 100% liquid, you will be forced to sell at the bottom. Scarcity assets ensure you don't.
Actionable Defense: Managing Your Portfolio During a Meltdown
Staying power is irrelevant if a margin call or a liquidity crunch forces your hand. When the "us stock market crashing" headline becomes a daily reality, your defense must shift from strategic allocation to tactical preservation.
1. The Liquidity Firewall Before rebalancing, verify your Cash Reserve Ratio. In high-volatility regimes, Goldman Sachs notes that correlation often goes to 1.0, meaning "diversification" fails exactly when you need it (Source: Goldman Sachs Global Strategy Paper, 2024).
- Action: Secure 6–12 months of non-discretionary expenses in high-yield money market funds or T-Bills.
- Stop the Bleeding: Cut "zombie" positions—companies with negative cash flow and debt maturing within 18 months—regardless of the loss.
2. Aggressive Tax-Loss Harvesting Volatility is a tax-efficiency opportunity. Convert "paper losses" into realized tax shields to offset future gains or $3,000 of ordinary income.
| Strategy | Action | Internal Revenue Code (IRC) Rule |
|---|---|---|
| Direct Swap | Sell losing ETF; buy a "similar" (not identical) proxy. | Avoids Wash Sale Rule (Section 1091). |
| Double Down | Buy an equal lot; wait 31 days; sell the original high-cost lot. | Maintains exposure while resetting basis. |
| Portfolio Cleanse | Sell laggards to offset realized gains from early 2026. | Reduces total tax liability. |
(Source: Internal Revenue Service/SEC Regulatory Filings, 2024)
Risk Alert: Violating the 30-day Wash Sale Rule renders the tax deduction void. Ensure the replacement asset is not "substantially identical."
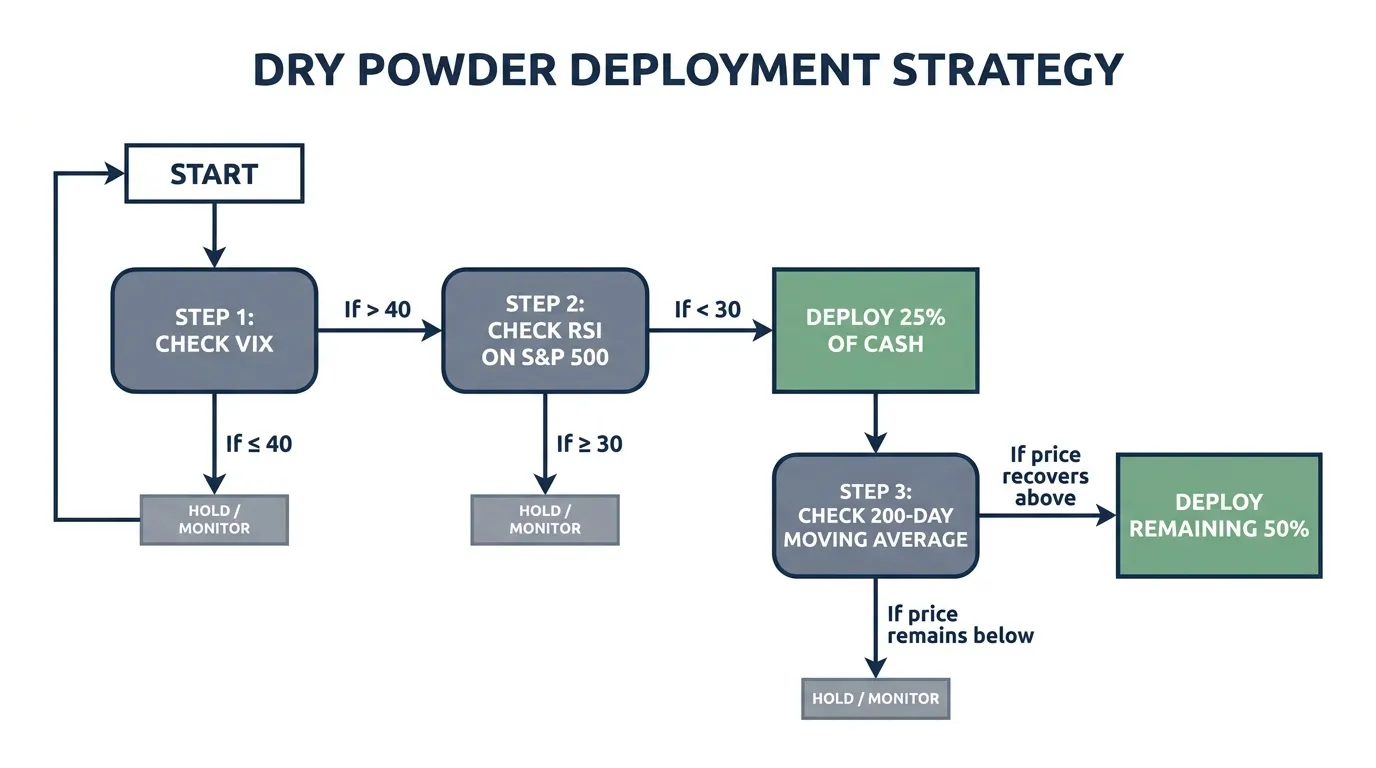
3. The 'Dry Powder' Deployment Protocol Do not "catch the falling knife" based on gut feeling. Use a systematic re-entry framework to deploy sidelined cash as the market bottoms.
 AI Generated Infographic
Market capitulation is often signaled by a VIX spike above 40 and a 14-day RSI below 30 (Source: CBOE Volatility Index Historical Data).
{
  "type": "line",
  "title": "VIX Capitulation Zones vs. S&P 500 Returns",
  "index": "VIX Level",
  "categories": ["Avg Forward 12M Return"],
  "data": [
    {"VIX Level": "15-20", "Avg Forward 12M Return": 7.2},
    {"VIX Level": "21-30", "Avg Forward 12M Return": 11.5},
    {"VIX Level": "31-40", "Avg Forward 12M Return": 18.9},
    {"VIX Level": "40+", "Avg Forward 12M Return": 26.4}
  ],
  "source": "Source: Bloomberg / CBOE Historical Analysis (1990-2024)",
  "note": "Higher VIX levels historically correlate with superior long-term entry points."
}
By formalizing your exit and entry, you remove emotional friction from a chaotic environment. Defense is not about avoiding the crash; it is about ensuring you have the capital and composure to profit from the recovery.
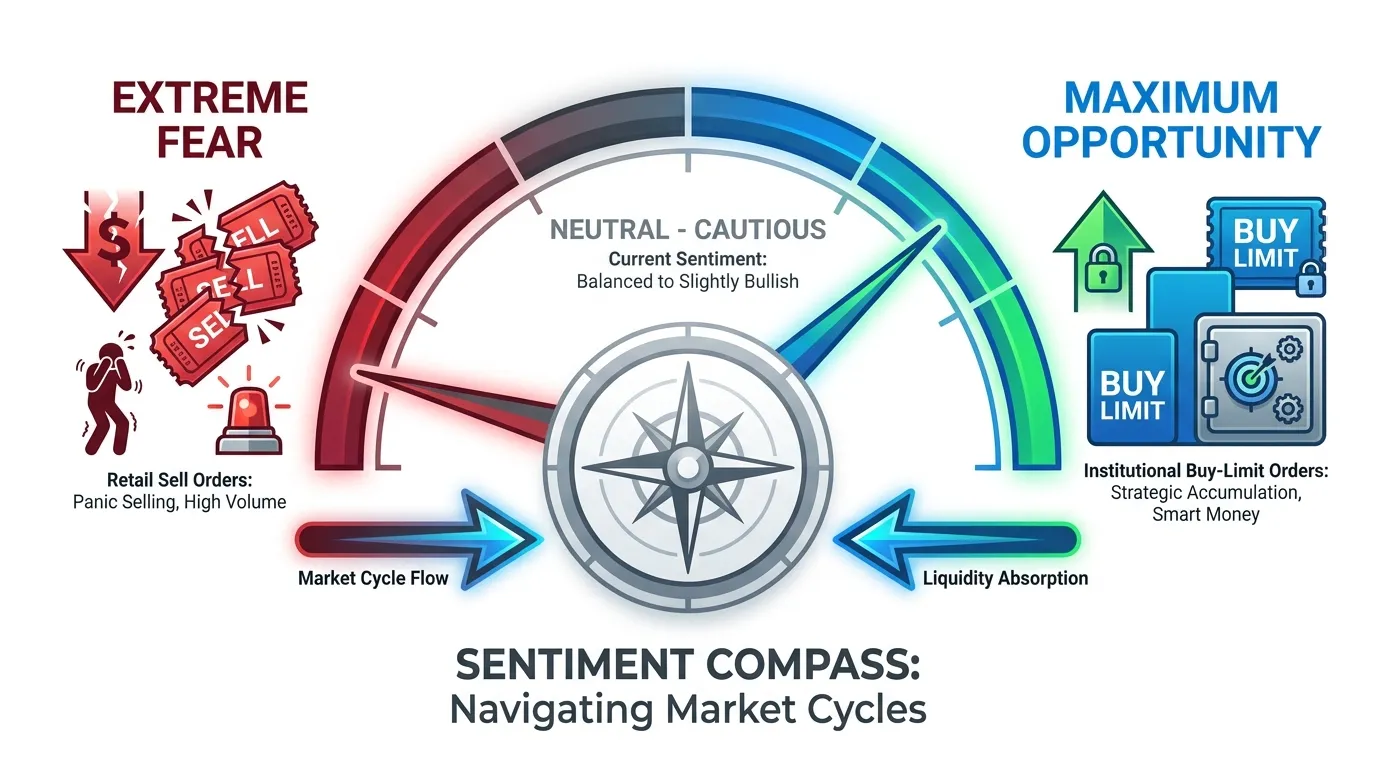
Psychological Resilience: Shiller’s Crash Confidence Index
While volatility measures (VIX) track price movement, Shiller’s Crash Confidence Index tracks the psychological "dry powder" of the market. This index measures the percentage of investors who believe there is a less than 10% probability of a 1987-style crash in the next six months.
Historically, market bottoms are not forged when prices are low, but when confidence evaporates. As we navigate 2026, the divergence between retail and institutional sentiment provides a critical contrarian signal.
The Institutional vs. Individual Divergence
Data from the Yale School of Management (2026) indicates a widening gap. Institutional investors—the "Smart Money"—often maintain a baseline of structural optimism, while individual investors are prone to recursive panic, where fear of a crash becomes the primary driver of the crash itself.
| Investor Type | Crash Confidence Index (Avg) | 2026 Peak Fear Level | Historical Support Level |
|---|---|---|---|
| Institutional | 72.4% | 61.5% | 60.0% |
| Individual | 64.8% | 48.2% | 45.0% |
(Source: Yale School of Management, Aug 2026)
When the Individual Crash Confidence Index drops below 50%, it indicates that more than half of the retail market expects a systemic collapse. Paradoxically, this has historically signaled an exhaustion of sellers.
{
  "type": "line",
  "title": "Yale Crash Confidence Index Trend (2024-2026)",
  "index": "Date",
  "categories": ["Individual Confidence", "Institutional Confidence"],
  "data": [
    {"Date": "Jan 2024", "Individual Confidence": 70.2, "Institutional Confidence": 75.1},
    {"Date": "July 2024", "Individual Confidence": 68.5, "Institutional Confidence": 73.8},
    {"Date": "Jan 2025", "Individual Confidence": 62.1, "Institutional Confidence": 70.4},
    {"Date": "July 2025", "Individual Confidence": 58.4, "Institutional Confidence": 68.2},
    {"Date": "Jan 2026", "Individual Confidence": 52.1, "Institutional Confidence": 65.5},
    {"Date": "July 2026", "Individual Confidence": 48.2, "Institutional Confidence": 61.5}
  ],
  "source": "Source: Yale School of Management (2026)",
  "note": "A reading below 50% for individuals typically precedes a 'washout' bottom."
}
 AI Generated Infographic
The "So What?": Surviving the 2026 Correction
To avoid panic-selling at the absolute bottom, investors must pivot from reactive emotion to quantitative sentiment tracking.
- Monitor the 45% Threshold: If individual confidence hits 45%, history suggests the market is "oversold" regardless of the macro headlines.
- Watch the Spread: A high institutional confidence paired with a low retail confidence is the classic "transfer of wealth" setup.
- The Valuation Anchor: As noted in recent Shiller CAPE data, valuations of 39.8x (July 2026) mean the market is fragile, but high fear levels act as a natural circuit breaker for further downside.
Resilience in 2026 is defined by the ability to distinguish between a fundamental collapse and a psychological capitulation. For those tracking high-conviction movements during these shifts, identifying where the "Smart Money" is concentrating capital remains the ultimate survival strategy.
For real-time insights into where major players are reallocating during periods of low confidence, consult the Smart Money Tracker for Institutional Portfolios.
FAQ
What defines a US stock market crash versus a correction?
A correction is a 10% to 20% decline, often viewed as a valuation reset. In contrast, a market crash is defined by extreme velocity and a breakdown of market microstructure, typically involving a sudden 20% or greater plunge.
How do SEC circuit breakers work during a crash?
The SEC uses Market-Wide Circuit Breakers based on the S&P 500: Level 1 (7% drop) and Level 2 (13% drop) both trigger 15-minute halts, while Level 3 (20% drop) suspends trading for the remainder of the day.
What is the 'Algo-Vacuum' effect in the 2026 market?
With algorithms accounting for 78% of equity volume, a crash triggers 'correlated exits' where most AI-driven models sell simultaneously. Market-making algorithms may shut down to limit risk, leaving no 'buyer of last resort.'
Which sectors perform best when the US stock market is crashing?
Utilities (XLU), Healthcare (XLV), and Consumer Staples (XLP) act as shock absorbers due to stable cash flows, inelastic demand, and their roles as 'bond proxies' during rate cuts.
How long does it take for the S&P 500 to recover from a bear market?
Historically, the average recovery time is 2.1 years. However, in structural crashes with high inflation, nominal prices may return to highs in 3-5 years, but real inflation-adjusted wealth can take over a decade to break even.