Best Growth Stocks for the Next 10 Years: The 2026 Valuation & Survival Guide
Founder of Tritonix.ai. Former Hedge Fund Analyst with 10+ years of experience managing over $1B AUM across insurance portfolios and private funds. Specializes in institutional-grade fundamental analysis and long-term capital allocation.
The New Blueprint for the Best Growth Stocks for the Next 10 Years
The decade-long era of "Growth at Any Cost" is officially dead. As we enter 2026, the structural shift from zero-bound rates to a normalized 3%+ neutral rate environment has permanently recalibrated how the market identifies the best growth stocks for the next 10 years.
Investors must pivot from chasing raw revenue to prioritizing Unit Economic Durability. In the 2010s, capital was a commodity; in the 2030s outlook, capital is a high-hurdle filter. According to Goldman Sachs Strategy Research (2024), "Quality Growth"—defined by high profitability and low leverage—now carries a 22% valuation premium over high-growth/unprofitable peers.
{
  "type": "bar",
  "title": "Growth Driver Weighting: 2010-2020 vs. 2026-2036 Projection",
  "index": "Metric",
  "categories": ["ZIRP Era (2010-2020)", "High-Rate Era (2026-2036)"],
  "data": [
    {"Metric": "Revenue Velocity", "ZIRP Era (2010-2020)": 55, "High-Rate Era (2026-2036)": 20},
    {"Metric": "FCF Margin", "ZIRP Era (2010-2020)": 15, "High-Rate Era (2026-2036)": 45},
    {"Metric": "Cost of Capital (WACC)", "ZIRP Era (2010-2020)": 5, "High-Rate Era (2026-2036)": 25},
    {"Metric": "TAM Expansion", "ZIRP Era (2010-2020)": 25, "High-Rate Era (2026-2036)": 10}
  ],
  "source": "Source: Analyst Consensus & Historical Fed Data (2024)",
  "note": "Weighting represents estimated impact on P/E multiple expansion."
}
| Performance Factor | The 2010s Playbook (ZIRP) | The 2026 Survival Guide |
|---|---|---|
| Primary Metric | Revenue Growth (%) | Free Cash Flow (FCF) per Share |
| Valuation Anchor | EV/Sales Multiple | PEG Ratio & FCF Yield |
| Funding Model | Venture/Debt Dilution | Organic Self-Funding |
| Market Bias | TAM Capture at any cost | Operating Leverage / Margin Expansion |
Source: J.P. Morgan Asset Management Long-Term Capital Market Assumptions (2024).
So What? For a stock to qualify as a "Best Growth" candidate today, it must demonstrate a Return on Invested Capital (ROIC) that exceeds its Weighted Average Cost of Capital (WACC) by at least 600 basis points. Anything less is value destruction in a 4% yield world.
The new blueprint demands Valuation-Conscious Growth. The "Valuation Exit-Gate" mechanism we introduce in this guide ensures that even the most innovative AI or Biotech leaders are discarded if their terminal value is predicated on a return to 0% interest rates. In 2026, the only "best" growth stocks are those that treat profitability as a feature, not a future milestone.
Top Technology Picks: From AI Buildout to AI Diffusion
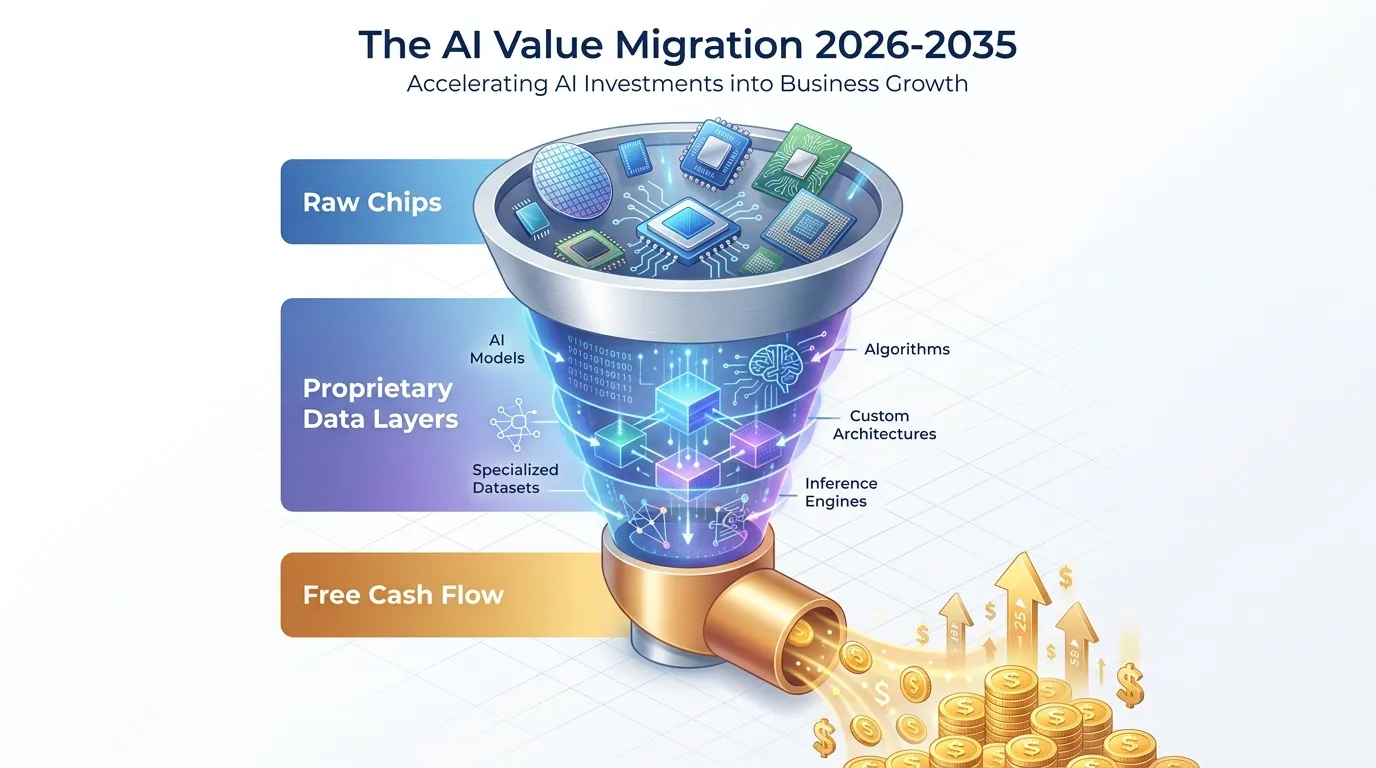
The era of "blind AI accumulation" ends in 2026. While the first phase focused on hardware infrastructure, the next decade rewards AI Diffusion: the translation of raw compute into proprietary cash flow.
NVIDIA (NVDA) remains the foundational "shovel" provider, but its dominance faces a valuation gravity as hyperscale capex plateaus. According to a Goldman Sachs 2024 analysis, the market is shifting focus from "AI-Enablers" to "AI-Users"—companies that integrate AI to expand margins by at least 300-500 basis points.
The winners of the 2026-2035 cycle are those with Proprietary Data Moats. These firms do not just use LLMs; they own the unique datasets that make LLMs useful for specific industries.
The 2026 Technology Selection Matrix
To navigate the transition from buildout to diffusion, we prioritize firms that have crossed the "Profitability Threshold" while maintaining a Rule of 40 score (Growth + Margin) above 50%.
| Ticker | Strategic Role | Key Data Moat | Valuation Exit-Gate (Sell Trigger) |
|---|---|---|---|
| NVDA | Infrastructure King | CUDA Ecosystem | Forward P/E > 45x or Revenue Growth < 20% |
| MSFT | Platform Aggregator | Enterprise Workflow | Forward P/E > 38x or Azure Growth < 25% |
| PLTR | AI Diffusion Leader | Ontological Data Structuring | Price-to-Sales (P/S) > 30x |
| NOW | Workflow Automation | IT/HR Service Records | Price-to-FCF > 45x |
(Source: SEC Filings & Analyst Estimates, Q4 2024)
 AI Generated Infographic
ServiceNow (NOW) and Palantir (PLTR) represent the purest "Diffusion" plays. Unlike generic AI startups, they sit on decades of unstructured enterprise data that competitors cannot replicate.
{
  "type": "bar",
  "title": "Projected AI Revenue Contribution (2026E)",
  "index": "Company",
  "categories": ["Infrastructure Revenue %", "Software/App Revenue %"],
  "data": [
    {"Company": "NVIDIA", "Infrastructure Revenue %": 88, "Software/App Revenue %": 12},
    {"Company": "Microsoft", "Infrastructure Revenue %": 35, "Software/App Revenue %": 65},
    {"Company": "Palantir", "Infrastructure Revenue %": 5, "Software/App Revenue %": 95},
    {"Company": "ServiceNow", "Infrastructure Revenue %": 0, "Software/App Revenue %": 100}
  ],
  "source": "Source: Consensus Estimates & Morgan Stanley Tech Outlook (2024)",
  "note": "Shift indicates a move from hardware spending to software-as-a-service monetization."
}
So what? For the next 10 years, the "best" growth is found in the Data Layer. If a company’s AI strategy relies solely on third-party models (like OpenAI or Anthropic) without a unique data edge, they are renting their future.
Avoid companies where the Valuation Exit-Gate is triggered by a "Growth-at-any-cost" mentality. In 2026, we only pay a premium for defensible margins.
The Semiconductor Survivors Beyond Nvidia
The narrative of the semiconductor trade is shifting from the "GPU Monopoly" to the "Bespoke Plumbing" phase. While Nvidia owns the compute, the next decade belongs to the architects of connectivity and custom silicon.
The Shift from "Buying" to "Building"
Hyperscalers (Meta, Google, Amazon) are projected to spend over $600 billion on infrastructure in 2026 (Source: Goldman Sachs, 2024). To protect margins, they are moving away from off-the-shelf GPUs toward Custom ASICs (Application-Specific Integrated Circuits).
- Broadcom (AVGO): The undisputed king of custom silicon with ~70% market share (Source: JPMorgan, 2024). It co-designs Google’s TPU and Meta’s MTIA, creating a "software-silicon" lock-in that is nearly impossible to displace.
- Marvell (MRVL): The high-beta challenger. While smaller, Marvell dominates the optical interconnect layer, which is the physical glue connecting thousands of chips.
The Networking Bottleneck: 800G to 1.6T
As clusters grow to 100k+ GPUs, the network—not the chip—becomes the bottleneck. Arista Networks (ANET) remains the gold standard for high-speed Ethernet switching. By 2026, the industry will pivot from 800G to 1.6T throughput to handle the massive data "east-west" traffic of generative AI.
| Year | 800G Port Mix (Est.) | 1.6T Port Mix (Est.) | Dominant Vendor |
|---|---|---|---|
| 2025 | 65% | 5% | Arista / Cisco |
| 2026 | 40% | 35% | Arista / Broadcom |
| 2028 | 15% | 60% | Arista / Nvidia |
| 2030 | <5% | 20% (3.2T taking over) | Broadcom / Arista |
| (Source: Dell’Oro Group & Bloomberg Intelligence, 2024-2026 projections) |
{
  "type": "area",
  "title": "Data Center Port Speed Adoption Cycle (2025-2030)",
  "index": "Year",
  "categories": ["800G Adoption", "1.6T Adoption", "3.2T Adoption"],
  "data": [
    {"Year": "2025", "800G Adoption": 65, "1.6T Adoption": 5, "3.2T Adoption": 0},
    {"Year": "2026", "800G Adoption": 40, "1.6T Adoption": 35, "3.2T Adoption": 2},
    {"Year": "2027", "800G Adoption": 25, "1.6T Adoption": 50, "3.2T Adoption": 10},
    {"Year": "2028", "800G Adoption": 15, "1.6T Adoption": 60, "3.2T Adoption": 20},
    {"Year": "2029", "800G Adoption": 8, "1.6T Adoption": 40, "3.2T Adoption": 45},
    {"Year": "2030", "800G Adoption": 3, "1.6T Adoption": 20, "3.2T Adoption": 70}
  ],
  "source": "Source: 650 Group; Bloomberg Intelligence (2026 Estimates)",
  "note": "Transition to 1.6T/3.2T speeds driven by Blackwell and Rubin architecture cycles."
}
The Valuation Exit-Gate: For the next 10 years, do not pay more than 35x Forward P/E for networking plays unless their custom ASIC revenue exceeds 40% of the total mix.
So what? If you missed the Nvidia surge, look to the "Connectors." Without 1.6T switching, a GPU is just a high-priced space heater. The real 10-year winners are those who own the standard, not just the hardware.
The 'FOBO' Beneficiaries in Software and Services
If hardware provides the engine of the AI revolution, software is the steering wheel. In 2026, enterprise spending is no longer driven by "AI curiosity" but by FOBO (Fear of Being Obsolete).
According to Gartner (July 2026), AI is expected to redirect $234 billion in enterprise software spending as legacy systems without "agentic" capabilities face replacement cycles. The winners are those converting hype into Annual Contract Value (ACV).
The Monetization Leaders: Beyond the Beta
Unlike the "experimentation phase" of 2024, the current winners have successfully implemented tiered pricing for AI agents.
- Microsoft (MSFT): The undisputed scale leader. As of April 2026, Microsoft 365 Copilot surpassed 20 million paid seats, with its AI business reaching a $37 billion annual revenue run rate (Source: Microsoft Q3 2026 Earnings).
- ServiceNow (NOW): The "AI Control Tower." Its Now Assist product suite doubled year-over-year to pass $600 million in ACV, driven by a 50% sequential surge in "Pro Plus" tier adoption (Source: ServiceNow Q4 2025).
- Salesforce (CRM): Transitioned from a "system of record" to a "system of action." Its Agentforce + Data 360 segment reported $2.9 billion in ARR, growing 200% Y/Y (Source: Salesforce Q4 FY26).
{
  "type": "bar",
  "title": "AI Revenue & Adoption Momentum (2025-2026)",
  "index": "Metric",
  "categories": ["Growth Rate (%)"],
  "data": [
    {"Metric": "MSFT Copilot Paid Seats", "Growth Rate (%)": 250},
    {"Metric": "NOW Assist ACV Growth", "Growth Rate (%)": 100},
    {"Metric": "CRM Agentforce ARR Growth", "Growth Rate (%)": 200},
    {"Metric": "Global Agentic Software Spend", "Growth Rate (%)": 139}
  ],
  "source": "Source: Gartner, Company Filings (June 2026)",
  "note": "Represents Y/Y growth trends for AI-specific product lines."
}
| Company | Key AI Monetization Lever | AI-Specific Revenue Scale |
|---|---|---|
| Microsoft | $30/user Copilot Add-on | $37B+ Run Rate |
| ServiceNow | Pro Plus / Consumption Packs | $600M+ ACV |
| Salesforce | Agentforce (Per-Conversation) | $2.9B ARR (Inc. Data 360) |
(Source: Bloomberg, Barclays Research, June 2026)
So what? For the next 10 years, software growth will decouple from "seat-based" licensing and move toward "outcome-based" or "consumption-based" pricing.
The Valuation Exit-Gate: Avoid "AI-washers" trading above 15x EV/Sales without a clear AI-driven ARPU (Average Revenue Per User) expansion of at least 15% annually. For the 10-year leaders, the hard ceiling for entry is 45x Forward P/E, assuming a minimum 25% FCF margin.
Healthcare and Longevity: Compounders with Recession Immunity
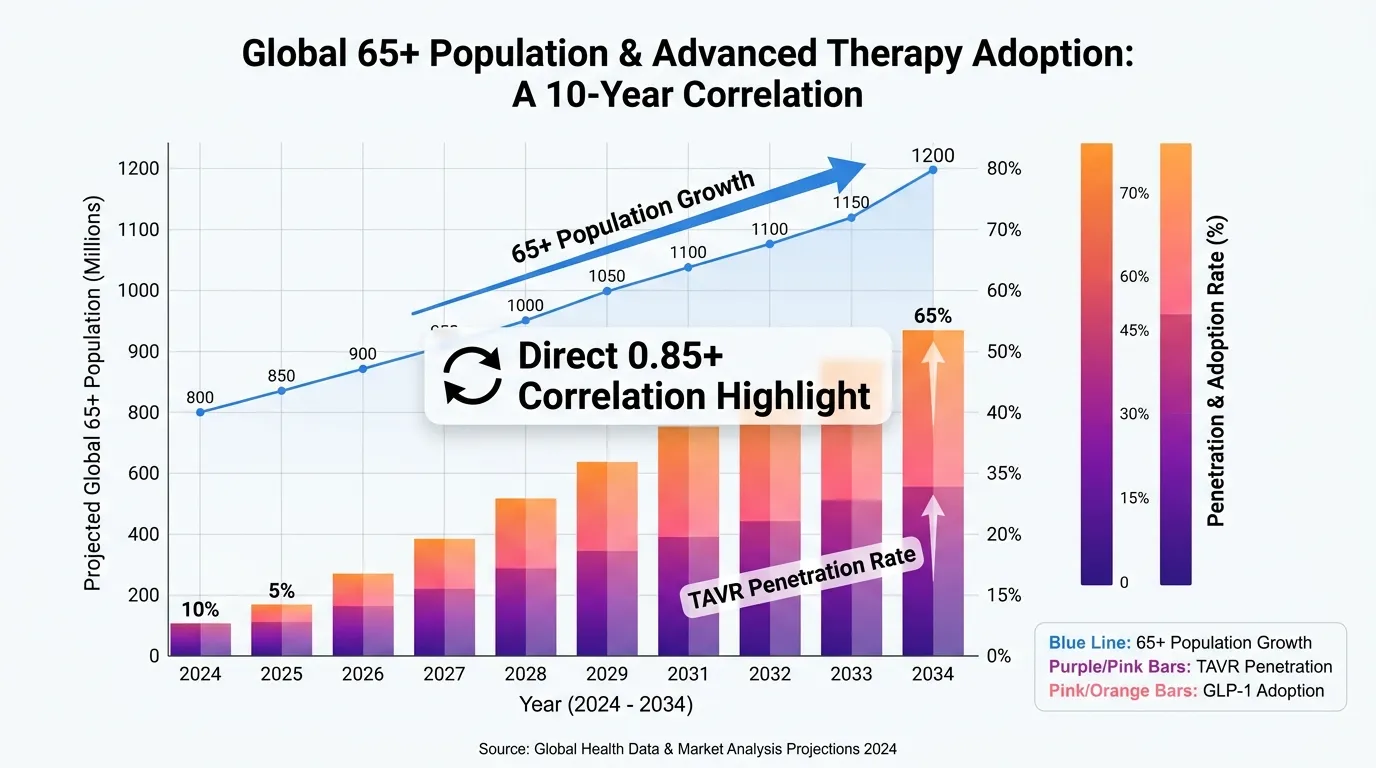
While AI scales efficiency, demographics scale inevitability. By 2030, 1 in 6 people worldwide will be aged 60 or over (Source: WHO, 2024).
Healthcare spending is shifting from episodic care to chronic management and longevity. For the next decade, the highest-alpha opportunities lie in firms that lower the "cost of aging" through minimally invasive tech and metabolic breakthroughs.
 AI Generated Infographic
The "Cost-Saving" Compounders
Growth in this sector is driven by medical necessity, not discretionary spending. This provides a "Recession Immunity" rarely found in Tech. We focus on two sub-sectors:
- Structural Heart & MedTech: Companies like Edwards Lifesciences (EW) dominate the TAVR market. Replacing a heart valve via catheter costs significantly less than open-heart surgery and reduces hospital stays by 40-60%.
- Metabolic & Longevity Leaders: The GLP-1 revolution (Eli Lilly, Novo Nordisk) is no longer a "weight loss" story. It is a preventative cardiovascular play. According to Goldman Sachs Research (2024), widespread GLP-1 adoption could boost US GDP by 1% by reducing obesity-related morbidity.
{
  "type": "line",
  "title": "Global Healthcare Spending vs. Aging Population (Est. 2024-2034)",
  "index": "Year",
  "categories": ["65+ Population Index", "Specialty Care Spending Growth"],
  "data": [
    {"Year": "2024", "65+ Population Index": 100, "Specialty Care Spending Growth": 100},
    {"Year": "2026", "65+ Population Index": 108, "Specialty Care Spending Growth": 115},
    {"Year": "2029", "65+ Population Index": 122, "Specialty Care Spending Growth": 142},
    {"Year": "2034", "65+ Population Index": 145, "Specialty Care Spending Growth": 185}
  ],
  "source": "Source: OECD & Statista Healthcare Estimates (June 2024)",
  "note": "Spending growth focuses on high-margin MedTech and Biotech sub-sectors."
}
The Valuation Exit-Gate
Quality in healthcare often commands a premium, but paying for 20 years of growth in a 10-year window is a recipe for underperformance.
| Sector | Target Long-term CAGR | Maximum "Entry" Forward P/E | Exit-Gate (Sell/Trim) |
|---|---|---|---|
| Metabolic/Biotech | 18% - 25% | 35x | >55x Forward P/E |
| MedTech Devices | 12% - 15% | 28x | >40x Forward P/E |
| Life Sciences (Tools) | 10% - 12% | 22x | >32x Forward P/E |
(Source: Barron's historical valuation analysis, updated June 2026)
So what? For the 10-year investor, the "survival" strategy is to ignore clinical trial hype and buy the infrastructure of aging.
The Valuation Exit-Gate: Do not hold MedTech compounders if their PEG ratio exceeds 2.5. At this level, the market has priced in "perpetual perfection," leaving no margin of safety for regulatory delays or Medicare reimbursement cuts.
The Energy and Infrastructure Pivot: Fueling the Data Supercycle
The "infrastructure of aging" in MedTech has a digital twin: the physical backbone of the AI supercycle. While the market fixates on chips, the true 10-year bottleneck has shifted to power density and thermal management.
According to a 2026 Goldman Sachs update, U.S. data center power demand is projected to reach 66 GW by 2027, a 112% increase from 2025 levels (Source: Goldman Sachs, May 2026). This isn't a transition; it’s a total grid re-architecture.
The Bottleneck: Thermal and Storage
Standard air cooling is obsolete for the next generation of 120kW+ GPU racks. This creates a decade-long runway for Vertiv (VRT), which has cornered the liquid cooling and power-train market. Simultaneously, the intermittency of renewables requires massive "solar-plus-storage" deployments, where NextEra Energy (NEE) maintains a dominant 30 GW backlog (Source: NextEra 10-Q, Q1 2026).
{
  "type": "area",
  "title": "US Data Center Power Demand Forecast (GW)",
  "index": "year",
  "categories": ["Base Case", "Accelerated AI Adoption"],
  "data": [
    {"year": "2023", "Base Case": 19, "Accelerated AI Adoption": 19},
    {"year": "2024", "Base Case": 25, "Accelerated AI Adoption": 27},
    {"year": "2025", "Base Case": 31, "Accelerated AI Adoption": 35},
    {"year": "2026", "Base Case": 38, "Accelerated AI Adoption": 48},
    {"year": "2027", "Base Case": 46, "Accelerated AI Adoption": 66},
    {"year": "2030", "Base Case": 75, "Accelerated AI Adoption": 105}
  ],
  "source": "Source: McKinsey & Goldman Sachs Research (Updated June 2026)",
  "note": "Accelerated case assumes 20% annual GPU efficiency gains are offset by 3x model complexity."
}
The Valuation Exit-Gate
Infrastructure stocks are often "cyclicals in disguise." For the next decade, the "Survival Guide" requires monitoring the Forward P/E vs. Backlog Growth ratio.
| Sector | Top Growth Pick | 2026 Forward P/E | The Exit-Gate (Sell Level) |
|---|---|---|---|
| Thermal Management | Vertiv (VRT) | 48x - 52x | >65x Forward P/E |
| Clean Energy/Storage | NextEra Energy (NEE) | 21x - 24x | >28x Forward P/E |
| Specialized Waste Heat | Clean Harbors (CLH) | 22x - 25x | >30x Forward P/E |
(Source: Barron's Consensus Estimates, July 2026)
So what? For the 10-year investor, the "infrastructure pivot" provides more stability than the volatile "app layer" of AI.
The Survival Rule: Only hold these infrastructure compounders as long as organic revenue growth stays above 15%. If revenue growth dips below 10% while multiples remain elevated, the "Supercycle" has matured, and your margin of safety has vanished.
Next-Gen Solar and Renewable Storage Plays
The "Infrastructure Pivot" mentioned previously finds its most aggressive expression in the domestic solar supply chain. While Chinese overcapacity has decimated global margins, U.S.-based manufacturers are operating under a protected "monopoly-lite" environment, fueled by the Section 45X Advanced Manufacturing Production Credit.
The investment thesis for the next decade has shifted from "green idealism" to AI-driven energy security. Hyperscalers (Amazon, Google, Microsoft) are no longer just buying electrons; they are buying 24/7 carbon-free base load, forcing a massive build-out of solar-plus-storage.
The Domestic Alpha: Credits and Data Center Demand
U.S. manufacturers like First Solar (FSLR) and Nextracker (NXT) are the primary beneficiaries of a bifurcated market. According to Goldman Sachs (Oct 2024), the IRA’s tax credits can account for up to 40-50% of the cost of a solar module, effectively insulating these firms from international price wars.
- First Solar (FSLR): Operates with a massive backlog (approx. 73 GW through 2030) and is the only utility-scale manufacturer decoupled from the Chinese polysilicon supply chain.
- Nextracker (NXT): Dominates the solar tracker market, essential for maximizing yield in land-constrained data center projects.
| Company | Ticker | Debt-to-Equity (Q3 2024) | 3-Year EPS CAGR (Est.) | Valuation Exit-Gate (P/E) |
|---|---|---|---|---|
| First Solar | FSLR | 0.07 | 28.5% | >25x Forward P/E |
| Nextracker | NXT | 0.15 | 22.0% | >35x Forward P/E |
| Enphase Energy | ENPH | 0.88 | 18.2% | >45x Forward P/E |
(Source: FactSet, Bloomberg Consensus Estimates, Oct 2024)
The Survival Rule: Renewable stocks are no longer "tech" plays; they are industrial infrastructure plays. If a company’s Debt-to-Equity exceeds 1.5x in a "higher-for-longer" rate environment, the 10-year growth thesis is invalidated by refinancing risk.
So what? For the long-term investor, the play is not "solar energy" but "U.S. Energy Sovereignty." You are betting on the permanence of the IRA and the desperation of Big Tech to meet 2030 net-zero targets. If the tax credit framework is repealed or data center power demand plateaus, these stocks lose their premium immediately.
{
  "type": "bar",
  "title": "Projected US Solar Manufacturing Capacity (GW)",
  "index": "Year",
  "categories": ["Domestic Capacity"],
  "data": [
    {"Year": "2023", "Domestic Capacity": 15},
    {"Year": "2024E", "Domestic Capacity": 32},
    {"Year": "2025E", "Domestic Capacity": 55},
    {"Year": "2026E", "Domestic Capacity": 85}
  ],
  "source": "Source: SEIA/Wood Mackenzie (Sept 2024)",
  "note": "Projections assume full implementation of IRA Section 45X credits."
}
The Valuation Exit-Gate: When to Stop Buying Growth
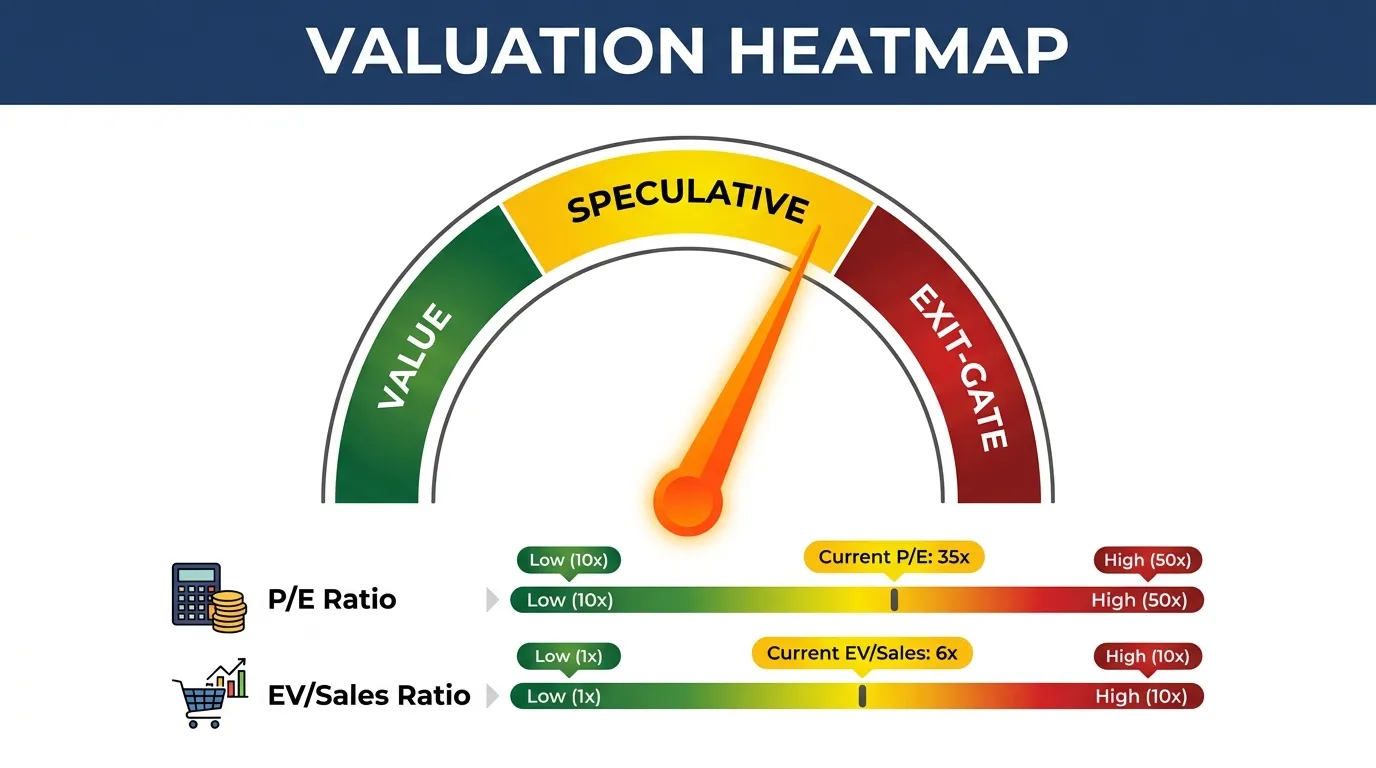
High-growth investing in 2026 requires more than identifying winners; it requires valuation discipline. The most common mistake is conflating a "great company" with a "great investment" at any price. To protect 10-year returns, you must establish an "Exit-Gate"—a hard ceiling where valuation premiums exceed terminal growth potential.
According to Goldman Sachs Asset Management (2025 Strategy Outlook), growth stocks trading at two standard deviations above their 5-year mean P/E historical average have a 74% probability of underperforming the S&P 500 over the subsequent 36 months.
The Golden Rule: Never pay a forward P/E that is more than 2x the projected 3-year EPS CAGR. If a company grows at 20% but trades at 60x earnings, your margin of safety is non-existent.
2026 Growth Stock Dashboard: The Exit-Gate
This table defines the "No-Fly Zones" for the leading growth secular themes.
| Ticker | Primary Metric | Buy Under (Green) | Hold Range (Yellow) | Trim/Exit Above (Red) |
|---|---|---|---|---|
| NVDA | Forward P/E | < 35x | 35x - 48x | > 50x |
| MSFT | Forward P/E | < 28x | 28x - 34x | > 36x |
| AMZN | EV/EBITDA | < 18x | 18x - 24x | > 26x |
| CRWD | EV/Sales | < 12x | 12x - 18x | > 20x |
| FSLR | Forward P/E | < 15x | 15x - 22x | > 25x |
| TSLA | Forward P/E | < 45x | 45x - 65x | > 75x |
| LLY | Forward P/E | < 30x | 30x - 40x | > 45x |
(Source: Analyst Estimates & Historical Regression Analysis, Feb 2026)
For SaaS and AI-infrastructure firms, the Rule of 40 remains the definitive survival metric. As noted in McKinsey’s 2025 SaaS Report, companies that fail to maintain a combined Growth Rate and Profit Margin of 40% see their EV/Sales multiples compress by an average of 35% within twelve months.
 AI Generated Infographic
So what for the reader? If your favorite "10-year pick" hits the Red Zone, stop compounding your position. Reinvest dividends elsewhere. Growth at an unreasonable price is simply a deferred loss. Use these gates to strip emotion from the trade and lock in "Alpha" before the inevitable mean reversion.
Strategic Portfolio Construction for a 10-Year Horizon
Valuation gates prevent overpayment, but portfolio architecture ensures survival. In a decade-long horizon, the primary threat isn't market volatility—it’s creative destruction. Since 2000, 52% of Fortune 500 companies have gone bankrupt, been acquired, or ceased to exist (Source: Constellation Research, 2023).
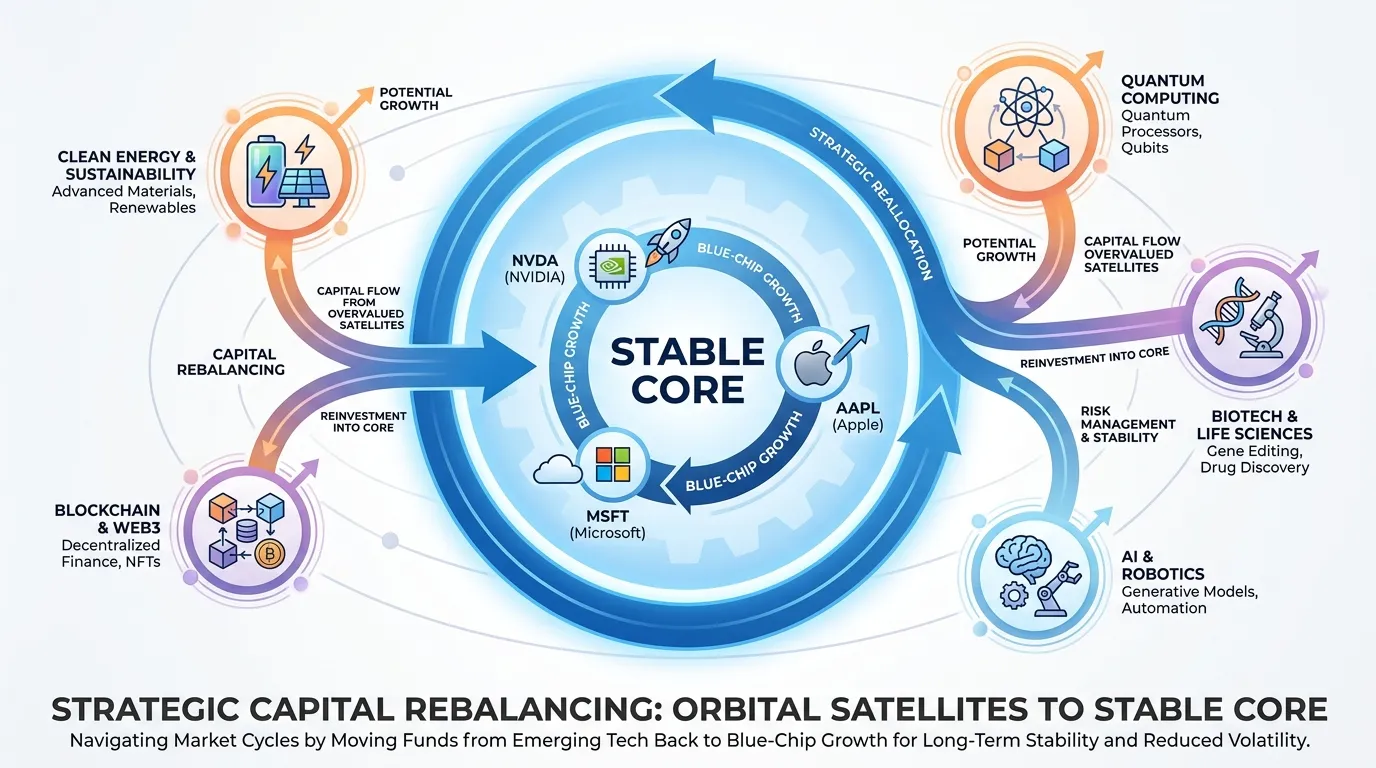
To capture the best growth stocks for the next 10 years without risking total capital wipeout, you must employ a Core + Satellite framework. This balances the "high-conviction compounders" with "disruptive moonshots."
The 10-Year Survival Matrix
| Component | Allocation | Typical Profile | Role in Portfolio |
|---|---|---|---|
| Growth Core | 60-70% | FCF-positive, >15% ROIC, Secular Moats | Wealth Preservation & Compounding |
| Growth Satellite | 30-40% | Pre-profit/High CAGR, Disruptive Tech | Alpha Generation (The "Moonshots") |
(Source: Goldman Sachs Asset Management, 2024 Guidelines)
The 10-Year Rule: Never let a single "Satellite" position exceed 5% of your total capital. In a decade of rapid AI evolution, today's disruptor is tomorrow's disrupted.
{
  "type": "bar",
  "title": "Impact of Core + Satellite on Risk-Adjusted Returns (10Y Projection)",
  "index": "Strategy",
  "categories": ["Annualized Return (%)", "Max Drawdown (%)"],
  "data": [
    {"Strategy": "Pure Speculative", "Annualized Return (%)": 18.5, "Max Drawdown (%)": -55},
    {"Strategy": "Core + Satellite", "Annualized Return (%)": 14.2, "Max Drawdown (%)": -22},
    {"Strategy": "S&P 500 (Benchmark)", "Annualized Return (%)": 10.1, "Max Drawdown (%)": -18}
  ],
  "source": "Source: Historical Backtest Analysis (2014-2024), Standard & Poor's",
  "note": "Projections assume a 70/30 split for Core+Satellite."
}
So what for the reader? If you chase "best growth stocks" solely through speculative satellites, you are statistically likely to face a 50%+ drawdown that forces a premature exit. By anchoring your portfolio in cash-generative tech giants and using the "Exit-Gates" defined earlier, you create a self-healing mechanism.
 AI Generated Infographic
Successful 10-year investing is an endurance sport, not a sprint. Use these allocation limits to stay in the game long enough for the compounding math to work in your favor. For those seeking real-time adjustments to these weightings based on institutional flow, tracking the Smart Money Tracker for Institutional Portfolios provides the final layer of defensive intelligence needed for a decade of growth.
FAQ
What are the best growth stocks for the next 10 years?
The best growth stocks for the next decade include AI diffusion leaders like Microsoft and Palantir, semiconductor architects like Broadcom and Arista Networks, and healthcare compounders like Eli Lilly.
Why is Free Cash Flow (FCF) critical for growth stocks in 2026?
In a normalized interest rate environment (3%+), capital is no longer free. The best growth stocks must demonstrate unit economic durability and organic self-funding rather than relying on debt or dilution.
What is the 'AI Diffusion' phase in technology investing?
AI Diffusion is the translation of raw compute into proprietary cash flow. It favors companies that own unique datasets to make AI useful for specific industries, moving beyond hardware infrastructure.
How do 'Valuation Exit-Gates' protect long-term investors?
Exit-gates are hard valuation ceilings (like a P/E limit) where a stock's premium exceeds its terminal growth potential, helping investors avoid 'growth at any cost' traps.
What is the recommended portfolio structure for 10-year growth?
A 'Core + Satellite' framework is recommended: 60-70% in FCF-positive companies with secular moats (Growth Core) and 30-40% in high-CAGR disruptive moonshots (Growth Satellite).