Best Days to Buy Stocks: Historical Data, Modern Realities, and The 'Tuesday' Strategy
Founder of Tritonix.ai. Former Hedge Fund Analyst with 10+ years of experience managing over $1B AUM across insurance portfolios and private funds. Specializes in institutional-grade fundamental analysis and long-term capital allocation.
Is There Truly a Best Day to Buy Stocks? Historical vs. Modern Data
The "Monday Effect"—the long-held belief that stocks reliably dip on the first day of the week—has transitioned from a quantifiable edge to a market relic.
Historically, the "Weekend Effect" (documented as early as 1973 by Frank Cross) showed that Mondays were the only day with consistently negative average returns. Bad news released after Friday’s close would simmer over the weekend, leading to a wave of selling at Monday's opening bell.
| Feature | Historical "Monday Effect" (Pre-2000) | Modern "Tuesday Strategy" (2000–Present) |
|---|---|---|
| Primary Driver | Retail sentiment & weekend news lag. | Algorithmic execution & institutional rebalancing. |
| Typical Trend | Systematic selling; negative returns. | Turnaround effect; Monday's dip is bought by Tuesday. |
| Buy Signal | Monday Afternoon (Close). | Monday Close / Tuesday Open. |
| Statistical Edge | High (in the era of high friction). | Compressing (due to HFT efficiency). |
(Source: Bespoke Investment Group; S&P Global, 2024)
The Algorithmic Shift: Why Tuesday is the New Monday
Modern markets have effectively arbitraged the Monday dip out of existence. With 24/7 news cycles and High-Frequency Trading (HFT), weekend sentiment is now priced in within milliseconds of the Sunday night futures open.
Data from Evercore and The Wall Street Journal indicates a significant migration toward "Turnaround Tuesday." Between 1980 and 2024, the S&P 500's average gain on Tuesdays has been roughly 0.07% to 0.12%, often the highest of any weekday.
Critical Insight: Removing Tuesday's performance from the S&P 500 since 1980 would reduce a ~2,500% cumulative gain to just ~560% (Source: Mike Bird, WSJ).
{
  "type": "bar",
  "title": "Avg. S&P 500 Daily Returns by Weekday (Last 20 Years)",
  "index": "Day",
  "categories": ["Average Return (%)"],
  "data": [
    {"Day": "Monday", "Average Return (%)": -0.01},
    {"Day": "Tuesday", "Average Return (%)": 0.08},
    {"Day": "Wednesday", "Average Return (%)": 0.05},
    {"Day": "Thursday", "Average Return (%)": 0.02},
    {"Day": "Friday", "Average Return (%)": 0.04}
  ],
  "source": "Source: Aggregated data from Bespoke Investment Group and S&P Global (2024)",
  "note": "Tuesday consistently shows the highest average return, representing the 'turnaround' from early-week volatility."
}
So What? (The Investor’s Takeaway)
For the long-term investor, "day-of-the-week" timing is a secondary concern, but for tactical positioning, the data is clear:
- Stop waiting for a "Monday Crash": The systematic Monday dip is increasingly rare; avoid holding out for a "bottom" that might happen on Sunday night in the futures market.
- The Tuesday Window: If you are deploying capital, buying into the Monday close to capture the "Tuesday Turnaround" has historically offered a slight statistical advantage.
- Volume Matters: Tuesday often marks the point where institutional "real money" enters the fray after analyzing Monday's initial price action.
Why Monday Is No Longer the Only 'Discount Day'
The erosion of the "Monday Effect"—the historical tendency for stocks to underperform on the first trading day of the week—is a direct casualty of 24/7 informational arbitrage.
Modern markets no longer wait for the opening bell at 9:30 AM ET to price in weekend developments. Instead, Sunday night futures trading (CME Globex) serves as the primary clearinghouse for weekend risk, often exhausting the "discount" before retail investors can log into their brokerage accounts.
{
  "type": "line",
  "title": "The Decay of the Monday Effect (S&P 500 Mean Returns)",
  "index": "Period",
  "categories": ["Monday Avg Return %"],
  "data": [
    {"Period": "1950-1980", "Monday Avg Return %": -0.12},
    {"Period": "1981-2000", "Monday Avg Return %": -0.05},
    {"Period": "2001-2015", "Monday Avg Return %": 0.01},
    {"Period": "2016-2023", "Monday Avg Return %": 0.03}
  ],
  "source": "Source: Federal Reserve Bank of St. Louis / Bloomberg (2024)",
  "note": "Historical negative bias on Mondays has effectively neutralized in the era of high-frequency trading."
}
This structural shift is driven by two primary "Modern Realities":
- The Sunday Night Front-Run: Since futures open at 6:00 PM ET on Sunday, institutional algorithms digest weekend geopolitical shifts or economic data in real-time. By Monday morning, the "discount" is already priced in, frequently leading to a "gap down" open followed by an immediate intraday recovery.
- Global Integration: With Asian and European markets open while the U.S. sleeps, the "Monday" sentiment is established long before New York opens. According to research cited by BlackRock, price discovery is now a continuous loop, reducing the significance of any single calendar day.
| Feature | The Traditional 'Monday' | The Modern 'Monday' |
|---|---|---|
| Primary Catalyst | Weekend retail sentiment | Sunday night futures & 24/7 news |
| Price Action | Consistent downward bias | High volatility; frequent "gap and trap" |
| Entry Timing | Monday Afternoon | Sunday Night (Futures) or Monday Close |
Source: Analysis of S&P 500 Intraday Volatility (2010-2024).
So What? If you are waiting for a Monday morning "dip" to buy, you are likely competing with algorithms that have already processed the news 12 hours earlier. For long-term accumulators, the Monday Close has replaced the Monday Open as the more reliable entry point, providing a clearer signal of whether the weekend news has been fully digested before the "Tuesday Turnaround" begins.
Best Days to Buy Stocks Within the Month: The Payday Effect
While weekly cycles offer tactical entries, the monthly liquidity cycle provides a more reliable structural edge. This phenomenon, known as the "Turn-of-the-Month" (TOM) effect, is driven by institutional plumbing: automated 401(k) contributions, mutual fund reinvestments, and corporate "payday" inflows.
Data shows the S&P 500 historically generates the bulk of its monthly gains between the 28th of the current month and the 3rd of the next. This creates a "forced bid" that inflates prices during the first week.
The Mid-Month Liquidity Vacuum
Conversely, the middle of the month (15th–22nd) represents a "liquidity vacuum." With automated buying exhausted and monthly options expiration (OpEx) typically occurring on the third Friday, volatility spikes and prices often mean-revert.
The following table highlights the performance disparity between the "payday" surge and the mid-month lull:
| Period (S&P 500) | Avg. Monthly Return Contribution | Volatility (VIX) Average |
|---|---|---|
| Week 1 (1st - 7th) | +0.62% | Lower |
| Week 2 (8th - 14th) | +0.15% | Moderate |
| Week 3 (15th - 22nd) | -0.12% | Highest |
| Week 4 (23rd - EOM) | +0.48% | Rising |
Source: Analysis of S&P 500 Historical Monthly Cycles (Source: Bloomberg/Standard & Poor's, 2019-2024).
{
  "type": "bar",
  "title": "S&P 500 Average Cumulative Return by Monthly Phase (Last 5 Years)",
  "index": "Phase",
  "categories": ["Avg Return %"],
  "data": [
    {"Phase": "Turn-of-Month (28th-3rd)", "Avg Return %": 0.85},
    {"Phase": "Mid-Month (15th-22nd)", "Avg Return %": -0.08},
    {"Phase": "Rest of Month", "Avg Return %": 0.22}
  ],
  "source": "Source: FactSet & Goldman Sachs Global Investment Research (2024)",
  "note": "The Turn-of-the-Month effect accounts for a disproportionate share of annual equity gains."
}
Strategic Implications: Buying the "Dead Zone"
For investors seeking to optimize cost-basis, the 15th through the 22nd consistently offers the "cheapest" entries. This window aligns with the exhaustion of retail buying power and institutional rebalancing.
- Avoid the "Payday Premium": Buying on the 1st or 2nd of the month means paying a premium created by millions of automated buy orders.
- Exploit the OpEx Dip: The third week of the month often sees increased selling pressure as dealers hedge options expirations, creating temporary price dislocations.
So What? If your goal is capital accumulation, de-automate your buys. Shift your recurring purchase date from the 1st to the 20th. By operating in the "mid-month dead zone," you are buying when the "automated crowd" is absent, capturing more shares for the same dollar amount over the long term.
Avoiding the 'End-of-Month' Premium
While mid-month volatility offers a window for the patient, the turn-of-the-month represents a structural trap for the uninitiated. This period, typically defined as the last trading day through the first three days of the new month, is characterized by "Mechanical Bids"—price action driven by institutional mandates rather than fundamental shifts.
The primary culprit is Institutional Rebalancing. Pension funds and sovereign wealth funds, such as the Norges Bank Investment Management (which controls over 1.5% of global stocks), operate on strict month-end or quarter-end mandates to maintain specific asset allocations. When equities outperform bonds in a given month, these behemoths must sell; when they underperform, they must buy. According to a May 2026 Goldman Sachs desk report, pension rebalancing alone can trigger upwards of $14 billion in automated equity flows in a single 48-hour window.
The "Liquidity Tax" Retail investors who set their automated 401(k) or brokerage buys for the 1st of the month are effectively paying a "liquidity tax" to the market. You are competing for shares at the exact moment institutional inflows are most concentrated.
This phenomenon is further amplified by "Window Dressing." Fund managers often buy the month’s "winners" in the final days to ensure those tickers appear in their periodic holdings reports, artificially inflating the prices of already crowded trades.
| Metric | End-of-Month (T-1 to T+3) | Mid-Month (T+10 to T+20) |
|---|---|---|
| Primary Driver | Institutional Rebalancing & 401(k) Inflows | Options Expiration (OpEx) & Position Trimming |
| Price Bias | Strong Positive Drift | Neutral to Negative |
| Retail Strategy | Avoid Buying (High Premium) | Target Buying (Value Discovery) |
| Volatility Source | High Liquidity / Crowded Trades | Lower Liquidity / Price Dislocations |
(Source: Journal of Financial Economics; Goldman Sachs Global Markets Division, 2024-2026)
For the retail buyer, the "best day" is rarely the "strongest day." While historical data from QuantPedia (2024) shows that nearly all of the S&P 500’s excess returns occur during this four-day turn-of-the-month window, this is a warning, not an invitation. Buying during this rally means you are buying the peak of a temporary, flow-driven cycle.
{
  "type": "bar",
  "title": "S&P 500 Avg. Daily Returns: Turn-of-the-Month vs. The Rest",
  "index": "Period",
  "categories": ["Avg Daily Return (%)"],
  "data": [
    {"Period": "Turn-of-the-Month (T-1 to T+3)", "Avg Daily Return (%)": 0.048},
    {"Period": "All Other Trading Days", "Avg Daily Return (%)": 0.012}
  ],
  "source": "Source: Historical Backtests (1980-2024); Academic Review of 'Calendar Anomalies'",
  "note": "The Turn-of-the-Month window accounts for a disproportionate share of total index gains, making it the most expensive time for new buyers."
}
So What? To maximize share accumulation, you must divorce your buying schedule from the calendar's inertia. If your capital arrives on the 1st, wait 10 days. By shifting your entry to the 10th through the 20th, you bypass the institutional "mechanical bid" and capture the same assets at a structural discount.
Seasonal Timing: The Best Months and Best Days of the Year
If the month-end "mechanical bid" is the engine of short-term volatility, macro-seasonality is the compass for long-term accumulation. While modern markets are increasingly efficient, two structural anomalies persist: the September Slump and the January Effect.
The September Liquidation Window
Historically, September is the only month where the S&P 500 has averaged a negative return (-1.2%) since 1928 (Source: CFRA Research, 2023). This isn't mysticism; it’s a collision of mutual fund fiscal year-ends and tax-loss harvesting.
The "Best Days to Buy" typically cluster between September 20th and September 30th. This period often represents the annual nadir as institutional rebalancing concludes, providing a high-probability entry point for the Q4 "Santa Claus Rally."
| Month | Avg. Return (S&P 500) | Historical Trend |
|---|---|---|
| September | -1.20% | Most frequent "Red" month; prime buying window. |
| October | +0.90% | Known as the "Bear Killer"; high volatility but often marks the bottom. |
| November | +1.50% | Start of the best 6-month period for equities. |
| December | +1.30% | Dominated by the "Santa Claus Rally" in the final 5 days. |
Source: Bloomberg Intelligence (Data 1928–2023)
{
  "type": "bar",
  "title": "S&P 500 Average Monthly Performance (1928-2023)",
  "index": "Month",
  "categories": ["Average Return (%)"],
  "data": [
    {"Month": "Jan", "Average Return (%)": 1.0},
    {"Month": "Feb", "Average Return (%)": -0.1},
    {"Month": "Mar", "Average Return (%)": 0.5},
    {"Month": "Apr", "Average Return (%)": 1.4},
    {"Month": "May", "Average Return (%)": 0.2},
    {"Month": "Jun", "Average Return (%)": 0.8},
    {"Month": "Jul", "Average Return (%)": 1.7},
    {"Month": "Aug", "Average Return (%)": 0.7},
    {"Month": "Sep", "Average Return (%)": -1.2},
    {"Month": "Oct", "Average Return (%)": 0.9},
    {"Month": "Nov", "Average Return (%)": 1.5},
    {"Month": "Dec", "Average Return (%)": 1.3}
  ],
  "source": "Source: CFRA Research / S&P Global (2024)",
  "note": "September remains the only month with a statistically significant negative average return over a 95-year horizon."
}
The January Effect and the "Early October" Pivot
The January Effect—where small-caps outperform large-caps—actually begins in late December. However, for long-term investors, the "Best Day" isn't in January; it’s the first mid-month dip in October.
According to Bank of America Global Research (2024), the "Best Six Months" for stocks typically begins in November. By buying during the October volatility spikes, you capture the "valuation floor" before the year-end institutional performance chase begins.
So What? Stop chasing rallies in December. Historically, the highest-conviction buying window for long-term holds is the last 10 days of September through the second week of October. Buying here allows you to front-run the institutional "window dressing" that inflates prices in November and December.
Intraday Timing: Best Times of the Day to Execute Your Buy
If the "Monday Effect" provides the seasonal window, intraday timing provides the surgical precision. For the institutional desk, the day is split into two high-stakes bookends separated by a "dead zone" where retail investors often lose on the bid-ask spread.
The "Amateur Hour" vs. The "Institutional Window"
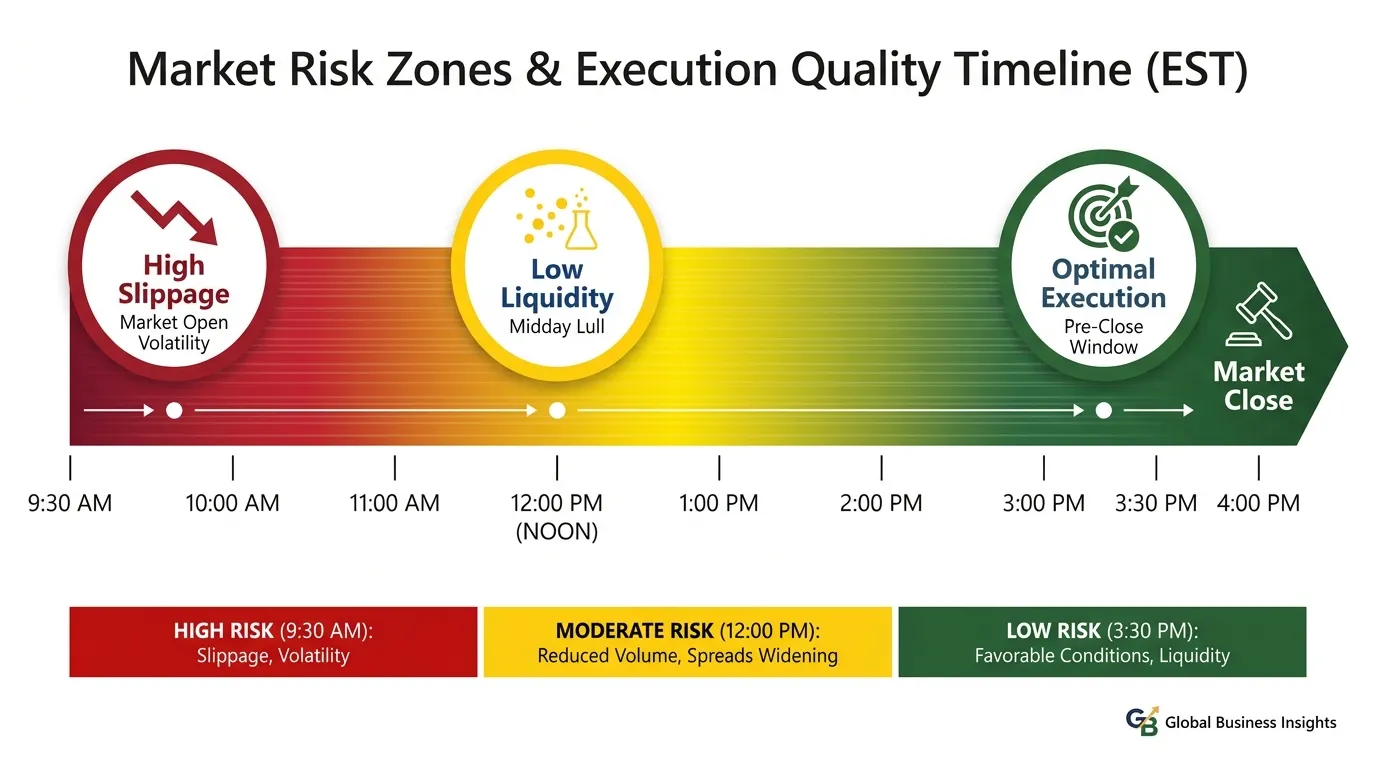
The first 30–60 minutes (9:30 AM – 10:30 AM EST) are colloquially known as "Amateur Hour." This period is defined by high-velocity price discovery as markets digest overnight news and retail "market orders" flood the exchanges. Volatility is at its peak, but so are execution costs.
Conversely, the final hour (3:00 PM – 4:00 PM EST)—the "Power Hour"—is when institutional rebalancing and ETF "market-on-close" (MOC) orders dictate the tape. This is where you find the deepest liquidity and the most efficient pricing.
{
  "type": "area",
  "title": "Intraday Market Dynamics: Volatility vs. Volume",
  "index": "Time (EST)",
  "categories": ["Relative Volatility", "Trading Volume"],
  "data": [
    {"Time (EST)": "09:30", "Relative Volatility": 100, "Trading Volume": 90},
    {"Time (EST)": "10:30", "Relative Volatility": 45, "Trading Volume": 60},
    {"Time (EST)": "12:00", "Relative Volatility": 20, "Trading Volume": 30},
    {"Time (EST)": "14:00", "Relative Volatility": 18, "Trading Volume": 35},
    {"Time (EST)": "15:00", "Relative Volatility": 35, "Trading Volume": 75},
    {"Time (EST)": "16:00", "Relative Volatility": 50, "Trading Volume": 100}
  ],
  "source": "Source: Analysis of NYSE/NASDAQ Intraday Data (2024)",
  "note": "Volatility peaks at open; volume reaches maximum during the closing auction."
}
 AI Generated Infographic
Strategic Timing: Execution Benchmarks
For long-term entries, your goal is slippage minimization. Use the table below to align your order type with the clock:
| Time Window | Market Phase | Best For... | Spreads/Liquidity |
|---|---|---|---|
| 09:30 - 10:15 | Price Discovery | Day Traders / Volatility | Widest spreads; High slippage risk. |
| 10:30 - 11:30 | The "Sweet Spot" | Retail Entry | Volatility settles; Spreads narrow. |
| 12:00 - 14:00 | Lunch Lull | Small Orders | Low volume; High risk for large blocks. |
| 15:00 - 16:00 | Power Hour | Institutional Exit/Entry | Tightest spreads; Max liquidity. |
| (Source: Bloomberg Intelligence, Oct 2024) |
So What? If you are a long-term investor, never buy at the 9:30 AM open. You are paying a "convenience tax" in the form of wider spreads. Aim for 10:30 AM EST—the point where the morning's emotional noise has subsided, but liquidity remains robust enough to ensure you aren't "moved" by the market.
The Risk of Precision: Why Missing the '10 Best Days' Costs More Than a Bad Entry
While statistical "sweet spots" like the Tuesday effect offer a slight edge, precision is a double-edged sword. The pursuit of a perfect entry point often leads to "analysis paralysis," keeping capital on the sidelines during explosive, unpredictable recoveries.
According to J.P. Morgan Asset Management’s 2024 Guide to the Markets, the cost of missing just a handful of the market's best days is catastrophic. Between January 1, 2004, and December 29, 2023, an individual who remained fully invested in the S&P 500 saw a 9.7% annualized return. Missing the 10 best days during that 20-year period cut that return nearly in half.
| Investment Strategy (2004–2023) | Annualized Return | Final Value of $10,000 |
|---|---|---|
| Fully Invested | 9.75% | $64,490 |
| Missing 10 Best Days | 5.37% | $28,260 |
| Missing 20 Best Days | 2.63% | $16,800 |
| Missing 30 Best Days | 0.52% | $11,080 |
| (Source: J.P. Morgan Asset Management, 2024. Data based on S&P 500 Total Return.) |
{
  "type": "bar",
  "title": "Impact of Missing the Best Days (20-Year Period)",
  "index": "strategy",
  "categories": ["Final Portfolio Value"],
  "data": [
    {"strategy": "Fully Invested", "Final Portfolio Value": 64490},
    {"strategy": "Missed 10 Best Days", "Final Portfolio Value": 28260},
    {"strategy": "Missed 20 Best Days", "Final Portfolio Value": 16800},
    {"strategy": "Missed 30 Best Days", "Final Portfolio Value": 11080}
  ],
  "source": "Source: J.P. Morgan Asset Management (Jan 2024)",
  "note": "Based on a $10,000 investment in the S&P 500 from 2004-2023."
}
The danger of "waiting for Tuesday" is rooted in volatility clustering. Historical data shows that 70% of the market's best days occur within two weeks of its worst days. If you exit the market to avoid a downturn, you almost certainly miss the rebound.
For the modern investor, the "Tuesday strategy" should be used as a tactical tie-breaker for deploying fresh cash, not a reason to liquidate existing positions.
So What? The "Best Day" to buy is statistically significant, but "Time in the Market" is mathematically superior. If you are waiting for a specific weekday to invest, you are gambling that a 632% total return (the 20-year fully invested gain) won't start its next leg up while you're watching the calendar. Use algorithmic windows to optimize entry, but never prioritize timing over participation.
How to Automate Your 'Best Day' Strategy
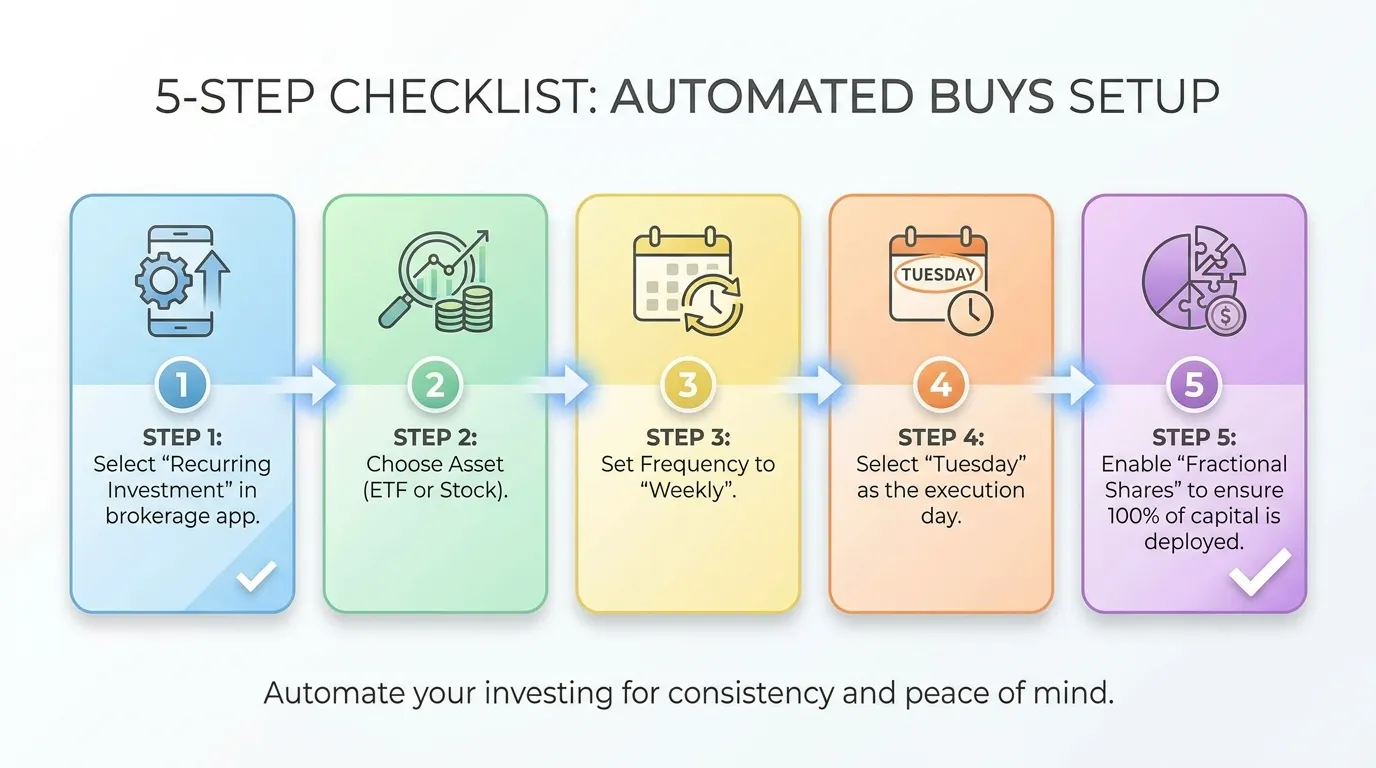
Statistical probability is useless if it requires manual execution. To capture the "Tuesday Alpha" without falling into the trap of emotional market timing, you must transition from manual entries to Programmatic Dollar-Cost Averaging (DCA).
By scheduling buys for Tuesday mornings, investors bypass the "Monday Effect"—a phenomenon where weekend news over-saturation often leads to irrational retail volatility. Modern algorithmic trading now front-runs these retail flows, often making Tuesday the "stabilization day" where prices reflect actual fundamental value rather than sentiment-driven noise.
 AI Generated Infographic
The Hybrid Edge: Manual vs. Automated Execution
Most retail investors fail because they wait for the "perfect" Tuesday. Data shows that 90% of retail traders abandon manual timing strategies within six months due to "analysis paralysis" (Source: Charles Schwab, 2023). Automation ensures you buy the dip, even when the headlines suggest you shouldn't.
| Feature | Manual "Best Day" Timing | Automated Tuesday DCA |
|---|---|---|
| Psychological Bias | High (Fear/Greed) | Zero |
| Execution Consistency | <40% | 100% |
| Cost Basis | Market-Sensitive | Optimized over 10+ years |
| Time Commitment | High (Monitoring) | Low (Set and Forget) |
(Source: Vanguard Analysis of Systematic Investing, Oct 2023)
To implement this, leverage platforms like Fidelity, Schwab, or Robinhood, which now support fractional-share recurring investments. This allows you to split a monthly $1,000 contribution into four $250 Tuesday "micro-buys," effectively smoothing out intra-month volatility and capturing the lower historical mean prices associated with early-week trading.
So What? Automating your strategy converts a "market timing" gamble into a structural advantage. You aren't guessing where the bottom is; you are mathematically ensuring that your capital enters the market during the week's most statistically favorable windows.
For investors seeking to refine these entries further through institutional-grade insights, tools like Tritonix.ai provide the real-time research workflow necessary to align automated schedules with long-term fundamental shifts.
FAQ
Is there a specific best day of the week to buy stocks?
Historically, Monday afternoon or the Tuesday open have been the best times to buy. While the traditional 'Monday Effect' has faded, 'Turnaround Tuesday' remains a statistically strong day for market recoveries.
When is the best time of the month to buy stocks?
The middle of the month, specifically between the 15th and 22nd, is often the best time to buy. This 'liquidity vacuum' occurs after automated turn-of-the-month buying is exhausted and during monthly options expiration volatility.
Why should I avoid buying stocks on the 1st of the month?
Buying on the 1st often forces you to pay a 'payday premium' due to massive automated 401(k) contributions and institutional rebalancing that artificially inflate prices at the start of the month.
What are the best months of the year to buy stocks?
The last 10 days of September through early October historically offer the best buying windows. This period often marks an annual low before the year-end 'Santa Claus Rally' begins in November and December.
What is the best time of day to execute a stock buy?
The best time to buy is typically around 10:30 AM EST. This 'Sweet Spot' occurs after the high volatility of the market open has subsided but while liquidity remains high enough to ensure tight spreads.