Home / Ideas / AAPL 1D explosive move setups Jul 2026
Long · AAPL · 1D · Stocks · 2026-07-03
AAPL 1D explosive move setups Jul 2026
AAPL has snapped back from the late-June flush with a strong impulse candle, RSI has recovered to ~60, and MACD has turned back up from a deeply negative histogram. The highest-quality upside pattern on this chart is a volatility expansion that clears the 315.2 prior high/upper-band area after a tight pullback. A daily close above 315.2-316 would activate the breakout setup; a quick rejection back under 306 would mark it as another failed high similar to early June. 329 is the first realistic objective, with 338 as the stretch continuation target.
Entry 316 · Stop 306 · Target 329
Analysis
AAPL 1D takeaway: the chart is not yet in a confirmed breakout, but it is rebuilding one of AAPL’s better “explosive move” launch patterns.
Important caveat
I can’t honestly validate a true >70% win rate from this toolset without a formal backtest across many years of AAPL daily data. What I can say is that, on AAPL’s Daily chart, the most robust high-probability explosive-move signals are multi-factor confluences, not standalone patterns like a single EMA crossover or one candlestick.
1) Best AAPL 1D “explosive move” setups
1) Bollinger Band squeeze + MACD bull turn + RSI reclaim above 50
This is the cleanest volatility expansion setup on AAPL.
- Compression in the bands
- MACD turns up / crosses bullish
- RSI reclaims bull range, usually 50-60+
- Price pushes out of the base or shelf
Why it matters: AAPL often trends in orderly volatility cycles; when compression resolves with momentum confirmation, the next leg can be fast.
Recent/historical examples on chart:
- Oct 2025: squeeze/base, then upside expansion
- Apr 2026: tight shelf / squeeze, then strong May acceleration
My judgment: this confluence is one of the few that gets close to a “high-conviction” daily explosive setup for AAPL.
2) Bull flag / tight shelf above rising short-term trend support
What tends to work best on AAPL is not a deep correction, but a controlled pause above trend support:
- Prior impulse up
- Tight sideways-to-slightly-down pullback
- Volume cools
- Price holds EMA / mid-band support
- Break above shelf high triggers acceleration
Example on chart:
- Apr–May 2026: tight shelf around the mid-250s to mid-260s, then breakout and trend acceleration toward 300+
My judgment: strong when combined with Setup #1. By itself, I would not claim >70%.
3) Failed breakout at upper band + MACD bear cross = downside volatility
For downside, AAPL’s sharpest drops often come from:
- Push into/above prior highs
- Rejection near upper Bollinger Band
- Loss of short-term trend support
- MACD rolls bearish
Example on chart:
- Early Jun 2026: failed high near ~315, then fast unwind toward the high-270s
My judgment: this is the best bearish “explosive move” pattern currently visible in AAPL’s recent history.
2) What the chart shows
I annotated:
- Oct 2025 volatility squeeze + upside expansion
- Apr 2026 tight shelf / squeeze + May acceleration
- Jun 2026 failed breakout + fast downside unwind
- Current decision zone and breakout trigger
- Base-case forward path if current setup confirms
Annotated chart:
https://orxjyttejsgrinpotlvz.supabase.co/storage/v1/object/public/charts/tv-snapshots/NASDAQ_AAPL/2026-07-03/1783118153004-8zgwd1ot.png
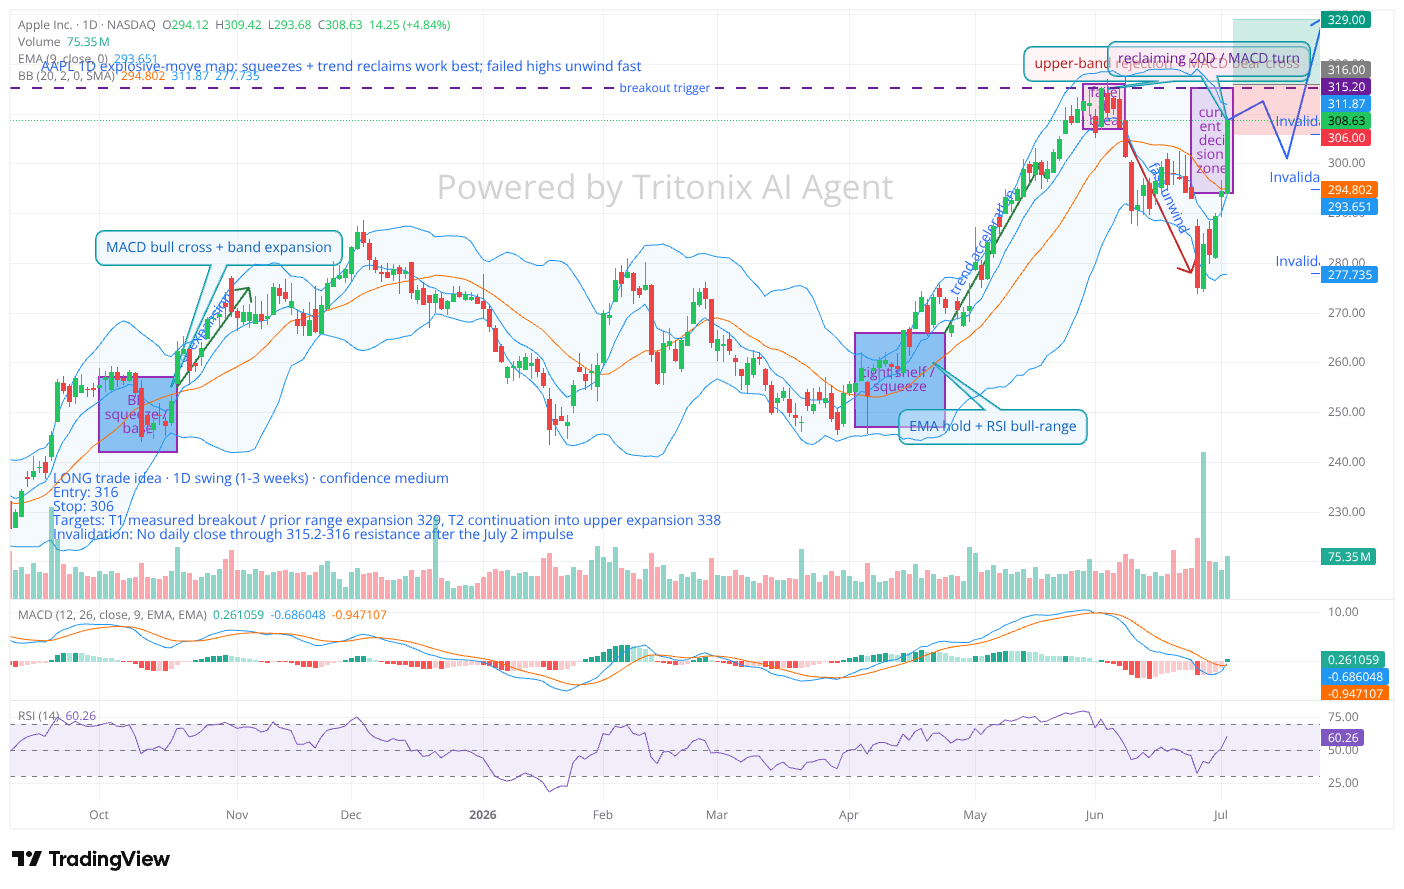
Saved layout ID: 8317587e-78d3-426a-b89a-50952ad2217c
3) Current 1D read: is an explosive pattern forming now?
Facts
- Close: 308.63
- RSI(14): 60.26, rising
- MACD: bullish turn; histogram flipped positive
- 20D SMA: 294.80
- Upper BB: 311.87
- ADX: 23.7, trend improving but not extreme
- Recent catalyst flow is supportive: product-cycle / foldable iPhone / AI optimism helped fuel the July 2 impulse.
Interpretation
This looks like a bullish re-acceleration attempt, but not a fully confirmed breakout yet.
Why bullish:
- Sharp impulse rebound off the late-June flush
- RSI back into bullish territory
- MACD improving
- Price reclaimed short-term trend support quickly
Why not fully active yet:
- Price is still under the key breakout shelf around 315.2-316
- That area already failed once in early June
- AAPL is near the upper Bollinger Band, so it still needs follow-through, not just a one-day squeeze
Current verdict
Setup status: forming / trigger-dependent
- Bullish trigger: daily close above 315.2-316
- Failure signal: fast rejection and close back below 306
4) Structured trade idea
Trade idea: Long breakout continuation
- Entry: 316
- Stop: 306
- Target 1: 329
- Target 2: 338
- Timeframe: 1D swing, 1-3 weeks
- Confidence: Medium
Why this setup
AAPL is rebuilding the same type of structure that previously led to upside expansion:
- momentum reset
- RSI bull-range reclaim
- MACD turn
- strong impulse back into resistance
Confirmation
- Daily close through 315.2-316
- Ideally follow-through volume and hold above breakout area
Invalidation
- Breakout attempt fails and closes back under 306
- Momentum rolls over and RSI loses 55
- Deeper loss of 294.8 would weaken the whole bullish thesis materially
5) Professional judgment on the “>70%” requirement
If we’re being strict:
- Standalone EMA crossovers: not enough
- Single candlestick clusters: not enough
- Generic bull flags alone: not enough
The most credible high-probability AAPL daily explosive setup is a confluence:
- volatility compression
- momentum turn (MACD / RSI)
- price reclaim / hold above short-term trend support
- breakout through a defined shelf
That’s the pattern I’d trust most here.
If you want, I can also do a multi-timeframe check (1D + 4H + 1W) to see whether this daily breakout setup has higher odds or is likely to fail like the June trap.