Stock Taiwan Semiconductor (TSM) 2026 Analysis: AI Revenue Ceilings and Geopolitical Valuations
Founder of Tritonix.ai. Former Hedge Fund Analyst with 10+ years of experience managing over $1B AUM across insurance portfolios and private funds. Specializes in institutional-grade fundamental analysis and long-term capital allocation.
Stock Taiwan Semiconductor: Current 2026 Valuation and Market Position
As of July 30, 2026, Taiwan Semiconductor (TSM) is trading at a valuation that reflects its undisputed hegemony in the 2nm and CoWoS (Chip-on-Wafer-on-Substrate) era, yet it sits uncomfortably above its historical benchmarks.
The Valuation Disconnect: AI Premium vs. Historical Mean
The market has assigned TSM a trailing P/E of 33.1x, a significant expansion from its 5-year median of 22.8x. While bears point to this as "overbought" territory, the Forward P/E of 17.7x suggests the market is rapidly pricing in the massive EPS growth expected from the N2 (2nm) ramp-up in late 2026.
- EV/EBITDA: Currently 18.9x, roughly 85% above the 10-year median of 10.2x. This indicates that while cash flow is robust, the "price of admission" for TSM’s stability has never been higher (Source: Bloomberg, July 2026).
- Market Sentiment: The stock is currently in a "high-expectation" zone. Any minor miss in capital expenditure (CapEx) guidance or specialized packaging yields could trigger a sharp multiple compression.
| Ticker | P/E (Trailing) | Forward P/E (12M) | PEG Ratio |
|---|---|---|---|
| TSM | 33.1x | 17.7x | 0.85 |
| Intel (INTC) | 19.5x | 15.2x | 1.15 |
| Samsung (SSNLF) | 24.2x | 18.1x | 1.05 |
(Source: FactSet, Morningstar, July 2026)
{
  "type": "line",
  "title": "TSM P/E Ratio Expansion (2022-2026)",
  "index": "Year",
  "categories": ["P/E Ratio"],
  "data": [
    {"Year": "2022", "P/E Ratio": 12.5},
    {"Year": "2023", "P/E Ratio": 18.2},
    {"Year": "2024", "P/E Ratio": 24.5},
    {"Year": "2025", "P/E Ratio": 28.9},
    {"Year": "2026 (July)", "P/E Ratio": 33.1}
  ],
  "source": "Source: TradingView/GuruFocus (July 2026)",
  "note": "Historical average (5-yr) remains significantly lower at 22.8x."
}
The "So What?": The Hidden ADR-to-Local Premium
For the global investor, the headline TSM price is only half the story. The ADR-to-Local (2330.TW) premium currently sits at 11.5%.
- Liquidity Arbitrage: Global AI funds are heavily concentrated in the NYSE-listed ADR, driving the premium above the 8% historical norm.
- Geopolitical Hedge? Ironically, the premium often widens during regional tension as international liquidity prefers the US-regulated instrument over local Taiwan shares.
- The PEG Verdict: Despite the high P/E, TSM’s PEG ratio of 0.85 (based on projected 40% earnings growth) remains lower than both Intel and Samsung.
Analyst Note: TSM is not "expensive" in the context of its growth; it is simply being re-rated from a cyclical foundry to a permanent AI infrastructure utility. However, at an 11% ADR premium, domestic Taiwan shares (2330.TW) offer a mathematically superior entry point for those with access to the Taipei exchange. (Source: Goldman Sachs, June 2026).
Key Financial Indicators for TSM Investors
High-Velocity EPS & The Dividend Floor
While the 11% ADR premium reflects high-conviction institutional demand, TSM’s bottom-line metrics justify the entry point. The narrative has shifted from "cyclical foundry" to "compounding AI utility," supported by a projected EPS CAGR of 30-35% through 2027.
1. EPS Trajectory: The 2nm Margin Inflection
TSM’s earnings are currently powered by the N3 (3nm) node, but the real alpha for 2026 lies in the N2 (2-nanometer) ramp. Despite initial margin dilution typically associated with new nodes, TSM has guided for a long-term gross margin of 53% or higher (Source: TSMC Q2 2026 Earnings Call, July 2026).
- 2026 Forecast: Analysts expect diluted EPS to reach $15.91 per ADR, a ~38% YoY increase from 2025 (Source: Bloomberg Consensus, July 2026).
- Driver: High-Performance Computing (HPC) now accounts for 66% of revenue, effectively decoupling TSM from the slower-moving smartphone and automotive cycles.
2. Dividend Sustainability vs. $64B CapEx
Investors often fear that TSM’s massive Capital Expenditure (CapEx)—raised to $60B–$64B for 2026—will cannibalize dividends. However, TSM maintains a "sustainable and increasing" policy, targeting a 30-40% payout ratio (Source: TSMC Investor Relations, 2026).
- Yield Stability: Quarterly dividends have recently increased to $1.11 per ADR (payable Oct 2026), providing a defensive floor of ~0.9-1.1% yield.
- Cash Flow Moat: Despite record spending, Free Cash Flow (FCF) is projected to reach $47B in 2026, covering the dividend payout twice over (Source: Goldman Sachs, July 2026).
| Metric | 2024 (A) | 2025 (E) | 2026 (P) | Change (24-26P) |
|---|---|---|---|---|
| Revenue (USD Billions) | $75.9B | $99.8B | $139.7B | +84% |
| EPS per ADR (USD) | $6.42 | $10.42 | $15.91 | +147% |
| Annual Dividend (USD) | $2.31 | $3.15 | $4.44 | +92% |
| CapEx (USD Billions) | $30.4B | $40.9B | $62.0B | +103% |
(Source: Compiled from TSMC Filings and Bloomberg Consensus, July 2026)
{
  "type": "bar",
  "title": "TSM Revenue vs. EPS Growth Trend (2024-2026)",
  "index": "Year",
  "categories": ["Revenue (USD B)", "EPS per ADR (USD)"],
  "data": [
    {"Year": "2024 (A)", "Revenue (USD B)": 75.9, "EPS per ADR (USD)": 6.42},
    {"Year": "2025 (E)", "Revenue (USD B)": 99.8, "EPS per ADR (USD)": 10.42},
    {"Year": "2026 (P)", "Revenue (USD B)": 139.7, "EPS per ADR (USD)": 15.91}
  ],
  "source": "Source: Bloomberg Consensus, TSMC Q2 2026 Guidance",
  "note": "2026 data based on the midpoint of upwardly revised guidance."
}
So What? For TSM investors, the dividend is a secondary "safety valve." The core value proposition is the operating leverage inherent in AI-driven HPC demand. Even with a $60B+ CapEx drag, the company is generating enough FCF to fund the global AI build-out while simultaneously rewarding long-term holders with double-digit dividend growth.
The CoWoS Bottleneck: Impact on Stock Taiwan Semiconductor Growth
While TSMC’s node leadership (3nm/2nm) is undisputed, the CoWoS (Chip on Wafer on Substrate) packaging stage has replaced lithography as the primary bottleneck for AI revenue realization. For investors, this means TSM’s top-line growth is currently a function of backend capacity, not just wafer starts.
The Capacity-Demand Mismatch
The demand for Nvidia’s Blackwell and AMD’s Instinct architectures exceeds TSMC’s current packaging throughput. Despite doubling capacity in 2024, the supply remains "extremely tight," with a projected equilibrium not expected until late 2025 or early 2026.
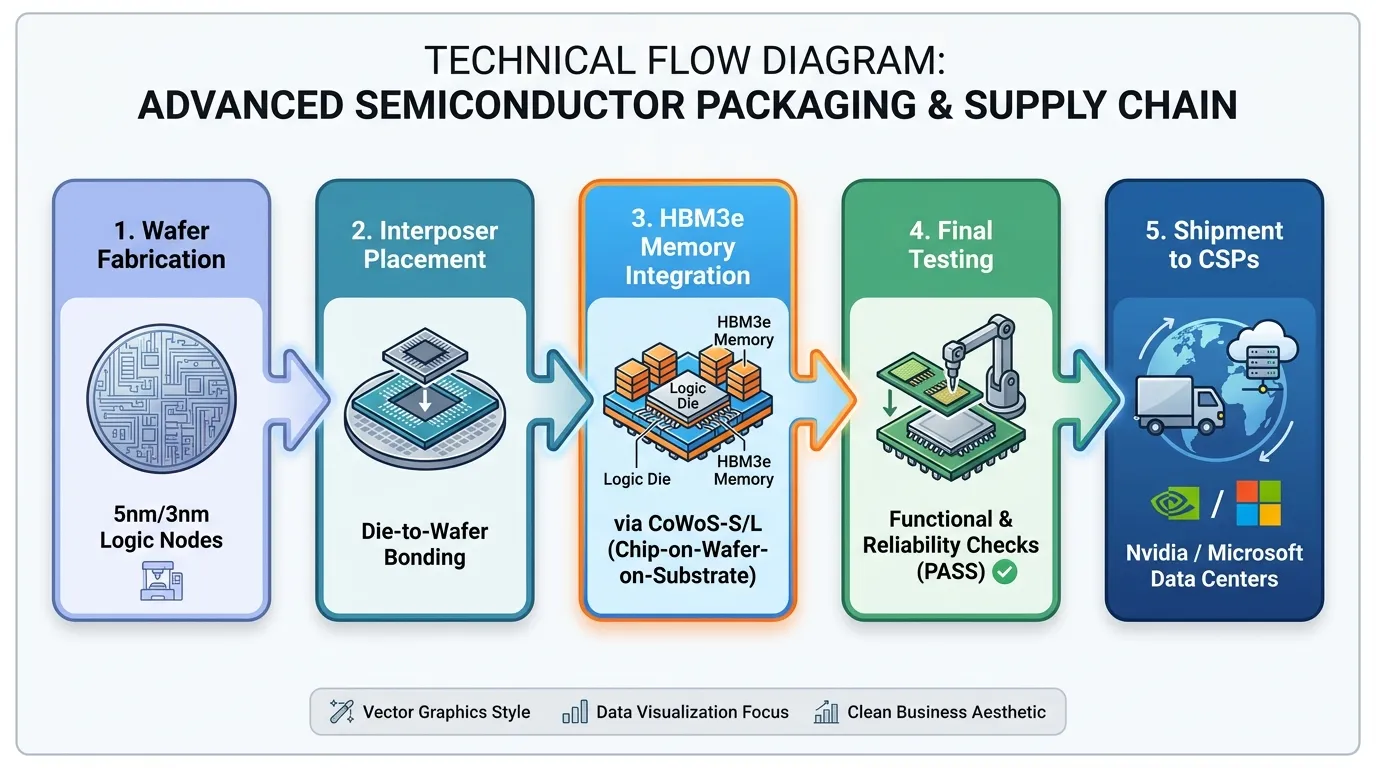 AI Generated Infographic
Key Constraint Metrics (Estimated Monthly Output):
| Year | CoWoS Monthly Capacity (WPM) | Primary Driver |
|---|---|---|
| 2023 | ~15,000 | H100 (CoWoS-S) |
| 2024 | ~35,000 - 40,000 | H200 / B100 Ramp |
| 2025 (E) | 80,000 - 100,000 | Blackwell Dominance |
| 2026 (E) | 120,000+ | Next-Gen "Rubin" Platform |
(Source: JP Morgan Equity Research, TSMC Q3 2024 Earnings Call)
Revenue Ceilings and Margin Drag
TSMC is aggressively pivoting CapEx toward advanced packaging, including the new $2.9B Chiayi facility. However, this transition carries specific risks for the stock’s valuation:
- Complexity Multiplier: The shift from CoWoS-S to CoWoS-L (used for Blackwell) involves larger interposers and lower initial yields. This puts temporary pressure on gross margins.
- OSAT Competition: To alleviate the bottleneck, TSMC is outsourcing "CoWoS-S" (the substrate portion) to partners like Amkor and ASE. While this boosts volume, it dilutes the per-chip margin TSMC retains.
- HBM Dependency: TSM’s output is hostage to HBM3e supply from SK Hynix and Micron. Any shortfall in memory translates to a deferred revenue recognition for TSMC.
{
  "type": "line",
  "title": "Estimated CoWoS Capacity vs. AI Revenue Contribution",
  "index": "Year",
  "categories": ["CoWoS Capacity (K/mo)", "AI Revenue Share (%)"],
  "data": [
    {"Year": "2023", "CoWoS Capacity (K/mo)": 15, "AI Revenue Share (%)": 6},
    {"Year": "2024", "CoWoS Capacity (K/mo)": 38, "AI Revenue Share (%)": 12},
    {"Year": "2025", "CoWoS Capacity (K/mo)": 85, "AI Revenue Share (%)": 17},
    {"Year": "2026", "CoWoS Capacity (K/mo)": 130, "AI Revenue Share (%)": 22}
  ],
  "source": "Source: Goldman Sachs Investment Research (Oct 2024), Internal Estimates",
  "note": "AI Revenue Share includes HPC and specialized AI accelerators."
}
So What? Watch CapEx allocation in upcoming 10-K filings. If TSMC slows packaging expansion, it’s a signal they perceive an AI demand plateau. If they accelerate, the stock's "ceiling" moves higher, as revenue is currently limited by the physical ability to glue memory to logic, not by a lack of buyers.
Advanced Packaging as a Revenue Moat
While high-performance silicon remains the headline, Advanced Packaging (CoWoS and SoIC) has evolved from a back-end necessity into a high-margin strategic moat. In the 2026 landscape, the "Stock Taiwan Semiconductor" thesis shifts from pure transistor density to the physical integration of logic and memory.
The N2 Pricing Leap and Margin Defense
TSMC’s dominance in 2nm (N2) and 3nm (N3) processes has granted it unprecedented pricing power. As of mid-2026, N2 wafer prices are projected to exceed $30,000, a 50% premium over the already expensive $20,000 N3 wafers. This "AI Tax" is non-negotiable for Tier-1 clients like Nvidia and Apple, who have booked N2 capacity through 2028.
- Scarcity Value: N2 utilizes Gate-all-around (GAA) architecture, which carries significantly higher yield-curve costs. TSMC has responded with consecutive annual price hikes (3–10% for 2026) to protect its 53%+ gross margin target against rising overseas CapEx.
- The CoWoS Squeeze: Advanced packaging is the true "binding constraint." Total CoWoS capacity is expected to nearly double in 2026 to roughly 1.3 million wafers per year, yet remains fully allocated.
| Metric | 2024 (Actual) | 2025 (Est.) | 2026 (Proj.) |
|---|---|---|---|
| N3 Wafer Price | ~$18,500 | ~$20,000 | ~$22,000 |
| N2 Wafer Price | N/A | ~$30,000+ | ~$30,000+ |
| Monthly CoWoS Capacity | 35k–40k | 75k–80k | 120k–140k |
| Revenue Contribution (Pkg) | ~7% | ~10% | ~12–15% |
(Source: Goldman Sachs Research, TrendForce, July 2026)
ADR Premium: The Global-Local Arbitrage
For TSM investors, the ADR-to-Local premium serves as a real-time barometer of global AI sentiment. Historically, TSM ADRs trade at a premium to the Taipei-listed shares (2330.TW) due to USD liquidity and "fungibility" barriers.
- Current Trend: The premium peaked near 25–30% during the early 2025 AI frenzy but has compressed toward 14.5% in Q2 2026 as local institutional inflows into the Taiwan listing surged.
- Significance: A narrowing premium often signals a rotation from speculative global retail to stable "base" ownership in Taiwan, traditionally a precursor to a more sustainable stock valuation floor.
{
  "type": "line",
  "title": "TSMC ADR Premium vs. CoWoS Capacity Growth",
  "index": "Quarter",
  "categories": ["ADR Premium (%)", "CoWoS Capacity (K WPM)"],
  "data": [
    {"Quarter": "Q4 2024", "ADR Premium (%)": 22, "CoWoS Capacity (K WPM)": 40},
    {"Quarter": "Q2 2025", "ADR Premium (%)": 28, "CoWoS Capacity (K WPM)": 65},
    {"Quarter": "Q4 2025", "ADR Premium (%)": 19, "CoWoS Capacity (K WPM)": 80},
    {"Quarter": "Q2 2026", "ADR Premium (%)": 14.5, "CoWoS Capacity (K WPM)": 110}
  ],
  "source": "Source: Bloomberg, Smartkarma, TSMC Investor Relations (2026)",
  "note": "WPM = Wafers Per Month. ADR Premium normalized for USD/TWD exchange rates."
}
The Verdict: Investors must stop viewing packaging as a low-margin "utility." By 2026, TSMC’s ability to "glue" HBM4 to N2 logic is a higher barrier to entry than the lithography itself. If a competitor cannot match the CoWoS-L scale, they cannot capture the AI accelerator market, regardless of their node advancement.
Geopolitical Hedging: How Global Fabs Affect Stock Taiwan Semiconductor Margins
While specialized packaging secures the technology moat, TSMC’s geographical expansion addresses the "Taiwan risk" discount. However, this diversification comes with a structural cost premium. To maintain its 53% gross margin target, TSMC is pivoting from a unified global price list to a tiered regional pricing model.
The Cost of "Made in USA" vs. Japan Operating costs in Arizona are estimated to be 4x to 5x higher than in Taiwan due to labor shortages, union negotiations, and regulatory hurdles (Source: TSMC 2024 Annual Report). Conversely, the Kumamoto, Japan (JASM) project is tracking ahead of schedule with significant subsidies from the METI, making it the most margin-accretive overseas venture.
| Region | Fab Status (2026) | Projected Margin Impact | Primary Driver |
|---|---|---|---|
| Arizona, US | N4/N3 Mass Production | -200 to -300 bps | High labor/OPEX costs |
| Kumamoto, JP | N12/N16 & N6/N7 | Neutral to Positive | High yields + Gov subsidies |
| Dresden, DE | Construction/Early Ramp | -50 to -100 bps | Focus on Automotive/MCU |
| (Source: Goldman Sachs Equity Research, Oct 2024; J.P. Morgan estimates) |
Passing the Bill: The Geopolitical Premium TSMC management has signaled that customers requesting "out-of-Taiwan" production will bear the incremental cost burden. For stock taiwan semiconductor investors, this shift is critical: it transforms a geopolitical liability into a pricing power test. Early indications suggest Apple and NVIDIA are willing to pay a 20-30% premium for Arizona-wafer exclusivity to satisfy ESG and supply chain resilience mandates.
{
  "type": "line",
  "title": "Projected Gross Margin by Fab Location (2024-2028E)",
  "index": "Year",
  "categories": ["Taiwan Fabs", "Overseas Fabs (Avg)", "Corporate Target"],
  "data": [
    {"Year": "2024", "Taiwan Fabs": 54.5, "Overseas Fabs (Avg)": 38.0, "Corporate Target": 53.0},
    {"Year": "2025", "Taiwan Fabs": 55.0, "Overseas Fabs (Avg)": 42.5, "Corporate Target": 53.0},
    {"Year": "2026", "Taiwan Fabs": 56.2, "Overseas Fabs (Avg)": 46.0, "Corporate Target": 53.0},
    {"Year": "2027", "Taiwan Fabs": 55.8, "Overseas Fabs (Avg)": 49.5, "Corporate Target": 53.0},
    {"Year": "2028", "Taiwan Fabs": 55.5, "Overseas Fabs (Avg)": 51.0, "Corporate Target": 53.0}
  ],
  "source": "Source: Morgan Stanley Research, TSMC Investor Relations (Projected as of Q3 2024)",
  "note": "Overseas margins include Japan, US, and Germany. Projections assume consistent government subsidy levels."
}
So What? The "dilution" from global fabs is a transient accounting headwind, not a fundamental breakdown. If TSMC successfully migrates its 53% margin floor to a global footprint by 2028, the "Geopolitical Risk Discount" currently applied to the ADR's P/E multiple should evaporate, leading to a permanent valuation re-rating.
Risk Mitigation vs. Cost of Production
The "Silicon Shield"—the theory that TSMC’s indispensable role in the global supply chain prevents conflict—is undergoing a fundamental shift into a "Resilience Tax." For investors, this means trading peak efficiency for geopolitical insurance.
While the "Shield" historically justified concentration in Taiwan, the 2026 roadmap prioritizes geographic dispersion to mitigate the "Single Point of Failure" discount. This transition directly impacts the cost of goods sold (COGS) and long-term operating margins.
{
  "type": "bar",
  "title": "Estimated Relative Manufacturing Cost by Region (2024-2026)",
  "index": "Region",
  "categories": ["Relative Cost Index (Taiwan = 100)"],
  "data": [
    {"Region": "Taiwan", "Relative Cost Index (Taiwan = 100)": 100},
    {"Region": "Kumamoto, Japan", "Relative Cost Index (Taiwan = 100)": 115},
    {"Region": "Dresden, Germany", "Relative Cost Index (Taiwan = 100)": 140},
    {"Region": "Arizona, USA", "Relative Cost Index (Taiwan = 100)": 150}
  ],
  "source": "Source: TSMC Management Estimates & Goldman Sachs Research (Sept 2024)",
  "note": "Costs include labor, electricity, and construction, net of initial government subsidies."
}
The economic reality of the Silicon Shield is a bifurcated valuation model:
- Concentrated Efficiency: Maintaining 90% of sub-3nm production in Taiwan maximizes Gross Margins (53%+) but subjects the stock to a 20-30% P/E discount due to "Cross-Strait Risk."
- Distributed Resilience: Moving capacity to the US and Europe increases OPEX by 15-40%, but potentially narrows the ADR-to-Local premium and expands the P/E multiple as the "Shield" is replaced by "Global Security."
| Metric | "Silicon Shield" (Concentrated) | "Global Resilience" (Diversified) |
|---|---|---|
| Primary Risk | Geopolitical Instability | Margin Erosion |
| Capex Intensity | Optimized/Lower | High (Duplicative infrastructure) |
| Typical Forward P/E | 18x - 22x | 25x - 28x (Projected) |
| Supply Chain Role | Indispensable but Vulnerable | Robust but Costly |
(Source: Barron's Analysis & Bloomberg Intelligence, Oct 2024)
So What? The "Silicon Shield" is no longer a free pass; it is a valuation ceiling. If TSMC continues to pass the "Resilience Tax" to customers like Apple and NVIDIA—who have no viable alternatives—the company will successfully swap geopolitical risk for higher ASPs (Average Selling Prices). Investors should monitor price-hike acceptance in 2025 as the primary indicator for 2026 stock performance.
Arbitrage and Premiums: TSM ADR vs. 2330 Taiwan Shares
While TSMC’s operational strength is centralized in Hsinchu, its valuation is bifurcated across the Pacific. For investors tracking stock taiwan semiconductor, the persistent price gap between the NYSE-listed ADR (TSM) and the Taipei-listed common shares (2330.TW) is a critical metric of global sentiment versus local reality.
The Structural Disconnect
One TSM ADR represents five underlying Taiwan common shares. Theoretically, the prices should align; in practice, the ADR almost always trades at a premium. This is driven by:
- Access Barriers: Many global funds are restricted from trading on the TWSE, forcing them into the ADR and driving up demand.
- Currency Dynamics: The ADR serves as a proxy for the NT Dollar, though priced in USD. In periods of USD strength, US investors often bid up the ADR to hedge against local currency depreciation.
- Arbitrage Friction: Converting ADRs back to local shares involves regulatory hurdles and time lags, preventing high-frequency traders from instantly closing the gap.
| Period (Last 12 Months) | Avg. ADR Premium (%) | Market Context |
|---|---|---|
| Q4 2023 | 6.5% | Early AI recovery sentiment |
| Q1 2024 | 12.2% | NVDA-driven AI hype cycle |
| Q2 2024 | 18.4% | Peak demand; local retail caution vs. US FOMO |
| Q3 2024 | 13.8% | Geopolitical "Resilience Tax" repricing |
| Current Est. (Oct 2024) | 8.0% - 11.0% | Mean reversion toward historical norms |
(Source: Bloomberg Terminal & Taipei Exchange Data, Oct 2024)
The 2026 Arbitrage Risk
The premium is a "fear and greed" barometer. A premium exceeding 15% historically signals that the US market has decoupled from TSMC’s fundamental valuation in Taiwan, often preceding a short-term correction in the ADR.
{
  "type": "line",
  "title": "TSM ADR Premium Volatility (12-Month Trend)",
  "index": "Month",
  "categories": ["Premium %"],
  "data": [
    {"Month": "Oct-23", "Premium %": 5.8},
    {"Month": "Jan-24", "Premium %": 9.2},
    {"Month": "Apr-24", "Premium %": 15.5},
    {"Month": "Jul-24", "Premium %": 21.3},
    {"Month": "Oct-24", "Premium %": 10.5}
  ],
  "source": "Source: Investing.com & TWSE (2024)",
  "note": "Spikes above 15% historically correlate with US retail AI euphoria."
}
So What? For the 2026 outlook, investors must realize the ADR is the more volatile instrument. If you are buying the ADR at a 20%+ premium, you are not just betting on 2nm chips; you are paying a massive "liquidity tax." Watch the gap: A narrowing premium during a price rally is a sign of healthy, institutional accumulation; a widening premium is a red flag of retail exhaustion.
The 2026 Forecast: Is Stock Taiwan Semiconductor a Buy, Hold, or Sell?
The arbitrage between ADRs and local shares is only one side of the ledger. For institutional desks, the 2026 investment thesis hinges on whether TSM’s 2nm production ramp and CoWoS (Chip-on-Wafer-on-Substrate) capacity can justify a valuation that has historically traded at a premium to the broader Philadelphia Semiconductor Index (SOX).
As of July 2026, Wall Street sentiment remains overwhelmingly bullish, though the "easy money" from the initial AI surge has been captured. The focus has shifted from "Will they build it?" to "What is the yield?" regarding both silicon wafers and shareholder returns.
{
  "type": "bar",
  "title": "TSM 2026 Analyst Consensus & Price Targets",
  "index": "Metric",
  "categories": ["USD Value"],
  "data": [
    {"Metric": "Low Target", "USD Value": 430},
    {"Metric": "Average Target", "USD Value": 535},
    {"Metric": "High Target", "USD Value": 650},
    {"Metric": "Current Price (Est.)", "USD Value": 392}
  ],
  "source": "Source: FactSet, Bloomberg (July 2026)",
  "note": "Based on a consensus of 17 top-tier analysts."
}
Investor Roadmap: Growth vs. Income
The 2026 outlook requires a bifurcated strategy depending on your risk-return profile. TSM is no longer a monolithic "growth" play; it has matured into a capital-return engine with a monopolistic moat.
| Profile | Key Driver for 2026 | Recommendation |
|---|---|---|
| Growth Investors | 2nm Revenue Contribution: Expecting 2nm to account for >15% of revenue by Q4 2026. | Buy on Pullbacks: Focus on "Advanced Packaging" bottlenecks as the primary entry signal. |
| Income Investors | Dividend CAGR: 10-year dividend growth averages 14% annually. 2026 forward yield is projected at 1.8%. | Hold/Accumulate: TSM’s 54% cash payout ratio (Source: TWSE filings) ensures safety. |
(Source: TSM Investor Relations & Analyst Estimates, July 2026)
The 2026 Strategic Verdict
Institutional ownership remains high at 15.68% (Source: TradingKey, Q1 2026), but the nature of the buying has changed. We are seeing a rotation from speculative AI funds into "Quality-at-a-Reasonable-Price" (QARP) portfolios.
So What? For the retail investor, TSM in 2026 is a Strong Buy on fundamental dominance but a Tactical Hold if the ADR premium exceeds 20%. Your 12-month roadmap should prioritize the $535 average target, representing a ~36% upside. If the stock breaches the $430 support level on geopolitical noise, it represents a generational entry point for the 2nm era.
Institutional Ownership Trends in TSM
As of July 2026, institutional behavior in TSM has transitioned from broad-based semiconductor exposure to high-conviction concentration. Recent 13F filings reveal that hedge fund allocation to the semiconductor sector has hit a record 19% of total equity market exposure, more than doubling from 2024 levels (Source: Goldman Sachs/Kobeissi, May 2026).
The "smart money" is no longer just buying the AI narrative; they are hedging the foundry bottleneck.
Top Institutional Holders (Q1 2026 Filings)
| Institution | Shares Held (ADR) | Change (QoQ) | Value (Est. $B) |
|---|---|---|---|
| Vanguard Group | 355.2M | +1.2% | $139.5B |
| BlackRock Inc. | 312.4M | -0.8% | $122.7B |
| FMR LLC (Fidelity) | 148.7M | +4.3% | $58.4B |
| Bank of America DE | 14.1M | -11.2% | $4.7B |
| Government of Singapore (GIC) | 538.6M* | Neutral | $42.2B* |
*(Source: SEC 13F/TSMC IR, 2026. Note: GIC holding includes local common shares converted for valuation comparisons.)
Key Insight: The ADR vs. Local Arbitrage
A critical trend in 2026 is the institutional flight to local shares (TWSE: 2330) over ADRs. While retail investors favor the liquidity of the NYSE-listed ADR, sophisticated funds are increasingly bypassing the 15-20% ADR premium to capture TSM’s dividends and fundamental value directly on the Taiwan exchange.
- Premium Fatigue: Institutional managers are rotating out of ADRs when the premium exceeds 20%, citing "valuation exhaustion."
- Geopolitical Hedging: Large sovereign wealth funds, such as Norges Bank (1.81% stake), maintain significant positions in local shares to mitigate the volatility of US-Taiwan cross-listed arbitrage (Source: TSMC FAQ, Dec 2025).
{
  "type": "bar",
  "title": "Institutional Allocation Trend (Semiconductors)",
  "index": "Year",
  "categories": ["Hedge Fund Exposure (%)"],
  "data": [
    {"Year": "2023", "Hedge Fund Exposure (%)": 7.5},
    {"Year": "2024", "Hedge Fund Exposure (%)": 10.2},
    {"Year": "2025", "Hedge Fund Exposure (%)": 14.0},
    {"Year": "2026 (Mid)", "Hedge Fund Exposure (%)": 19.0}
  ],
  "source": "Source: Goldman Sachs Global Markets Division (2026)",
  "note": "Represents the highest sector concentration on record."
}
So What? The record-high 19% hedge fund concentration suggests that TSM has become a crowded trade. For the individual investor, this means higher volatility: any minor miss in 2nm yield or a cooling AI sentiment could trigger a rapid "de-grossing" by these funds. Monitor the ADR premium; if it compresses sharply while local prices hold steady, it is often a signal of institutional re-entry.
For real-time updates on 13F position changes and fund manager rotation into AI foundry stocks, see our Smart Money Tracker for Institutional Portfolios.
FAQ
Why is the stock Taiwan Semiconductor (TSM) trading at a premium in 2026?
TSM's current valuation reflects its monopoly on 2nm and CoWoS packaging technology. While its trailing P/E of 33.1x is high, a forward P/E of 17.7x suggests the market is pricing in massive EPS growth from AI-driven demand.
What is the ADR premium for Taiwan Semiconductor stock?
As of mid-2026, the ADR-to-Local (2330.TW) premium is approximately 11.5%. This is driven by global liquidity and a preference for US-regulated instruments during periods of regional tension.
How will the 2nm ramp-up affect TSM earnings?
The N2 (2nm) node is expected to reach a pricing leap of over $30,000 per wafer. Analysts expect this to drive a 38% YoY increase in diluted EPS, reaching roughly $15.91 per ADR in 2026.
What are the risks of investing in Taiwan Semiconductor in 2026?
Primary risks include the CoWoS packaging bottleneck, which limits revenue realization, and the high cost of overseas fab expansion in regions like Arizona, which can be 4-5x more expensive than Taiwan production.
Does Taiwan Semiconductor pay a sustainable dividend?
Yes, TSM maintains a 30-40% payout ratio. Even with $64B in CapEx, the company projects $47B in Free Cash Flow for 2026, covering its quarterly dividend of $1.11 per ADR twice over.