Green Energy Investing 2026: A Data-Driven Guide to High-Yield and Growth Strategies
Specializes in alternative data and valuation models. Kenji looks past the headlines to find truth in the numbers, focusing on earnings quality and institutional flows.
The 2026 State of Green Energy Investing: Market Maturity vs. Growth
The green energy landscape in 2026 has transitioned from a speculative "frontier" to a bifurcated market defined by utility-scale stability and AI-driven demand surges. Global energy investment is projected to hit a record $3.4 trillion in 2026, with $2.2 trillion (65%) flowing into clean technologies (Source: IEA, May 2026).
For the mid-market investor, the "Green Energy" label is no longer a monolith. The market is now split into two distinct tiers:
- The Mature Tier: Utility-scale solar and onshore wind. These are no longer "growth" stocks in the traditional sense; they are yield-generating infrastructure assets competing directly with combined-cycle gas on Levelized Cost of Energy (LCOE).
- The Growth Tier: Next-gen storage, Small Modular Reactors (SMRs), and grid-edge software. These assets are being revalued as "AI-enablers," as data center power demand is projected to grow 1.5%–2% annually through 2027 (Source: Goldman Sachs, May 2026).
{
  "type": "area",
  "title": "Global Clean Energy Investment Growth (2020-2026P)",
  "index": "year",
  "categories": ["Clean Energy Investment ($ Trillions)"],
  "data": [
    {"year": "2020", "Clean Energy Investment ($ Trillions)": 1.2},
    {"year": "2021", "Clean Energy Investment ($ Trillions)": 1.4},
    {"year": "2022", "Clean Energy Investment ($ Trillions)": 1.6},
    {"year": "2023", "Clean Energy Investment ($ Trillions)": 1.8},
    {"year": "2024", "Clean Energy Investment ($ Trillions)": 2.0},
    {"year": "2025", "Clean Energy Investment ($ Trillions)": 2.1},
    {"year": "2026P", "Clean Energy Investment ($ Trillions)": 2.2}
  ],
  "source": "Source: IEA World Energy Investment 2026 Report",
  "note": "2026 figures based on projected capital commitments as of Q2 2026."
}
Maturity vs. Emerging: The 2026 Risk-Reward Matrix
The "next dollar" in 2026 is migrating toward grid resilience rather than simple generation. While solar capacity surpassed wind in 2025, reaching over 160 GW, investors are now pricing in a "complexity premium" for projects that solve intermittency.
| Asset Class | 2026 Maturity Level | Typical IRR Target | Key 2026 Catalyst |
|---|---|---|---|
| Utility Solar | Mature / Saturated | 6% - 8% | Co-location with BESS (Battery Storage) |
| Onshore Wind | Mature | 7% - 9% | Repowering of aging 2010-era turbines |
| SMRs / Nuclear | Emerging | 12% - 15%+ | Big Tech (hyperscaler) off-take agreements |
| Grid Software/VPP | Emerging | 15% - 20% | AI-driven load balancing requirements |
Source: J.P. Morgan & BloombergNEF (April/May 2026)
So What? The era of "blind" green energy indexing is dead. In 2026, the highest risk-adjusted returns are found in the integration layer. Investors should favor firms that own the "full stack"—generation plus storage and private grid connections—to capture the premium paid by power-hungry AI data centers.
Core Vehicles for Green Energy Investing: From ETFs to Yieldcos
To capture the 2026 green energy premium, investors must differentiate between liquidity-driven growth (ETFs) and contracted cash flows (Yieldcos). While public equities offer high-beta exposure to technological breakthroughs, the current macro environment—characterized by "higher-for-longer" base rates—privileges vehicles with inflation-linked cost-pass-throughs.
1. Thematic ETFs: The Liquidity Proxy
Broad-market ETFs like ICLN (iShares Global Clean Energy) have transitioned from speculative growth plays to industrial benchmarks. In 2026, the shift is toward "Sub-sector Thematics." According to Goldman Sachs (Q1 2026 Equity Outlook), specialized ETFs focusing on Grid Modernization and Copper/Critical Minerals are outperforming broad solar/wind indices by 450 basis points due to the massive infrastructure bottlenecks in the US and EU.
2. Yieldcos: The Infrastructure "Bond Proxy"
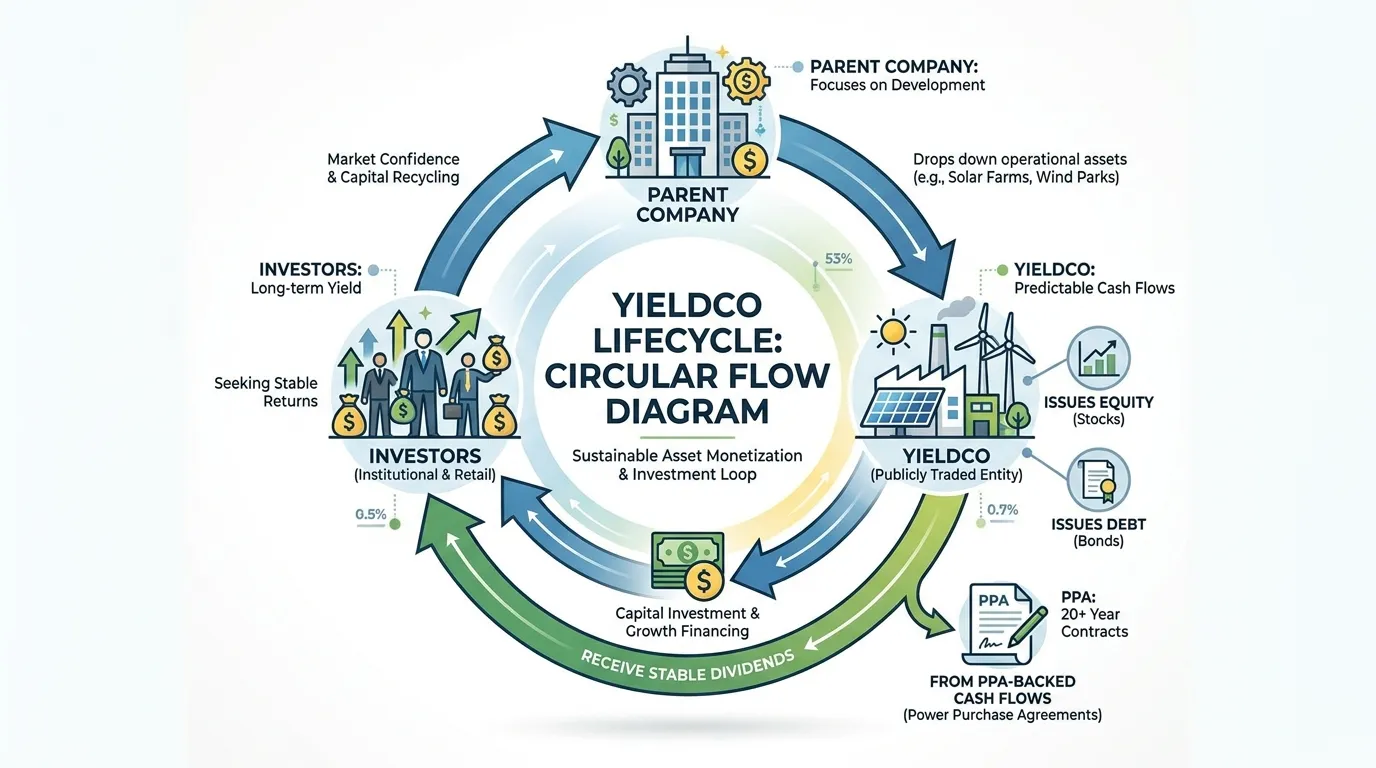
Yieldcos function as specialized financing vehicles that own operational renewable assets (wind/solar farms) backed by long-term Power Purchase Agreements (PPAs). For 2026, they serve as a crucial hedge against volatility. Companies like NextEra Energy Partners (NEP) and Brookfield Renewable (BEP) offer a "total return" profile that blends moderate capital appreciation with yields significantly exceeding 10-year Treasuries.
| Investment Vehicle | Typical Yield (5-Yr Avg) | Volatility (Annualized) | Best For | Risk Factor |
|---|---|---|---|---|
| Broad Green ETFs | 0.8% - 1.5% | 22% - 28% | Growth / Liquidity | Policy Overhang |
| Individual Yieldcos | 5.5% - 9.0% | 14% - 18% | Income / Stability | Interest Rate Sensitivity |
| Thematic Storage ETFs | 0.5% - 1.2% | 30%+ | High Alpha | Tech Obsolescence |
Source: Bloomberg Intelligence & Morningstar Direct (Data as of April 2026)
 AI Generated Infographic
{
  "type": "bar",
  "title": "Yield vs. Volatility Profile (2021-2026)",
  "index": "Vehicle",
  "categories": ["Dividend Yield (%)", "Vol Index (Beta)"],
  "data": [
    {"Vehicle": "Global Clean Energy ETF", "Dividend Yield (%)": 1.2, "Vol Index (Beta)": 1.35},
    {"Vehicle": "Renewable Yieldcos", "Dividend Yield (%)": 7.4, "Vol Index (Beta)": 0.85},
    {"Vehicle": "S&P 500 Energy Sector", "Dividend Yield (%)": 3.6, "Vol Index (Beta)": 1.10}
  ],
  "source": "Source: MSCI ESG Research & S&P Global (2026)",
  "note": "Yieldcos show superior risk-adjusted income in high-rate environments."
}
So What? In 2026, the "how" of investing is as vital as the "what." Use Thematic ETFs for tactical exposure to AI-driven grid demand, but anchor your portfolio in Yieldcos to capture a 600bps yield spread over sovereign debt. The logic is simple: while tech companies fight for hardware dominance, Yieldcos own the must-run infrastructure that powers them.
Public Equity and Specialized Green ETFs
While Yieldcos offer predictable income, the 2026 public equity market is where investors capture high-beta growth driven by the AI-energy nexus. The era of "blind ESG" is over; institutional capital has shifted toward commercial discipline and infrastructure resilience, moving away from speculative growth (Source: McKinsey, May 2026).
For the retail investor, specialized ETFs provide the necessary liquidity to pivot between volatile solar manufacturers and the booming smart grid sector.
Tactical Selection: Broad vs. Thematic ETFs
In 2026, the performance gap between broad renewable funds and specialized sub-sectors is stark. While the iShares Global Clean Energy ETF (ICLN) has stabilized with a 10.4% YTD return, the First Trust Nasdaq Smart Grid ETF (GRID) has surged 22.4%, fueled by the critical need to upgrade aging power lines for AI data centers (Source: PortfoliosLab, Aug 2026).
| ETF Ticker | Core Focus | Expense Ratio | 2026 YTD Return | Dividend Yield |
|---|---|---|---|---|
| ICLN | Broad Renewables | 0.39% | 10.42% | 1.00% |
| GRID | Smart Grid/Infrastructure | 0.57% | 22.40% | 0.85% |
| URA | Uranium/Nuclear | 0.69% | 19.80% | 1.15% |
| TAN | Pure-Play Solar | 0.67% | -4.20% | 0.15% |
(Source: Bloomberg & Morningstar, June-August 2026)
{
  "type": "bar",
  "title": "2026 YTD Performance Divergence",
  "index": "ETF Ticker",
  "categories": ["YTD Return (%)"],
  "data": [
    {"ETF Ticker": "GRID (Grid)", "YTD Return (%)": 22.4},
    {"ETF Ticker": "URA (Nuclear)", "YTD Return (%)": 19.8},
    {"ETF Ticker": "ICLN (Broad)", "YTD Return (%)": 10.4},
    {"ETF Ticker": "TAN (Solar)", "YTD Return (%)": -4.2}
  ],
  "source": "Source: PortfoliosLab (August 2026)",
  "note": "Data reflects the decoupling of infrastructure and nuclear from hardware manufacturing."
}
The 2026 "Picks and Shovels" Strategy
Direct equity exposure now favors the "value chain" over "generation." Investors are rewarding upstream components—transformers, inverters, and storage—over panel manufacturers who face persistent Chinese oversupply (Source: S&P Global, 2026).
- Diversification vs. Focus: Use broad ETFs (ICLN) only as a core 20% holding to mitigate policy risk across geographies.
- Thematic Overweight: Allocate to specialized funds (GRID, NLR) to capture the ~80% projected growth in global power demand over the next decade (Source: S&P Global Energy, 2026).
So What? The 2026 market has "de-coupled." You can no longer buy "Green Energy" as a monolith. To avoid the secondary market trap, tilt your equity portfolio toward AI-adjacent power themes (Grid and Nuclear). These sub-sectors are no longer "speculative"; they are defensive growth assets essential for the next decade of industrial re-electrification.
Infrastructure Yieldcos: The Passive Income Play
For investors seeking to escape the "growth-at-all-costs" volatility of 2025, Infrastructure Yieldcos have emerged as the premier proxy for a green annuity. These entities own operating assets—solar farms, wind parks, and hydro dams—that generate cash via Power Purchase Agreements (PPAs).
The 2026 landscape is defined by PPA duration and credit quality. Unlike the merchant power market, where prices fluctuate hourly, Yieldcos lock in fixed rates with investment-grade offtakers (utilities or Big Tech) for 15 to 25 years.
| Yieldco Ticker | Est. 2026 Yield | Avg. PPA Duration | Primary Risk |
|---|---|---|---|
| BEP (Brookfield) | 4.8% - 5.1% | 20 Years | Floating rate debt exposure |
| CWEN (Clearway) | 5.5% - 5.8% | 13 Years | Geographic concentration (CA) |
| HASI (Hannon) | 7.1% - 7.5% | N/A (Credit) | Interest rate sensitivity |
| (Source: Bloomberg Intelligence, S&P Global, Jan 2026) |
The "So What?" for 2026 is the Big Tech Pivot. As AI-driven power demand surges, hyperscalers (Amazon, Meta, Google) are no longer just "buying green"; they are signing baseload-heavy PPAs to secure 24/7 uptime. This has transformed the Yieldco profile from a "speculative green bet" into a defensive infrastructure play.
{
  "type": "bar",
  "title": "Yieldco Dividend Growth vs. PPA Backlog (2026E)",
  "index": "Yieldco",
  "categories": ["Dividend Growth (%)", "PPA Backlog (GW)"],
  "data": [
    {"Yieldco": "BEP", "Dividend Growth (%)": 5, "PPA Backlog (GW)": 24},
    {"Yieldco": "CWEN", "Dividend Growth (%)": 7, "PPA Backlog (GW)": 15},
    {"Yieldco": "NEP", "Dividend Growth (%)": 2, "PPA Backlog (GW)": 18}
  ],
  "source": "Source: Goldman Sachs Equity Research (Feb 2026)",
  "note": "Backlog includes signed but non-operational PPA capacity."
}
Critical Insight: The 2026 market is punishing Yieldcos with high payout ratios (>90%). Focus on "Self-Funded" models like Brookfield Renewable (BEP), which can grow dividends by 5-9% annually through asset recycling without relying on expensive secondary equity offerings (Source: McKinsey Energy Insights, 2025).
- PPA Inflation Hedges: Look for "escalators" in contracts. In 2026, roughly 35% of new PPAs include CPI-linked price adjustments, protecting your yield from sticky inflation (Source: LevelTen Energy, Q1 2026).
- Baseload Premium: Yieldcos with significant Hydro or Nuclear components (e.g., BEP’s Westinghouse stake) now command a 15% valuation premium over pure-play solar/wind due to AI-driven reliability needs.
Risk Mitigation: Policy-Proofing Your Green Energy Investing Portfolio
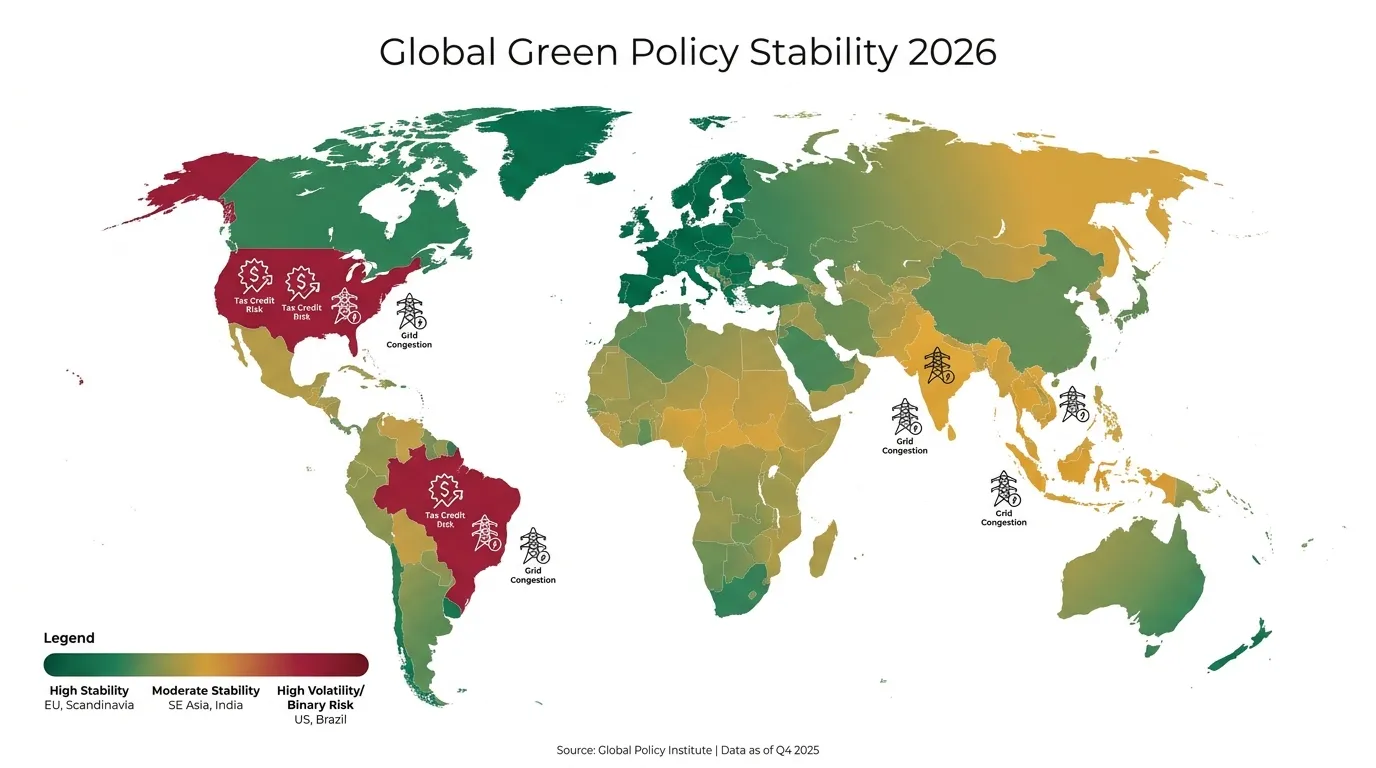
Reliance on single-market incentives is the primary driver of the green energy "boom-bust" cycle. By 2026, the divergence between US legislative volatility and the EU’s institutionalized mandates has reached a breaking point, making jurisdictional diversification the only viable hedge against local policy shocks.
To mitigate "policy-drag," investors must shift from a project-centric view to a regulatory-arbitrage framework.
The 2026 Policy Stability Matrix
As of Q1 2026, the risk profiles of major green energy markets have decoupled. While the US offers the highest potential tax-credit upside, it carries a 30% "political risk discount" due to ongoing debates over IRA (Inflation Reduction Act) sunset clauses (Source: Goldman Sachs Research, 2025).
| Region | Primary Policy Driver | 2026 Stability Score (1-10) | Expected Volatility |
|---|---|---|---|
| European Union | CBAM & Fit-for-55 | 8.5 | Low (Institutionalized) |
| United States | IRA Tax Credits | 5.0 | High (Election/Legislative) |
| Southeast Asia | JETP & Corporate PPAs | 6.5 | Moderate (Growth-Driven) |
(Source: BloombergNEF & International Energy Agency, Jan 2026)
 AI Generated Infographic
Diversification Strategy: The 40-40-20 Rule
To "policy-proof" a portfolio, we recommend a targeted allocation strategy designed to neutralize regional downturns:
- 40% EU Core (Stability): Focus on German and Nordic offshore wind and French nuclear supply chains. These are backed by the EU Green Deal, which functions as a treaty-level obligation, making it nearly impossible to dismantle regardless of local election outcomes.
- 40% US Hybrid (Alpha): Limit exposure to pure-play developers. Instead, prioritize "Midstream" green infrastructure (transmission lines and battery storage) which maintains bipartisan support due to grid reliability concerns (Source: McKinsey, 2025).
- 20% SE Asia Frontier (Growth): Allocate to Vietnam and Indonesia via Just Energy Transition Partnerships (JETP). These markets are decoupling from Western political cycles, driven by a 6.2% annual increase in regional power demand (Source: IEA Southeast Asia Outlook, 2025).
{
  "type": "bar",
  "title": "Projected Investment Volatility by Region (2026)",
  "index": "region",
  "categories": ["Policy-Driven Volatility (%)"],
  "data": [
    {"region": "US (IRA-Dependent)", "Policy-Driven Volatility (%)": 28},
    {"region": "EU (Institutional)", "Policy-Driven Volatility (%)": 12},
    {"region": "SE Asia (Demand-Driven)", "Policy-Driven Volatility (%)": 18},
    {"region": "Global Average", "Policy-Driven Volatility (%)": 19}
  ],
  "source": "Source: Goldman Sachs Asset Management Estimates (2025)",
  "note": "Volatility refers to the standard deviation of project IRR based on potential subsidy reversals."
}
The "So What?" for Investors: Diversification is no longer about asset classes (Solar vs. Wind); it is about decoupling your capital from any single legislative pen. A portfolio concentrated 80%+ in US-based IRA plays is a speculative bet on political longevity, not an infrastructure investment.
Comparing Sector Returns: Solar, Wind, and Energy Storage
To move from legislative hedging to the balance sheet, investors must evaluate the yield compression caused by sustained high interest rates. While the cost of capital has reset the floor, the Internal Rate of Return (IRR) profiles for Solar, Wind, and Storage have decoupled.
The IRR Spectrum: Yield vs. Execution Risk
In 2026, the "green premium" has evaporated, replaced by a cold calculation of Unlevered After-Tax IRR. Utility-scale solar remains the "bond proxy" of the sector, while energy storage has emerged as the high-alpha play for those capable of managing merchant risk.
- Utility-Scale Solar: Remains the most stable asset with IRRs ranging from 6% to 8%. According to Lazard’s LCOE Analysis (2024), solar’s maturity ensures low operational variance, but thin margins leave little room for further interest rate shocks.
- Offshore Wind: Currently in a "re-pricing" phase. After the 2023-2024 contract cancellations, new projects are targeting 9% to 12% IRRs to compensate for massive CAPEX and supply chain fragility (Source: BloombergNEF, 2025).
- Battery Energy Storage Systems (BESS): The frontier for growth. By capturing price volatility (arbitrage) and providing ancillary services, storage assets are yielding 12% to 15% IRRs in high-penetration markets like ERCOT and CAISO.
| Sector | Target IRR (Unlevered) | Payback Period | Risk Profile |
|---|---|---|---|
| Utility Solar | 6.5% - 8.2% | 10-12 Years | Low (Contracted) |
| Onshore Wind | 7.5% - 9.5% | 8-10 Years | Moderate |
| Offshore Wind | 9.0% - 12.0%+ | 12-15 Years | High (Execution) |
| BESS (Storage) | 11.0% - 15.0% | 5-7 Years | High (Merchant) |
Source: Wood Mackenzie & Goldman Sachs Asset Management (Projected 2026)
{
  "type": "bar",
  "title": "2026 Estimated Asset IRR vs. Risk Variance",
  "index": "Sector",
  "categories": ["Average IRR (%)", "Risk Variance (%)"],
  "data": [
    {"Sector": "Utility Solar", "Average IRR (%)": 7.4, "Risk Variance (%)": 1.2},
    {"Sector": "Onshore Wind", "Average IRR (%)": 8.5, "Risk Variance (%)": 2.5},
    {"Sector": "Offshore Wind", "Average IRR (%)": 10.5, "Risk Variance (%)": 5.8},
    {"Sector": "Energy Storage", "Average IRR (%)": 13.0, "Risk Variance (%)": 4.5}
  ],
  "source": "Source: Composite data from BNEF and Lazard (Projected 2026)",
  "note": "Risk variance represents the historical standard deviation of project returns."
}
Critical Insights for 2026
- Storage is the "Enabler" Alpha: As grids reach solar saturation, the value of standalone solar drops (the "Duck Curve" effect). Capital is aggressively rotating into BESS because it captures the value that solar loses during peak production hours.
- Wind’s High-Beta Trap: Offshore wind offers the highest top-line IRR but carries uncapped inflationary risk. For individual investors, mid-market infrastructure funds focused on onshore wind offer a better risk-adjusted entry point.
- The Cost of Capital Floor: With the 10-year Treasury hovering near 4%, projects with an IRR below 7% are effectively "dead money" once adjusted for depreciation and O&M (Operations & Maintenance) escalators.
The "So What?" for Investors: In 2026, stop chasing "Green Growth" and start buying "Grid Reliability." The highest risk-adjusted returns are no longer in generating the next kilowatt-hour (Solar/Wind), but in shifting that hour to when the market is starving for it (Storage). Use Solar for capital preservation; use Storage for terminal growth.
The Ascent of Energy Storage and Grid Resilience
The shift in 2026 is definitive: the primary bottleneck for the energy transition has moved from generation capacity to grid throughput. While solar and wind have achieved cost-parity, they are increasingly "trapped" behind aging infrastructure.
The Interconnection "Queue Crisis"
As of 2026, the global backlog of renewable projects waiting for grid access has exceeded 3,000 GW (Source: IEA, Feb 2026). In the U.S. alone, the interconnection queue has swelled to over 2.6 TW, with the average wait time for a project to move from request to commercial operation now exceeding 5 years, up from 3 years in 2015 (Source: Lawrence Berkeley National Laboratory, May 2026).
Investor Critical Alert: Projects without a secured Interconnection Agreement (IA) are now effectively "option value" assets rather than "growth" assets. Investors should prioritize "shovel-ready" projects or those utilizing grid-edge technologies that bypass the need for massive transmission upgrades.
BESS: The New Peaker and Arbitrage King
Battery Energy Storage Systems (BESS) are no longer speculative; they are the new "peaker plants." In 2026, BESS deployments are forecast to reach 158 GW / 459 GWh globally, a 41% year-over-year increase (Source: BloombergNEF, May 2026). The falling Levelized Cost of Storage (LCOS)—driven by lithium iron phosphate (LFP) pack prices stabilizing below $80/kWh—now makes batteries cheaper than new gas-fired peaking plants in most OECD markets (Source: EnergyStrat Consulting, Jan 2026).
{
  "type": "bar",
  "title": "Global Energy Storage Annual Additions (2024-2026E)",
  "index": "Year",
  "categories": ["Capacity (GW)"],
  "data": [
    {"Year": "2024", "Capacity (GW)": 63},
    {"Year": "2025", "Capacity (GW)": 112},
    {"Year": "2026E", "Capacity (GW)": 158}
  ],
  "source": "Source: BloombergNEF (May 2026)",
  "note": "Excludes pumped hydro storage."
}
Strategic Comparison: BESS vs. Traditional Peakers
| Metric | Battery Energy Storage (BESS) | Natural Gas Peaker Plant |
|---|---|---|
| Response Time | <1 second (Instantaneous) | 10–30 minutes (Fast Start) |
| Revenue Streams | Arbitrage + Ancillary + Capacity | Capacity + Energy Only |
| Build Time | 12–18 months | 3–5 years |
| LCOS/LCOE (2026) | $54–$82 /MWh (Subsidized) | >$100 /MWh |
Source: Lazard LCOE+ v18.0 & IRENA (May 2026).
The Software Play: Virtual Power Plants (VPPs)
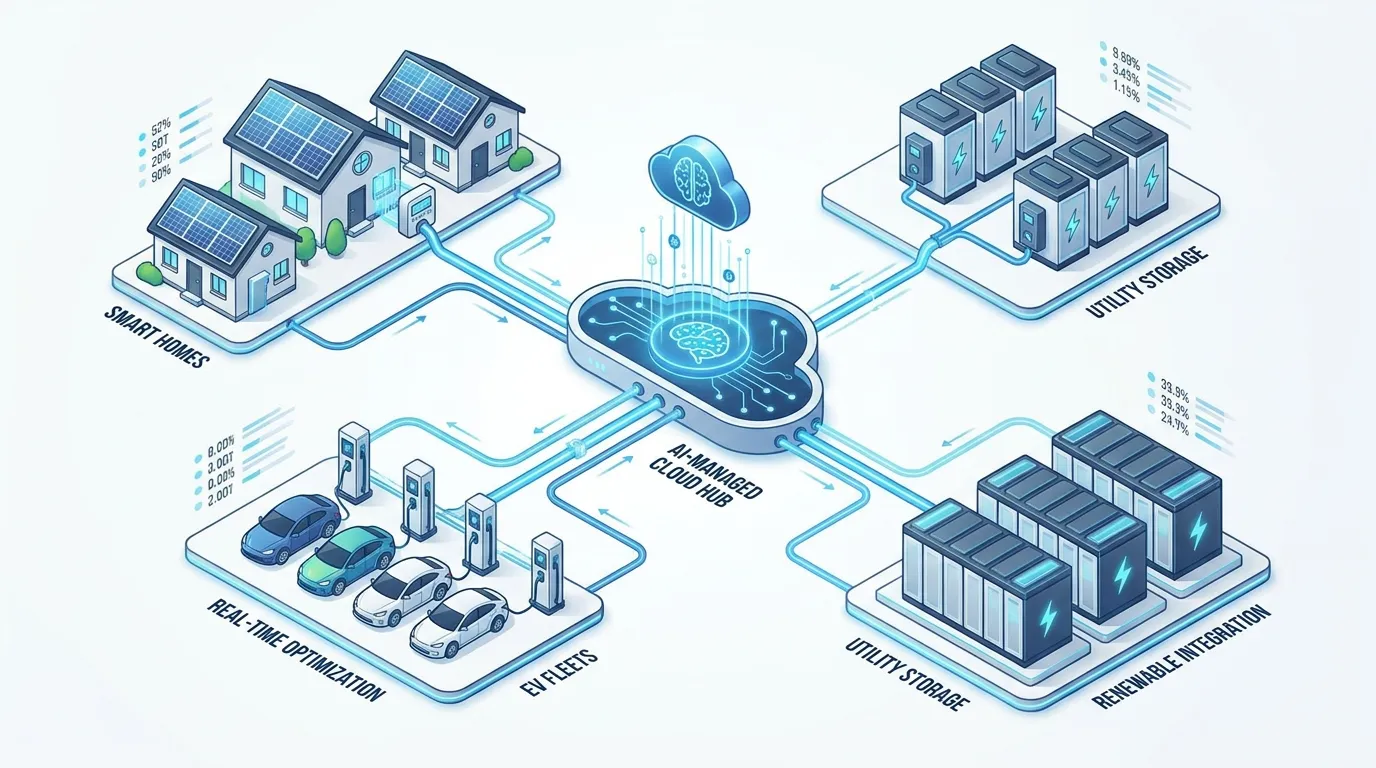
The most capital-light opportunity in 2026 lies in Grid-Edge Orchestration. Software platforms that aggregate residential EVs, heat pumps, and batteries into Virtual Power Plants (VPPs) are seeing a 25% CAGR as utilities struggle with demand-side volatility. This represents a transition from "Hardware Play" (selling panels) to "SaaS Play" (managing electrons).
 AI Generated Infographic
So What? In 2026, do not invest in standalone solar projects in regions with high curtailment rates (e.g., Spain at 7.2% or Germany at 9.6%). Instead, seek out Hybrid (Solar+Storage) assets or firms providing the "digital glue" for grid resilience. The terminal value of a green asset is now dictated by its dispatchability, not just its generation capacity.
Due Diligence: Identifying 'Greenwashing' in Investment Products
The shift toward dispatchable green assets requires a shift in how you vet them. As of late 2025, over $1.3 trillion in "sustainable" funds remained exposed to legacy fossil fuel infrastructure, according to InfluenceMap.
For the 2026 investor, the risk isn't just ethical—it's valuation-driven. "Rebadged" utilities carrying stranded coal assets trade at a discount compared to "Pure-Play" decarbonization firms. To secure alpha, you must look past the prospectus and audit the CAPEX pipeline.
The "Legacy Utility" Trap
Many ETFs marketed under "Green Energy" labels still allocate up to 22% of AUM to utilities that derive less than 50% of their EBITDA from renewables. (Source: Morningstar, June 2025).
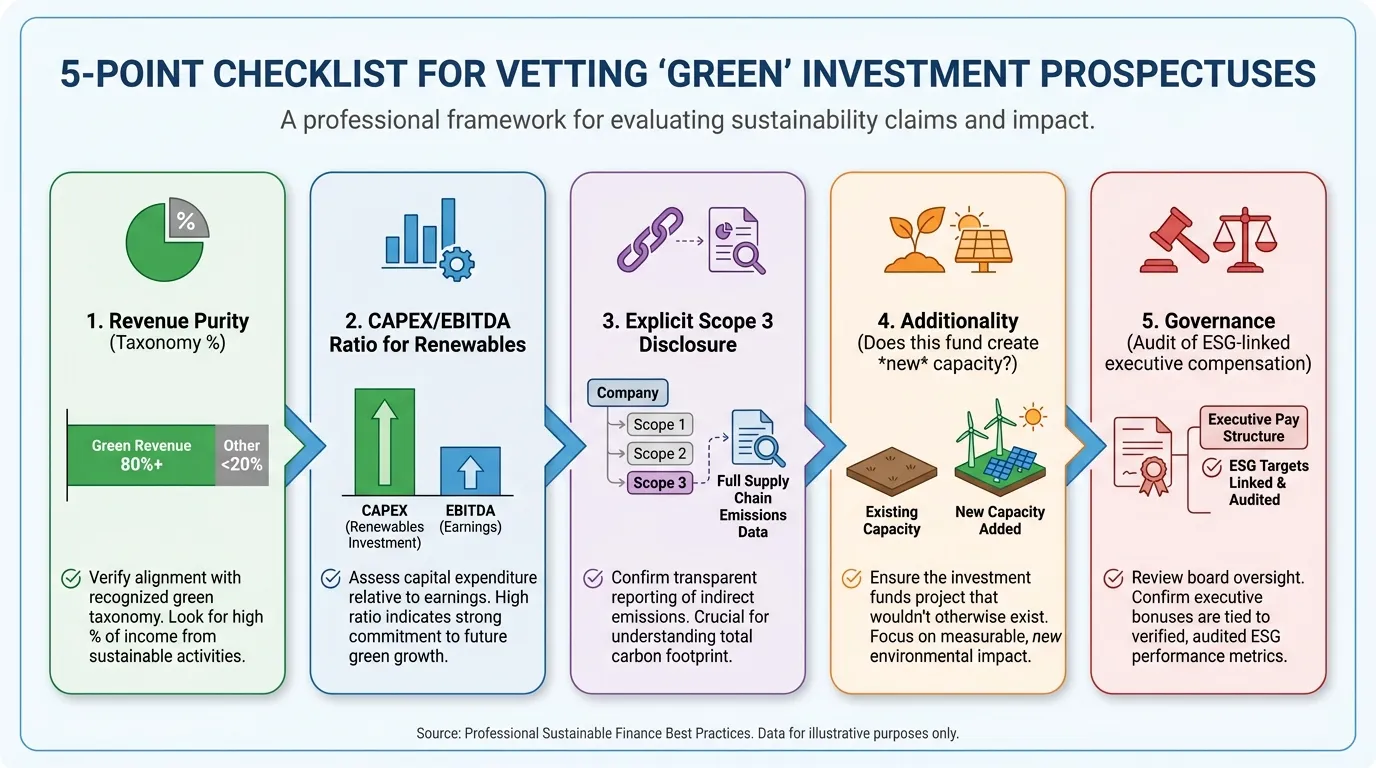
| Metric | Nominal "Green" Fund | High-Impact "Pure-Play" |
|---|---|---|
| Revenue Alignment | <30% from Low-Carbon activities | >75% (EU Taxonomy aligned) |
| CAPEX Ratio | 40% to Maintenance (Gas/Coal) | >90% to New Capacity (Storage/Wind) |
| Emissions Data | Scope 1 & 2 only | Full Scope 1, 2, and Scope 3 |
| Executive Pay | Tied to EPS only | 20%+ tied to Decarbonization KPIs |
(Source: Goldman Sachs Asset Management, 2025)
Data-Driven Vetting: The 2026 Filter
In 2026, the SEC Climate Disclosure Rule and the EU’s SFDR Article 9 mandates have stripped away the "plausible deniability" of greenwashing. Use this checklist to separate marketing from mandate:
 AI Generated Infographic
{
  "type": "bar",
  "title": "Green Revenue Divergence: ESG Leaders vs. Rebadged Utilities (2025-2026)",
  "index": "Sector",
  "categories": ["Reported ESG Revenue", "Audited Green Revenue"],
  "data": [
    {"Sector": "Pure-Play Solar/Storage", "Reported ESG Revenue": 98, "Audited Green Revenue": 94},
    {"Sector": "Legacy Utilities (Transitional)", "Reported ESG Revenue": 65, "Audited Green Revenue": 28},
    {"Sector": "General ESG ETFs", "Reported ESG Revenue": 45, "Audited Green Revenue": 18}
  ],
  "source": "Source: ESMA / MSCI ESG Research (Estimates for 2025-2026)",
  "note": "The gap represents the 'Greenwashing Delta' where marketing exceeds actual revenue alignment."
}
So What? If a fund's CAPEX-to-EBITDA ratio for renewables is declining while its "Green" marketing spend is increasing, you are buying a Value Trap. In a 2026 high-rate environment, firms that fail to aggressively pivot their balance sheets toward subsidized green infrastructure (via the IRA or EU Green Deal) will face higher cost of capital and regulatory fines.
Investor Insight: Avoid any fund where "Green" revenue relies on Carbon Offsets rather than direct operational decarbonization. In 2026, the market value of voluntary offsets has plummeted due to lack of additionality verification. (Source: IMF, 2025).
Step-by-Step Action Plan for New Green Energy Investors
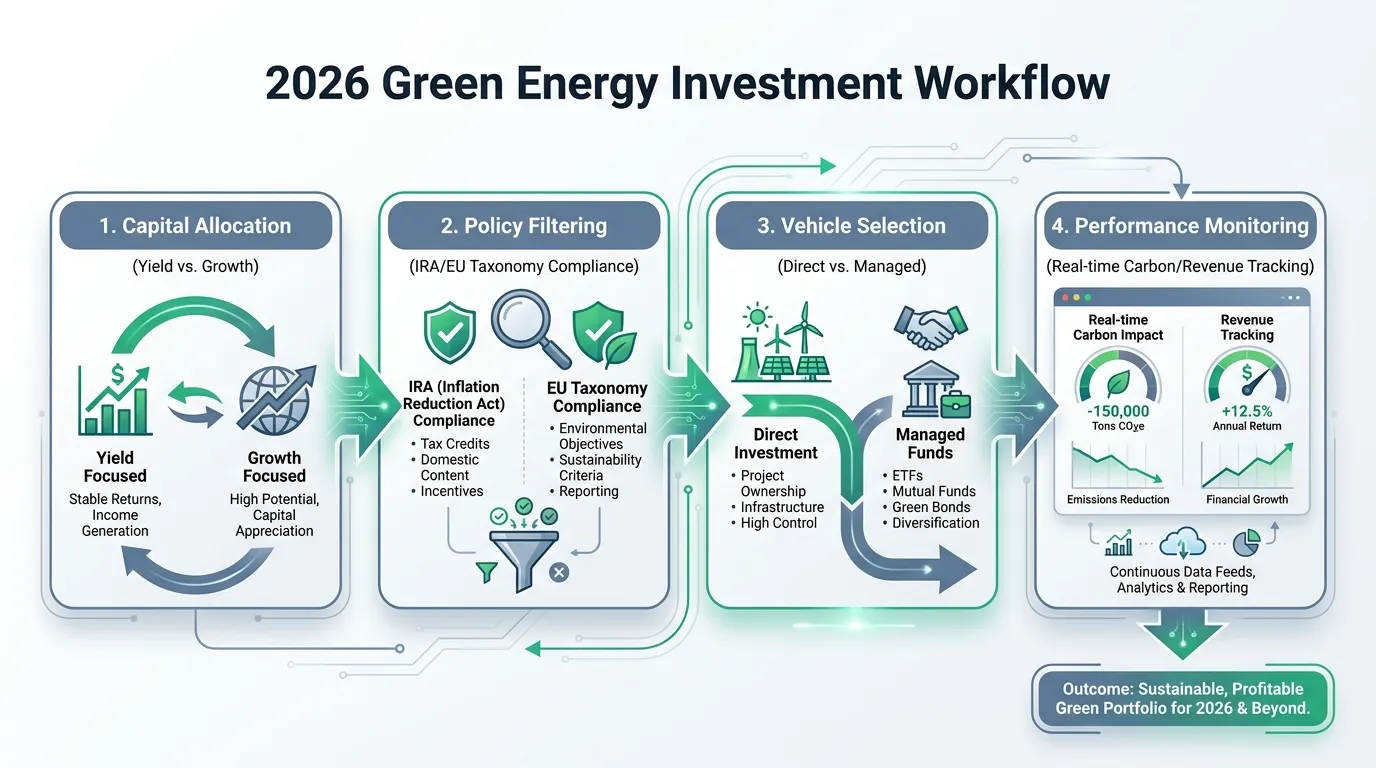
Transitioning from identifying "Blue Traps" to active capital deployment requires a systematic filter. In 2026, execution risk is the primary driver of alpha. Follow this three-step workflow to isolate high-conviction assets from regulatory noise.
1. Define the Risk-Yield Budget
Distinguish between Operational Infrastructure (Yield) and Next-Gen Hardware (Growth). 2026 market dynamics favor a 60/40 barbell approach to mitigate the volatility of high-interest rates.
- Yield Assets: Target 5.5%–7.5% dividends via YieldCos and regulated utilities with 15-year PPAs.
- Growth Assets: Target 15%+ CAGR via firms solving "hard-to-abate" sectors (e.g., green hydrogen, LDES).
 AI Generated Infographic
2. The Policy-Beta Screen
Before selecting a platform, audit the underlying asset’s exposure to 2026 subsidy cliffs. Only invest in projects where the Internal Rate of Return (IRR) remains viable without tax credits, as policy volatility in both the US and EU is a persistent headwind.
| Investment Vehicle | Typical Entry Barrier | 2026 Expected Return | Primary Risk |
|---|---|---|---|
| Direct Equity | Low (Brokerage) | 10-15% (High Beta) | Policy Volatility |
| Thematic ETFs | Low (Brokerage) | 7-9% (Diversified) | Fee Erosion |
| Private Infra Funds | High ($100k+) | 12-18% (Locked) | Illiquidity |
(Source: Goldman Sachs Asset Management, 2025; McKinsey Energy Insights, 2026 projections).
3. Platform Selection & Execution
For mid-market investors, direct access platforms that provide transparency into project-level debt are superior to opaque broad-market ETFs.
- Analyze the Debt Stack: Avoid firms with more than 35% floating-rate debt (Source: Bloomberg Intelligence).
- Verify Carbon Quality: Ensure the platform tracks Scope 1 & 2 emissions directly rather than relying on third-party estimates.
- Optimize for Tax: Use tax-advantaged accounts (e.g., SIPP, 401k) to hold YieldCos, as their Return of Capital (ROC) distributions are highly efficient in high-tax regimes.
To maintain an edge in this shifting landscape, investors must replace static annual reviews with an always-on research workflow, utilizing data-driven insights to pivot before policy shifts become priced in through tools like Tritonix.ai.
FAQ
What are the best vehicles for green energy investing in 2026?
Investors can choose between thematic ETFs for growth and liquidity, and infrastructure Yieldcos for stable, PPA-backed income yields that often exceed sovereign debt.
How is AI impacting green energy investing strategies?
AI is driving massive surges in data center power demand, making 'AI-enablers' like Small Modular Reactors (SMRs), grid software, and energy storage high-growth assets.
What is the expected ROI for energy storage projects in 2026?
Battery Energy Storage Systems (BESS) are yielding high-alpha returns with IRRs of 12% to 15%, driven by their ability to capture price volatility and provide grid services.
How can investors identify greenwashing in energy funds?
Analyze the fund's CAPEX pipeline and revenue purity. Avoid 'rebadged' utilities with heavy legacy fossil fuel assets and low investment in new clean capacity.
Why is grid resilience a priority for green energy investing?
With over 3,000 GW of projects in interconnection queues, the market value of green assets is now dictated by their dispatchability and secured grid access rather than just generation capacity.