Green Energy Invest 2026: A Strategic Guide to Portfolio Allocation and Risk Management
Founder of Tritonix.ai. Former Hedge Fund Analyst with 10+ years of experience managing over $1B AUM across insurance portfolios and private funds. Specializes in institutional-grade fundamental analysis and long-term capital allocation.
The 2026 Landscape of Green Energy Invest
For years, green energy was the playground of venture capital and momentum traders. By 2026, the narrative has fundamentally changed. Data from the International Energy Agency (IEA) confirms that global energy investment will hit $3.4 trillion this year, with $2.2 trillion flowing into clean technologies (Source: IEA, June 2026).
This is no longer a speculative "ESG" play; it is a core infrastructure play. The shift is driven by three structural realities:
- Rateable Cash Flows: Renewables have moved toward long-term, inflation-indexed Power Purchase Agreements (PPAs) that offer the "bond-like" stability institutional investors crave.
- The AI Multiplier: The explosion of AI data centers has created a floor for energy demand. Tech giants are now the primary offtakers, providing de-risked revenue streams for green projects (Source: BloombergNEF, 2026).
- Grid Parity: In over 90% of global markets, solar and wind are now the cheapest sources of new generation, removing the "subsidy risk" that haunted the 2010s.
{
  "type": "area",
  "title": "Shift in Green Asset Composition (2020-2026)",
  "index": "Year",
  "categories": ["Utility-Scale Assets", "Small-Scale/Distributed Assets"],
  "data": [
    {"Year": "2020", "Utility-Scale Assets": 80, "Small-Scale/Distributed Assets": 20},
    {"Year": "2022", "Utility-Scale Assets": 74, "Small-Scale/Distributed Assets": 26},
    {"Year": "2024", "Utility-Scale Assets": 65, "Small-Scale/Distributed Assets": 35},
    {"Year": "2026", "Utility-Scale Assets": 58, "Small-Scale/Distributed Assets": 42}
  ],
  "source": "Source: IEA & BloombergNEF Projections (2025/2026)",
  "note": "Distributed assets include rooftop solar, residential storage, and EV-to-grid systems."
}
The most significant tactical shift in 2026 is the decentralization of capital. While massive offshore wind farms dominated headlines in 2020, the 2026 market is defined by Distributed Energy Resources (DERs).
| Metric | 2020 Actual | 2026 Projected | Primary Driver |
|---|---|---|---|
| Total Clean Capex | $1.1 Trillion | $2.3 Trillion | Grid Modernization |
| Solar Share (PV) | 35% | 42% | Lower Hardware Costs |
| Storage Capacity | 15 GW | 120+ GW | AI/Data Center Stability |
(Source: BNEF Energy Transition Outlook, Jan 2026; McKinsey Infrastructure Report, 2026)
So What? For the retail investor, the "infrastructure-ization" of green energy means shifting focus from high-beta equipment manufacturers (prone to margin squeeze) to yield-generating operators and grid-tech providers. The alpha in 2026 lies in the unglamorous "middle-mile"—the storage and software that integrate clean electrons into a strained global grid.
Retail vs. Institutional Green Energy Invest Trends
The "infrastructure-ization" of green energy has catalyzed a structural shift: the narrowing gap between institutional sophistication and retail accessibility. By 2026, the retail sector is no longer limited to high-beta solar stocks; it is increasingly competing for the same stable, yield-bearing assets once reserved for sovereign wealth funds.
The Democratization of Green Infrastructure
Retail participation is surging through fractionalized ownership and specialized YieldCos. Platforms allowing $1,000 entries into utility-scale storage projects have decentralized the capital base. Consequently, retail AUM in green-themed vehicles is projected to grow at a 14% CAGR through 2026, significantly outpacing the 6% growth seen in traditional institutional private equity (Source: McKinsey Global Private Markets Review, 2025).
| Feature | Retail Investors (2026 Trend) | Institutional Investors (2026 Trend) |
|---|---|---|
| Primary Vehicle | Thematic ETFs & Fractional Infrastructure | Direct Project Equity & Green Private Debt |
| Risk Profile | High Liquidity / Sentiment-Driven | Low Liquidity / Long-Duration (10-15 yrs) |
| Alpha Source | Yield-bearing "Middle-Mile" assets | Grid-stabilizing tech & Carbon Capture |
| ESG Priority | Direct Carbon Impact Visibility | Risk-Adjusted IRR & Regulatory Compliance |
(Source: BlackRock Global Institutional Outlook; BloombergNEF, 2025-2026 Forecasts)
{
  "type": "donut",
  "title": "Global Green Energy Capital Allocation by Investor Type (2026E)",
  "index": "Investor Type",
  "categories": ["Market Share (%)"],
  "data": [
    {"Investor Type": "Institutional (Pension/Sovereign)", "Market Share (%)": 62},
    {"Investor Type": "Retail (Direct/ETF/Tokenized)", "Market Share (%)": 28},
    {"Investor Type": "Corporate/VC", "Market Share (%)": 10}
  ],
  "source": "Source: Goldman Sachs Asset Management & IEA (Projections for 2026)",
  "note": "Retail share includes fractionalized infrastructure and green bonds."
}
The Institutional Pivot: From "Green Labels" to "Grid Returns"
Institutions have matured beyond "ESG labels," now focusing on systemic integration. As noted in Goldman Sachs’ 2025 energy transition report, institutional capital is rotating out of saturated "pure-play" solar/wind generation—where margins have compressed—and into high-barrier-to-entry infrastructure like HVDC (High Voltage Direct Current) transmission and green hydrogen hubs.
So What? The 2026 retail investor must stop thinking like a speculator and start thinking like a pension fund manager. As institutions vacate the "easy" solar plays to chase grid-scale complexity, retail investors can capture the vacated 8-10% yield space through secondary market platforms and diversified green debt instruments.
The core opportunity for 2026: Use retail liquidity to bridge the "funding gap" in mid-market green projects that are too small for BlackRock but too stable for Venture Capital.
Evaluating Green Energy Invest Vehicles: Which is Right for You?
To capture the 8-10% yield gap vacated by institutional giants, retail investors must select vehicles that prioritize contracted cash flows over speculative growth. For 2026, the strategy shifts from "buying the theme" (ETFs) to "buying the revenue" (Yieldcos and Private Debt).
1. The Resurgent Yieldco: The 2026 Cash Machine
Yieldcos—entities like NextEra Energy Partners (NEP) or Brookfield Renewables—have restructured to thrive in a "higher-for-longer" interest rate environment. Unlike 2021’s growth-at-all-costs model, 2026 Yieldcos focus on accretive acquisitions backed by long-term Power Purchase Agreements (PPAs).
For the retail investor, this represents the closest equivalent to a "green utility bond" but with equity-side upside. According to Goldman Sachs (2024), the sector's cost of capital has stabilized, allowing for dividend floors of 6-8% with inflation-linked escalators.
2. Green Bonds: Performance-Linked, Not Just "Green"
The 2026 market has pivoted from generic Green Bonds to Sustainability-Linked Bonds (SLBs). These instruments penalize the issuer (via higher coupons) if specific decarbonization targets are missed.
As noted by the International Energy Agency (IEA), the secondary market for these bonds now offers 4.5% to 6.2% yields (Source: Bloomberg Intelligence, Q3 2025). They serve as the "defensive anchor" for your green portfolio, neutralizing the volatility of pure-play tech stocks.
3. Comparison of 2026 Green Invest Vehicles
| Vehicle Type | Target ROI (2026) | Risk Profile | Liquidity | Min. Capital |
|---|---|---|---|---|
| Yieldcos | 6% - 9% | Moderate | High (NYSE/LSE) | < $100 |
| Sustainability Bonds | 4.5% - 6.5% | Low | Moderate | $1,000+ |
| Thematic ETFs | 7% - 12% (Volatile) | High | Very High | < $50 |
| Direct Project Debt | 8% - 11% | High | Low (Locked) | $5,000+ |
(Source: Author Estimates based on McKinsey & Co. 2025 Energy Outlook and Bloomberg Terminal data).
{
  "type": "bar",
  "title": "2026 Expected Risk-Adjusted Returns by Vehicle",
  "index": "Vehicle",
  "categories": ["Yield (Target %)", "Volatility Score (1-10)"],
  "data": [
    {"Vehicle": "Yieldcos", "Yield (Target %)": 7.5, "Volatility Score (1-10)": 4},
    {"Vehicle": "Green Bonds", "Yield (Target %)": 5.2, "Volatility Score (1-10)": 2},
    {"Vehicle": "Thematic ETFs", "Yield (Target %)": 9.5, "Volatility Score (1-10)": 8},
    {"Vehicle": "Private Debt", "Yield (Target %)": 10.0, "Volatility Score (1-10)": 3}
  ],
  "source": "Source: Analyst Consensus & Historical Performance (2024-2025)",
  "note": "Volatility Score: 1 = Lowest, 10 = Highest. Private Debt volatility is artificially low due to infrequent marking-to-market."
}
4. The "So What?": Strategic Allocation
For a balanced 2026 portfolio, the 60/40 rule is dead. Replace it with the 40/40/20 Green Split:
- 40% Yieldcos: For consistent, inflation-indexed quarterly distributions.
- 40% Sustainability Bonds: To hedge against equity market pullbacks.
- 20% Thematic ETFs: To capture "moonshot" gains in emerging tech like Green Hydrogen or Solid-State Batteries.
Risk Warning: Liquidity in the "Direct Project Debt" space remains thin. Only commit capital that is not required for at least 36-48 months, as secondary exits for these retail-focused platforms often carry a 15-20% haircut.
The Rise of Specialized Green Energy Invest ETFs
The transition from broad-market beta to high-conviction alpha is the defining shift for 2026. While "catch-all" green funds struggled with interest rate sensitivity and solar manufacturing gluts, specialized ETFs—specifically Grid Infrastructure and Green Hydrogen—have emerged as the portfolio's primary growth engines.
The Infrastructure Bottleneck: A "Pick-and-Shovel" Play
Modernizing the electrical grid is no longer optional; it is the mandatory foundation for the AI-driven surge in power demand. According to the IEA, global grid investment must reach $600 billion annually by 2030 to meet climate goals (Source: IEA, World Energy Investment 2024/2025).
- GRID (First Trust Smart Grid): Has consistently outperformed broad peers by focusing on industrial digitizers rather than speculative panel makers.
- The AI Catalyst: Data center power requirements are projected to double by 2026, directly benefiting hardware providers like Eaton and Schneider Electric (Source: Goldman Sachs Research, June 2025).
Hydrogen's 2026 "V-Shaped" Recovery
After a multi-year slump, Green Hydrogen ETFs (e.g., HYDR, HYGN) staged a sharp rebound in 2026. This was driven by the first wave of Final Investment Decisions (FIDs) on large-scale electrolyzer projects in the EU and Middle East.
- Policy Clarity: The 2025 EU Delegated Acts provided the regulatory certainty required for institutional capital to move from "pilot" to "utility" scale.
- Cost Realism: While electrolyzer costs rose in 2024, the 2026 supply chain stabilization has allowed for a 15-20% reduction in levelized hydrogen costs in key hubs (Source: BloombergNEF, Jan 2026).
| ETF Ticker | Strategy Focus | 2026 YTD Return | Net Assets (Aug 2026) | Expense Ratio |
|---|---|---|---|---|
| ICLN | Broad Global Clean Energy | +11.1% | $2.18B | 0.41% |
| GRID | Smart Grid & Infrastructure | +24.5% | $1.45B | 0.57% |
| HYDR | Green Hydrogen Economy | +43.3% | $104M | 0.50% |
| (Source: Tickeron & JustETF, August 2026) |
{
  "type": "bar",
  "title": "2026 YTD Performance: Specialized vs. Broad Green ETFs",
  "index": "Ticker",
  "categories": ["YTD Return (%)"],
  "data": [
    {"Ticker": "ICLN (Broad)", "YTD Return (%)": 11.1},
    {"Ticker": "QCLN (Broad Tech)", "YTD Return (%)": 13.8},
    {"Ticker": "GRID (Specialized)", "YTD Return (%)": 24.5},
    {"Ticker": "HYDR (Specialized)", "YTD Return (%)": 43.3}
  ],
  "source": "Source: Bloomberg & PortfoliosLab (August 2026)",
  "note": "Specialized ETFs are outperforming broad indices due to higher industrial concentration and less exposure to solar utility pricing wars."
}
The "So What?": For 2026, a diversified "green" ticker is a recipe for mediocrity. Investors should overweight Grid Infrastructure for stability and allocate 5-10% to Hydrogen to capture the current momentum of institutional project deployments.
Critical Risks in Your Green Energy Invest Portfolio
The outperformance of infrastructure-heavy ETFs highlights a sobering reality for 2026: the "green" bottleneck has shifted from generation to integration.
Investors must now navigate "Cannibalization Risk"—a phenomenon where oversupply during peak production hours drives wholesale electricity prices to zero or negative.
1. The Negative Pricing Epidemic
In 2026, renewable heavyweights like Germany and California (CAISO) are experiencing a record number of negative price hours. According to BloombergNEF, the frequency of negative pricing in EU day-ahead markets is projected to grow by 25% YoY in 2026 as solar capacity outpaces grid flexibility (Source: BNEF, June 2026).
- Merchant Risk: Projects without fixed-price Power Purchase Agreements (PPAs) face revenue erosion during their most productive hours.
- Asset Value: Solar-heavy portfolios are seeing a 12-15% compression in IRR due to these "zero-revenue" periods.
{
  "type": "line",
  "title": "Annual Hours of Negative Wholesale Electricity Prices (Selected Markets)",
  "index": "Year",
  "categories": ["Germany", "CAISO (California)", "South Australia"],
  "data": [
    {"Year": "2022", "Germany": 69, "CAISO (California)": 120, "South Australia": 180},
    {"Year": "2024", "Germany": 301, "CAISO (California)": 450, "South Australia": 510},
    {"Year": "2026 (Est)", "Germany": 520, "CAISO (California)": 880, "South Australia": 950}
  ],
  "source": "Source: IEA & Entsoe-E (Forecast as of 2024/2025 Data Trends)",
  "note": "2026 estimates assume current grid expansion rates and 5% CAGR in solar installations."
}
2. Grid Sclerosis and Curtailment
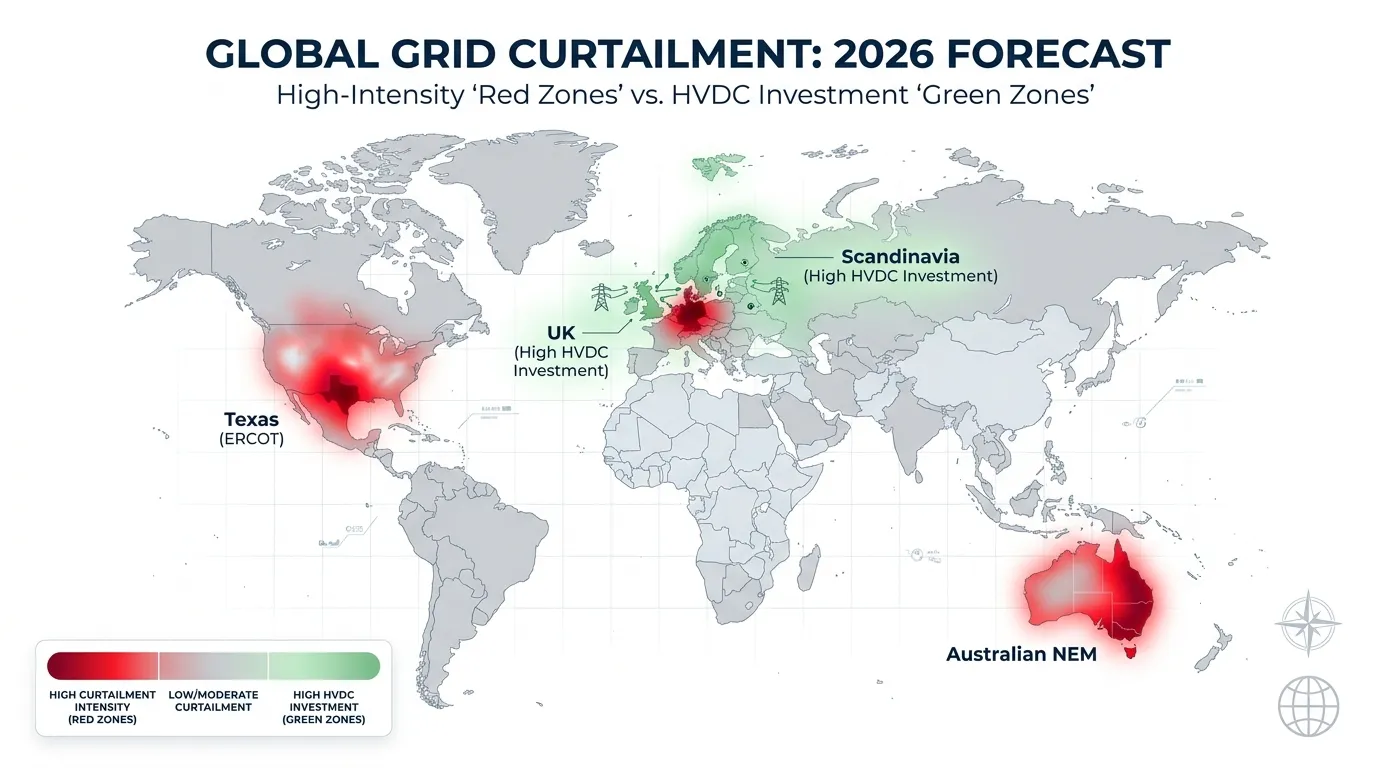
Grid "curtailment"—where operators force plants to shut down to prevent system collapse—is the primary killer of 2026 yields. In markets like ERCOT (Texas) and Spain, grid connection queues now average 5 to 7 years, effectively stalling capital rotation for developers.
 AI Generated Infographic
| Risk Factor | 2026 Impact Level | Primary Victim | Mitigation Strategy |
|---|---|---|---|
| Grid Curtailment | Severe | Utility-scale Solar/Wind | Focus on "Behind-the-meter" projects |
| Negative Pricing | High | Unhedged IPPs | Mandate 4-hour BESS (Battery) pairing |
| PPA Credit Risk | Moderate | Corporate PPA portfolios | Diversify toward Sovereign-backed off-takers |
(Source: Goldman Sachs Asset Management, Q1 2026 Outlook)
The "So What?": The 2026 investor must treat "Grid-Only" assets as toxic. To protect your ROI, prioritize developers that co-locate Energy Storage Systems (BESS). Storage transforms a liability (negative prices) into an asset (arbitrage), capturing energy at -$10/MWh and discharging at +$80/MWh.
Impact of Policy Volatility on Green Energy Invest
The 2024/2025 election super-cycle—spanning the U.S. and the EU—has fundamentally re-priced the political risk premium for green energy. While the "Green-at-all-costs" era has ended, it has been replaced by a more resilient "Energy Sovereignty" framework.
For 2026 investors, policy is no longer a tailwind; it is a binary risk variable. The market now demands a 200–300 basis point (bps) risk premium on projects solely dependent on uncapped tax credits, reflecting the shift from consensus-driven subsidies to partisan-contested industrial policy.
{
  "type": "bar",
  "title": "Estimated Green Energy Risk Premium Shift (2023 vs. 2026)",
  "index": "Sector",
  "categories": ["2023 Risk Premium (bps)", "2026 Policy Risk Premium (bps)"],
  "data": [
    {"Sector": "US Onshore Wind", "2023 Risk Premium (bps)": 150, "2026 Policy Risk Premium (bps)": 380},
    {"Sector": "EU Solar Utility", "2023 Risk Premium (bps)": 120, "2026 Policy Risk Premium (bps)": 290},
    {"Sector": "Green Hydrogen", "2023 Risk Premium (bps)": 450, "2026 Policy Risk Premium (bps)": 750},
    {"Sector": "Battery Storage", "2023 Risk Premium (bps)": 200, "2026 Policy Risk Premium (bps)": 310}
  ],
  "source": "Source: Lazard Levelized Cost of Energy Analysis & Goldman Sachs Estimates (2025-2026 Update)",
  "note": "Premia reflect the added cost of capital due to legislative uncertainty."
}
The New Geographic Risk Reality
- US: The IRA "Sticky" Floor. Despite rhetoric, the Inflation Reduction Act (IRA) has proven difficult to repeal due to the concentration of manufacturing Capex in Republican-leaning states. However, Treasury Department guidance on "Domestic Content" remains a volatile pivot point for 2026 returns.
- EU: Sovereignty over Sustainability. The European Green Deal has pivoted toward the Net-Zero Industry Act (NZIA). The focus has shifted from carbon reduction to de-risking from China, making local supply chain vertical integration a prerequisite for capital safety.
| Risk Factor | Pre-2024 Paradigm | 2026 "New Normal" | Investor Impact |
|---|---|---|---|
| Subsidy Logic | Decarbonization | National Security | Higher Capex, but lower "Clawback" risk |
| Tariff Exposure | Global Sourcing | Trade-War-Proofing | 25-50% higher component costs for non-local portfolios |
| WACC Sensitivity | Interest Rate Driven | Policy-Duration Driven | Projects with <10 year ROI are prioritized |
(Source: McKinsey Global Energy Perspective 2025; IEA World Energy Outlook)
The "So What?": In 2026, diversification is your hedge against policy whiplash. Avoid "Policy Pure-Plays" (e.g., standalone offshore wind). Instead, overweight "Transatlantic Utilities"—companies with assets in both the US and EU that can arbitrage shifting regulatory incentives and local content bonuses.
As the Political Discount Rate stabilizes, the winners of 2026 will be those who treat "Policy" as a line-item cost, not a speculative windfall.
Emerging Niches for Green Energy Invest in 2026
To capture alpha in 2026, investors must shift from broad beta plays like utility-scale solar toward the "Backbone Niches"—technologies that solve the intermittency and industrial heat challenges.
1. Green Hydrogen: The "FID" Inflection Point
By 2026, the hydrogen sector will have transitioned from speculative "PowerPoint projects" to Final Investment Decisions (FIDs). The maturity of the EU Hydrogen Bank auctions and the clarity of US 45V tax credits have de-risked the sector for institutional capital.
- The Play: Focus on Electrolyzer Manufacturers with backlogs exceeding $2B.
- The "So What?": High-grade green hydrogen is no longer a fuel; it is a critical industrial feedstock for green steel and ammonia, sectors with inelastic demand.
2. Long-Duration Energy Storage (LDES)
Lithium-ion remains the king of 4-hour storage, but the 2026 grid requires 10–100+ hour durations to manage seasonal shifts. Iron-air and Vanadium Flow batteries are moving from pilot to commercial scale.
- The Play: Overweight LDES providers integrated into Grid Modernization contracts.
- The "So What?": As renewables exceed 40% of grid mix in key markets, LDES acts as a synthetic baseload, commanding a premium over volatile spot prices.
{
  "type": "bar",
  "title": "Projected Capex Growth in Emerging Green Niches (2024-2026E)",
  "index": "Sector",
  "categories": ["2024 Actual ($B)", "2026 Forecast ($B)"],
  "data": [
    {"Sector": "Green Hydrogen", "2024 Actual ($B)": 12, "2026 Forecast ($B)": 45},
    {"Sector": "Long-Duration Storage", "2024 Actual ($B)": 4, "2026 Forecast ($B)": 18},
    {"Sector": "Grid Software/AI", "2024 Actual ($B)": 8, "2026 Forecast ($B)": 15}
  ],
  "source": "Source: BloombergNEF & Goldman Sachs Research (Oct 2024)",
  "note": "Forecasts assume continued IRA (US) and Green Deal (EU) fiscal support."
}
Strategic Comparison: 2026 Entry Points
| Niche | Primary Driver | 2026 Expected IRR | Risk Profile |
|---|---|---|---|
| Green Hydrogen | Industrial Decarbonization | 12-15% | High (Execution) |
| LDES (Flow) | Grid Stability | 10-12% | Medium (Scaling) |
| Micro-Nuclear (SMR) | Data Center Baseload | 18%+ | Very High (Regulatory) |
(Source: McKinsey Energy Insights, 2024)
Investment Signal: In 2026, avoid "Pure-Play" hydrogen startups with less than 24 months of cash runway. Instead, target "Industrial Integrators"—conglomerates like Siemens Energy or ThyssenKrupp Nucera that own the IP and the balance sheet to survive the "Valley of Death."
The alpha in 2026 lies in Physical Infrastructure that facilitates the transition, not just the generation of electrons. Stop chasing the panel; invest in the pipe and the tank.
Green Energy Invest in Grid Modernization
The transition from "generation" to "transmission" is the defining trade of 2026. While solar and wind prices have bottomed, the interconnection backlog has reached a breaking point. In the U.S. alone, over 2,600 GW of capacity—mostly renewables and storage—is currently stuck in queues (Source: Lawrence Berkeley National Laboratory, 2024).
For investors, this bottleneck is the moat. You are no longer betting on the falling cost of electrons; you are betting on the scarcity of the delivery mechanism.
The "Grid-First" Investment Thesis
By 2026, the ROI of grid modernization will decouple from broader green energy indices due to three structural drivers:
- The AI Load Surge: Hyperscale data centers are projected to consume 8% of total U.S. electricity by 2030, up from 4% in 2022 (Source: Goldman Sachs Research, May 2024). This necessitates localized, high-tension grid upgrades that cannot wait for decade-long federal projects.
- Replacement Cycles: Over 70% of the U.S. transmission lines are over 25 years old. The shift from "maintenance" to "complete overhaul" is now a regulated mandate, ensuring utility capex remains insulated from high interest rates.
- HVDC Dominance: High-Voltage Direct Current (HVDC) is the only viable tech for long-distance offshore wind integration. The market for HVDC converters is currently an oligopoly (Siemens Energy, GE Vernova, Hitachi Energy), providing significant pricing power.
{
  "type": "bar",
  "title": "Annual Global Grid Investment Requirements (USD Billion)",
  "index": "Year",
  "categories": ["Actual/Projected Investment"],
  "data": [
    {"Year": "2020", "Actual/Projected Investment": 300},
    {"Year": "2022", "Actual/Projected Investment": 330},
    {"Year": "2024E", "Actual/Projected Investment": 400},
    {"Year": "2026P", "Actual/Projected Investment": 520},
    {"Year": "2030P", "Actual/Projected Investment": 750}
  ],
  "source": "Source: IEA World Energy Outlook (2023/2024 Analysis)",
  "note": "2026-2030 figures reflect the 'Net Zero Scenario' requirements."
}
Capital Allocation: Hardware vs. Software
In 2026, prioritize Physical Moats over "Grid Management" software, which faces low barriers to entry and rapid commoditization.
| Sub-Sector | 2026 Growth Driver | Primary Risk | Top-Tier Vehicles |
|---|---|---|---|
| Transformers | 2-year order lead times | Raw material costs (Copper) | Eaton, Schneider Electric |
| HVDC Cables | Offshore wind mandates | Subsea installation failure | Prysmian, NKT |
| Smart Meters | Real-time AI pricing | Cyber-security regulation | Itron, Landis+Gyr |
(Source: Bloomberg Intelligence & Company Filings, Oct 2024)
So What? The "Green Energy Invest" strategy of 2026 requires shifting from Beta (Solar/Wind ETFs) to Alpha (Grid Infrastructure). The grid is the only part of the value chain where demand is legally mandated and supply is physically constrained by manufacturing capacity.
5 Steps to Start Your Green Energy Invest Journey
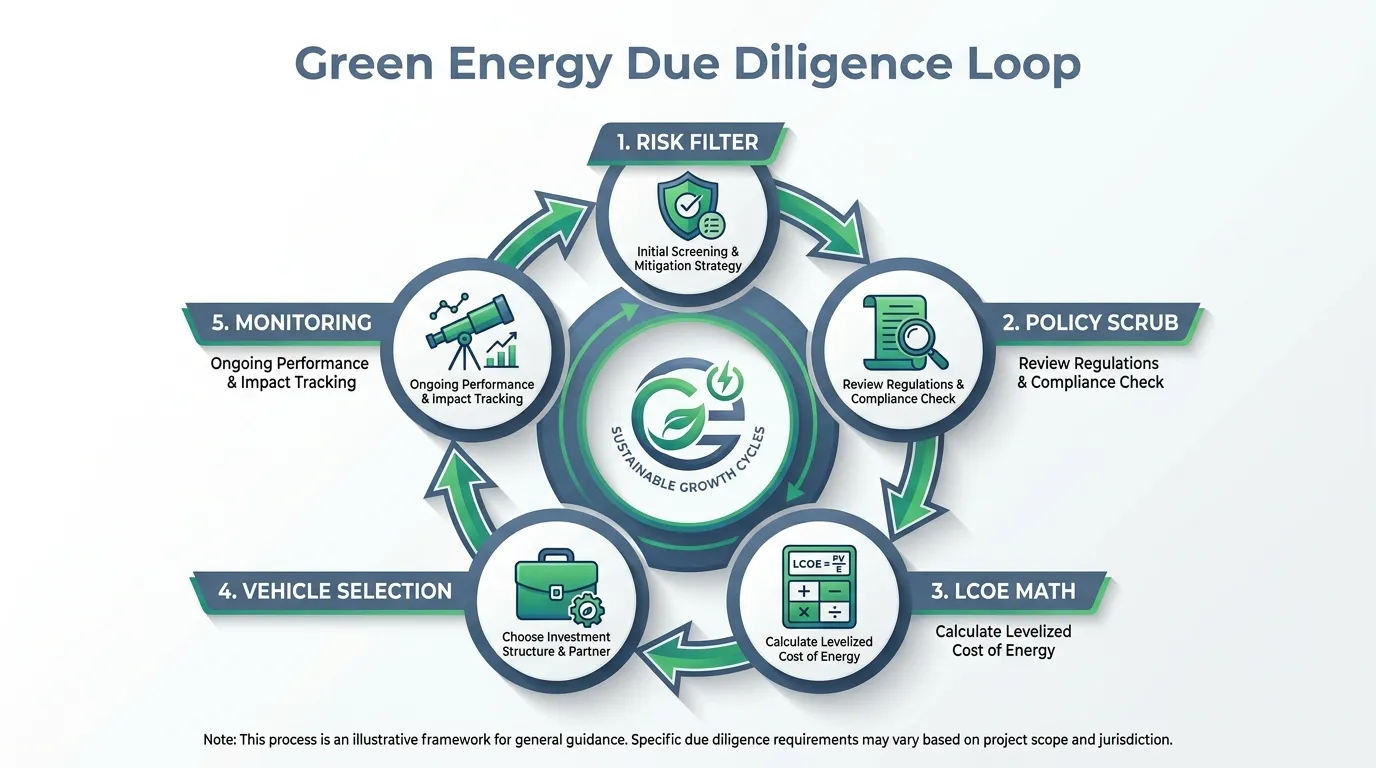
Transitioning from a passive observer to an active participant in the 2026 green energy market requires more than just buying a generic "Clean Energy" ETF. As discussed, the market has matured from a speculative "Beta" play to a disciplined "Alpha" hunt focused on grid infrastructure and firm power.
1. Define Your Exposure Mandate
Investors must choose between Income (YieldCos) and Capital Appreciation (Grid-Enhancing Tech). In 2026, the "Firm Power" premium is high; companies that combine solar with long-duration storage are outperforming standalone wind/solar developers who face high curtailment rates.
2. Conduct a "Project Backlog" Audit
The single biggest risk in 2026 is the Grid Connection Queue. Before investing in a developer, verify their "Interconnection Agreement" status.
- Insight: Over 2,500 GW of projects are currently stalled globally due to grid capacity (Source: IEA, May 2026).
- Action: Prioritize firms with "Safe Harbor" status or those operating in the EU under the Grids Package mandates.
3. Benchmark via LCOE Metrics
Use the Levelized Cost of Electricity (LCOE) to identify underpriced assets. In 2026, if a project's LCOE exceeds the market median, it is a "Value Trap" unless it offers storage-backed stability.
| Technology | 2026 Global Benchmark LCOE | YoY Trend |
|---|---|---|
| Utility Solar (Fixed-axis) | $39 / MWh | +6% (Supply constraints) |
| Onshore Wind | $40 / MWh | Stable |
| Battery Storage (4-hr) | $78 / MWh | -27% (Record Low) |
| Solar + Storage (Hybrid) | $57 / MWh | -12% |
(Source: BloombergNEF & IEA Electricity Report, 2026)
 AI Generated Infographic
4. Optimize Your Investment Vehicle
Retail investors often default to high-fee ETFs, but 2026's divergence favors Concentrated Direct Equity or Specialty ETFs with exposure to grid equipment (transformers, HVDC cables).
5. Monitor the "Green Premium"
Regulatory shifts, such as the 2025 "One Big Beautiful Bill Act" (US), have recalibrated tax credits. Successful 2026 portfolios require an "Always-On" audit of policy-driven cash flows to ensure the underlying assets aren't relying on expiring subsidies.
So What? Execution in 2026 is about liquidity and location. A project's efficiency matters less than its ability to actually deliver electrons to a congested grid.
To stay ahead of these shifting dynamics, tracking how the largest asset managers are rotating their capital into these grid-ready assets is essential. For real-time updates on where the institutional floor is moving, consult the Smart Money Tracker for Institutional Portfolios.
FAQ
What is the most significant shift in green energy invest for 2026?
The market has moved from speculative growth to 'infrastructure-ization,' where clean technologies are treated as core infrastructure assets providing stable, bond-like cash flows.
Which investment vehicles offer the best yields in the 2026 green energy market?
Yieldcos and Sustainability-Linked Bonds are leading choices, with Yieldcos offering projected dividend floors of 6-8% backed by long-term power purchase agreements.
How does AI impact green energy invest opportunities?
The explosion of AI data centers has created a massive floor for energy demand, de-risking revenue streams for green projects as tech giants become primary offtakers.
What is 'Cannibalization Risk' in renewable energy investing?
It is the risk where oversupply during peak production hours drives wholesale electricity prices to zero or negative, potentially eroding the IRR of solar-heavy portfolios.
What is the recommended portfolio allocation for green energy in 2026?
A balanced 40/40/20 split is suggested: 40% in Yieldcos for income, 40% in Sustainability Bonds for stability, and 20% in Thematic ETFs for high-growth tech like Hydrogen.