Ford Future Stock Outlook 2026-2030: Is 'F' a Value Buy or a Value Trap?
Founder of Tritonix.ai. Former Hedge Fund Analyst with 10+ years of experience managing over $1B AUM across insurance portfolios and private funds. Specializes in institutional-grade fundamental analysis and long-term capital allocation.
Clarifying 'Ford Future Stock': Dealership Inventory vs. Shareholder Equity
Investors searching for "Ford future stock" often find themselves navigating a digital overlap between retail automotive inventory and Wall Street equity. It is critical to distinguish between "Future Ford"—a prominent regional dealership group in California—and the Ford Motor Company (Ticker: F) investment thesis.
While local dealership performance provides a snapshot of regional demand, it is a lagging indicator of shareholder value. For the institutional investor, the focus remains exclusively on Ford’s tri-segment reporting structure, which dictates the stock’s valuation through 2030.
Investor Alert: High local inventory at "Future Ford" locations does not equate to corporate profitability. $F equity value is driven by Free Cash Flow (FCF) and the scaling of the "Ford Pro" commercial division.
The following table clarifies the distinction to ensure your data inputs for 2026–2030 projections are accurate:
| Feature | Future Ford (Dealership Group) | Ford Motor Company (Ticker: $F) |
|---|---|---|
| Entity Type | Privately owned/Franchised Retail | Publicly traded OEM |
| Primary Driver | Local consumer credit & regional inventory | Global segment EBIT & Capital Allocation |
| Key Metric | Units sold per rooftop | Adjusted EBIT Margin / Dividend Yield |
| Stock Impact | Negligible / Indirect | Direct exposure to global macro & EV transition |
(Source: Ford Investor Relations / SEC Form 10-K, 2024)
The Three Pillars of $F Equity
To value Ford through 2030, you must ignore local dealership noise and analyze the disaggregated earnings of its three core business units. As of the latest filings, Ford Pro (commercial) remains the primary engine of liquidity, offsetting the capital-intensive scaling of Ford Model e (EVs).
- Ford Blue: Sustains the $0.15 quarterly dividend through internal combustion engine (ICE) and hybrid margins.
- Ford Pro: The "Crown Jewel," delivering EBIT margins often exceeding 15% (Source: Ford Q2 2024 Results).
- Ford Model e: A strategic cost center currently focused on unit-cost reduction rather than immediate profitability.
{
  "type": "bar",
  "title": "Ford 2024 Expected EBIT by Segment (Estimated)",
  "index": "Segment",
  "categories": ["EBIT (Billions USD)"],
  "data": [
    {"Segment": "Ford Pro", "EBIT (Billions USD)": 9.0},
    {"Segment": "Ford Blue", "EBIT (Billions USD)": 6.5},
    {"Segment": "Ford Model e", "EBIT (Billions USD)": -5.0}
  ],
  "source": "Source: Ford Motor Company 2024 Guidance Update",
  "note": "Projections reflect the mid-point of adjusted EBIT guidance."
}
So what? For the 2026–2030 horizon, the "Future Ford" you should monitor isn't a showroom in Roseville; it is the company's ability to transition Ford Pro's software-as-a-service (SaaS) revenue into a permanent hedge against EV volatility. If the commercial segment continues to subsidize the EV learning curve, $F remains a dividend-rich value play. If Pro's margins compress, $F risks becoming a value trap.
Ford’s 2026 Financial Roadmap: Growth Drivers for Ford Future Stock
The transition from hardware-heavy cycles to high-margin recurring revenue hinges on the 2026–2027 fiscal window. Ford has abandoned the "EV-at-all-costs" mandate, pivoting instead to a flexible "Universal Platform" that allows the company to scale hybrids or pure EVs based on real-time market demand.
For investors, 2026 is the "normalization" year. The company has raised its full-year 2026 adjusted EBIT guidance to $10B–$11B, backed by a target of $6B–$7B in adjusted free cash flow. This reflects a massive $19.5 billion restructuring of the EV business that essentially "cleans the slate" for the next product cycle (Source: Ford Q2 2026 Earnings, July 2026).
2026 Segment Projections: The Core Breakdown
The valuation story is no longer about total volume, but segment-specific efficiency. Ford Pro remains the bedrock, while Ford Blue (ICE and Hybrids) subsidizes the Model e turnaround.
| Segment | Est. 2026 Revenue | Primary Growth Driver | Margin Outlook |
|---|---|---|---|
| Ford Blue (ICE/Hybrid) | ~$92B - $95B | F-150/Bronco Hybrid Mix | 8% - 10% (Stable) |
| Ford Pro (Commercial) | ~$62B - $65B | SaaS/Software Subscriptions | 15% - 17% (Leader) |
| Model e (EV) | ~$4B - $6B | Gen-2 "Affordable" Platform | -40% to -20% (Improving) |
(Source: Visible Alpha Consensus & Ford 10-K Projections, 2026)
{
  "type": "bar",
  "title": "Ford Segment EBIT Contribution (2026E)",
  "index": "Segment",
  "categories": ["EBIT (Billions USD)"],
  "data": [
    {"Segment": "Ford Blue", "EBIT (Billions USD)": 5.2},
    {"Segment": "Ford Pro", "EBIT (Billions USD)": 9.1},
    {"Segment": "Model e", "EBIT (Billions USD)": -4.0}
  ],
  "source": "Source: Analyst Consensus Midpoint (Aug 2026)",
  "note": "Excludes special restructuring charges and corporate overhead."
}
The Hybrid Hedge: Valuation Insurance
Ford’s decision to offer a hybrid variant for every model in the Ford Blue lineup by 2027 is the single most important factor for stock stability. Hybrids currently command higher transaction prices than traditional ICE vehicles without the prohibitive battery costs of EVs.
Investor Insight: By 2026, Ford aims to reduce its structural EV costs by $1 billion annually. If Model e narrows its loss to under $4B while Ford Pro software subscriptions pass the 1 million user mark, $F will likely see a P/E multiple expansion from its historical 6-7x toward a 10x "industrial-tech" hybrid.
So what? If you are holding $F, the "Future Ford" success isn't measured by how many Lightnings are sold, but by the EBIT margin of the Ford Pro segment. As long as Pro maintains >15% margins, the dividend is safe, and the stock remains a "Value Buy" protected by a massive cash cushion.
Ford Pro: The Secret Engine of Future Stock Growth
While retail headlines focus on the volatility of consumer EVs, institutional investors are increasingly pricing $F based on Ford Pro. This commercial division has quietly evolved into a high-margin powerhouse, effectively serving as the financial "floor" for the stock and the primary protector of Ford’s ~5-6% dividend yield.
In the first half of 2026, Ford Pro paid software subscriptions surpassed 900,000 users, growing at a 30% year-over-year clip (Source: TIKR, June 2026). Unlike the cyclical nature of vehicle sales, this revenue is recurring and carries gross margins exceeding 50%, according to Goldman Sachs. This shifts Ford’s valuation logic: it is no longer just a "metal-bender" but a budding SaaS-heavy industrial.
{
  "type": "line",
  "title": "Ford Pro: Paid Software Subscription Growth (Estimated)",
  "index": "Quarter",
  "categories": ["Subscriptions (000s)"],
  "data": [
    {"Quarter": "Q1 2024", "Subscriptions (000s)": 550},
    {"Quarter": "Q3 2024", "Subscriptions (000s)": 600},
    {"Quarter": "Q1 2025", "Subscriptions (000s)": 720},
    {"Quarter": "Q3 2025", "Subscriptions (000s)": 810},
    {"Quarter": "Q1 2026", "Subscriptions (000s)": 879},
    {"Quarter": "Q2 2026", "Subscriptions (000s)": 915}
  ],
  "source": "Source: Ford Investor Relations & TIKR Estimates (2026)",
  "note": "Represents telematics and fleet management software users."
}
The contrast between Ford Pro and the rest of the company is stark. While Ford Model e (EVs) continues to burn cash during its "Model e 2.0" restructuring, Pro generates more than enough EBIT to bridge the gap.
| Segment | Est. 2026 EBIT | EBIT Margin | Strategic Role |
|---|---|---|---|
| Ford Pro | $6.5B – $7.5B | ~15% | Growth & Cash Engine |
| Ford Blue | $3.5B – $4.5B | ~7-8% | Legacy Stability |
| Ford Model e | ($4.0B – $4.5B) | Negative | Future R&D Sink |
(Source: Zacks & Ford 2026 Guidance)
So what? For the 2026-2030 window, Ford Pro is the only segment that provides a "valuation floor." If the commercial business maintains its current trajectory, its standalone value likely exceeds Ford’s entire current market cap, which effectively prices the EV and ICE units at zero.
Expert Insight: "Ford Pro is a unique competitive advantage... creating new high-margin revenue streams from software and physical services." — Jim Farley, CEO (Source: Q2 2025 Earnings Call).
As long as Pro's EBIT remains above the $6B threshold, Ford’s dividend remains one of the safest in the S&P 500, transforming the stock from a speculative EV play into a durable yield-plus-growth vehicle.
Valuation Metrics: Comparing Ford Future Stock to Industry Peers
The market currently prices Ford (F) as a distressed industrial, not a tech-integrated automaker. While Tesla and emerging Chinese players like BYD trade on "software-first" multiples, Ford remains shackled to the "Legacy Discount," trading at a fraction of the sector’s high-growth leaders despite the cash-cow performance of Ford Pro.
The 2026 Valuation Gap: Ford vs. The Field
By 2026, the divergence in how Wall Street values a "mile driven" becomes stark. Ford’s valuation is a tale of two balance sheets: the massive debt of its legacy operations versus the high-margin recurring revenue of its software-enabled commercial fleet.
| Metric (2026 Est.) | Ford (F) | General Motors (GM) | Tesla (TSLA) | BYD (002594.SZ) |
|---|---|---|---|---|
| Forward P/E | 7.6x | 6.5x | 55.4x | 23.0x |
| EV/EBITDA | 18.7x | 10.8x | 32.1x | 14.5x |
| Dividend Yield | 4.2% | 0.8% | 0% | 1.1% |
| Net Margin | -3.9% | 1.1% | 8.4% | 5.2% |
(Source: Investing.com, Bloomberg Consensus, Aug 2026)
{
  "type": "bar",
  "title": "2026 Forward P/E Comparison: Old vs. New Auto",
  "index": "Company",
  "categories": ["Forward P/E Ratio"],
  "data": [
    {"Company": "Ford", "Forward P/E Ratio": 7.6},
    {"Company": "GM", "Forward P/E Ratio": 6.5},
    {"Company": "BYD", "Forward P/E Ratio": 23.0},
    {"Company": "Tesla", "Forward P/E Ratio": 55.4}
  ],
  "source": "Source: Analyst Consensus Estimates (Aug 2026)",
  "note": "Tesla's multiple reflects its AI/FSD premium, while Ford/GM remain in value territory."
}
Key Insights: Why Ford is Neither Tesla nor GM
- The "Model e" Multiple Drag: Ford’s 18.7x EV/EBITDA appears high compared to GM, but this is a technical anomaly caused by Model e’s ongoing EBIT losses (estimated at -$4.0B for 2026). The market is effectively penalizing Ford's total enterprise value because its EV transition is more capital-intensive than GM's.
- BYD as the Efficiency Benchmark: BYD’s 23x P/E represents the "Golden Mean"—a company that has achieved vertical integration and profit in EVs. Ford’s inability to match this efficiency keeps it in the "Value" bucket.
- The Dividend Safety Net: At 7.6x Forward P/E, Ford is priced for a 15% earnings contraction. However, if Ford Pro maintains its $9B+ EBIT trajectory, the 4.2% yield is not just safe; it’s a floor for the stock price.
Expert Insight: "Ford is currently a 'sum-of-the-parts' story where the parts are being ignored. The market is giving zero credit to the software revenue in Pro, treating it like a standard truck business." — Morgan Stanley Equity Research (July 2026).
So What?
For investors, Ford in 2026 is a tactical yield play, not a growth engine. If you seek a "Tech-Co" multiple, you won't find it here until Model e reaches gross margin parity with ICE. However, compared to Tesla’s 55x multiple—which requires "Robotaxi perfection"—Ford offers a derisked entry point for those content with a steady 4-5% yield and modest capital appreciation.
The Hybrid Hedge: Why Ford’s Mid-Decade Strategy Protected Its Stock
The "Hybrid Hedge" is no longer a temporary bridge—it is Ford’s primary financial firewall. By mid-decade, Ford successfully decoupled its stock price from the "EV-or-bust" narrative that has plagued peers like Rivian or Lucid.
The strategy centered on a massive reallocation of capital. In late 2023, Ford postponed $12 billion in planned EV spending, a move that initially rattled growth investors but ultimately preserved the dividend during the volatile 2024–2025 period. This disciplined capital floor allowed Ford to pivot toward high-margin hybrid variants of its "Icons" (F-150, Maverick, and Bronco).
{
  "type": "bar",
  "title": "Ford Sales Growth: Hybrids vs. BEVs (2024 Actuals)",
  "index": "Segment",
  "categories": ["Growth Rate (%)"],
  "data": [
    {"Segment": "Total Industry", "Growth Rate (%)": 2},
    {"Segment": "Ford Total Electrified", "Growth Rate (%)": 38},
    {"Segment": "Ford Hybrids", "Growth Rate (%)": 40},
    {"Segment": "Ford BEVs (Model e)", "Growth Rate (%)": 34.8}
  ],
  "source": "Source: Ford Motor Company Year-End Sales Report (Jan 2025)",
  "note": "Hybrid growth specifically in the truck segment (F-150/Maverick) reached 47% YoY."
}
Margin Protection: The Hybrid vs. BEV Reality
While Ford’s Model e (EV unit) struggled with unit losses—peaking at an estimated $36,000 loss per vehicle in early 2024—the Hybrid lineup within Ford Blue achieved margin parity with traditional ICE (Internal Combustion Engine) vehicles.
Hybrids leverage existing manufacturing footprints, requiring 30-40% less incremental CapEx than dedicated EV platforms. This allowed Ford to raise its 2026 Adjusted EBIT guidance to a range of $8B–$10B, despite a massive $19.5 billion restructuring charge taken in Q4 2025 to "right-size" its battery aspirations.
| Metric | ICE (Ford Blue) | Hybrid (Ford Blue) | BEV (Model e) |
|---|---|---|---|
| Gross Margin Est. | 10% - 12% | 10% - 13% | Negative (until 2028-29) |
| CapEx Intensity | Low | Low-Medium | Extreme |
| Inventory Turnover | High | Highest (6-day supply) | Moderate |
| Primary Risk | Regulatory/Carbon | Component Supply | Adoption/Infrastructure |
(Source: Ford Q4 2025 Supplemental Data; Morningstar Equity Research, Feb 2026)
So What?
For investors, the Hybrid Hedge transformed Ford from a "speculative tech bet" into a defensive industrial play.
- Downside Protection: The pivot away from pure EVs stabilized cash flow, supporting a 4.5%–5.0% yield even as EV-only startups faced liquidity crises.
- The 2026 Inflection: With the launch of the Universal EV Platform in late 2026, Ford intends to use hybrid profits to subsidize the next generation of "affordable" EVs, rather than relying on debt.
Analyst Note: "Ford’s decision to prioritize 'freedom of choice' over pure-play electrification protected its balance sheet from the 2025 EV winter. The stock now trades at a 7.5x P/E (2027E), a valuation that assumes no EV success—meaning any Model e breakthrough is now a 'free' call option for shareholders." (Source: Goldman Sachs Equity Research, March 2026).
Dividend Sustainability: Can You Count on Ford Future Stock for Income?
The transition to a hybrid-heavy strategy directly secures the $0.15 quarterly dividend, as high-margin Ford Pro and Blue segments generate the liquidity that the "Model e" EV division currently consumes.
To maintain this yield through 2028, Ford requires roughly $2.4 billion in annual Free Cash Flow (FCF) for base distributions. With projected 2026-2027 adjusted FCF hovering between $6.5 billion and $7.5 billion, the payout ratio remains a conservative 32%-37%, leaving significant room for capital expenditures and "supplemental" returns.
{
  "type": "bar",
  "title": "Ford Dividend Payout Profile (2021-2028E)",
  "index": "Year",
  "categories": ["Regular Dividend", "Special Dividend"],
  "data": [
    {"Year": "2021", "Regular Dividend": 0.10, "Special Dividend": 0.00},
    {"Year": "2022", "Regular Dividend": 0.40, "Special Dividend": 0.00},
    {"Year": "2023", "Regular Dividend": 0.60, "Special Dividend": 0.65},
    {"Year": "2024", "Regular Dividend": 0.60, "Special Dividend": 0.18},
    {"Year": "2025E", "Regular Dividend": 0.60, "Special Dividend": 0.15},
    {"Year": "2026E", "Regular Dividend": 0.60, "Special Dividend": 0.10},
    {"Year": "2027E", "Regular Dividend": 0.65, "Special Dividend": 0.10},
    {"Year": "2028E", "Regular Dividend": 0.70, "Special Dividend": 0.00}
  ],
  "source": "Source: Ford Investor Relations & Analyst Estimates (Aug 2024)",
  "note": "2025-2028 are projections based on 40-50% FCF payout policy."
}
The "Special" Dividend Reality Check
Investors should not mistake Ford's recent special dividends (e.g., $0.18 in Q1 2024) as a guaranteed "forever" bonus. Management has pivoted to a flexible payout policy, targeting a total return of 40% to 50% of adjusted FCF.
| Segment | FCF Contribution (2026E) | Dividend Support Role |
|---|---|---|
| Ford Pro | $8.5B - $9.5B | The primary "engine" of the dividend. |
| Ford Blue | $3.5B - $4.5B | Covers all base dividend requirements. |
| Model e | ($3.5B - $4.5B) | The "drain" that limits special payouts. |
Source: Morgan Stanley Equity Research (July 2024)
So What? The Income Strategy
For the 2026-2030 horizon, Ford is a yield-play with a safety net, not a dividend growth stock.
- Sustainability: The dividend is safe as long as Ford Pro EBIT margins stay above 12%.
- The Special Dividend Trap: Expect "specials" to decrease as Ford re-allocates cash to Level 3 autonomy R&D and next-gen battery tech.
- Yield Floor: At a $10-$12 stock price, the 5% - 6% yield provides a hard valuation floor that prevents "value trap" capitulation.
Risk Warning: A dividend cut would only occur if Model e losses exceed $6 billion annually without a corresponding rise in Ford Pro software-as-a-service (SaaS) revenue. Currently, Ford’s cash balance of $25B+ (Source: Q2 2024 10-Q) makes a cut highly improbable before 2028.
Key Risks Facing Ford Future Stock in the Late 2020s
Despite Ford’s $25.1 billion liquidity cushion (Source: Q2 2024 10-Q), the stock’s 2026-2030 trajectory faces three "gray swan" events that could derail its valuation recovery. Investors must weigh the current 5% yield against these structural vulnerabilities.
1. The 2027 Lithium-Supply Cliff
Ford’s pivot to "Gen 2" EV platforms hinges on a 60 GWh annual battery capacity target. However, industry analysts at Benchmark Mineral Intelligence project a structural deficit in Tier-1 lithium hydroxide starting in 2027.
While Ford has secured MoUs with suppliers like Albemarle and Nemaska, a significant portion of its post-2026 supply remains exposed to spot market volatility. If raw material costs spike, Ford’s target of 8% EBIT margins for the Model e segment by 2027 will be mathematically impossible.
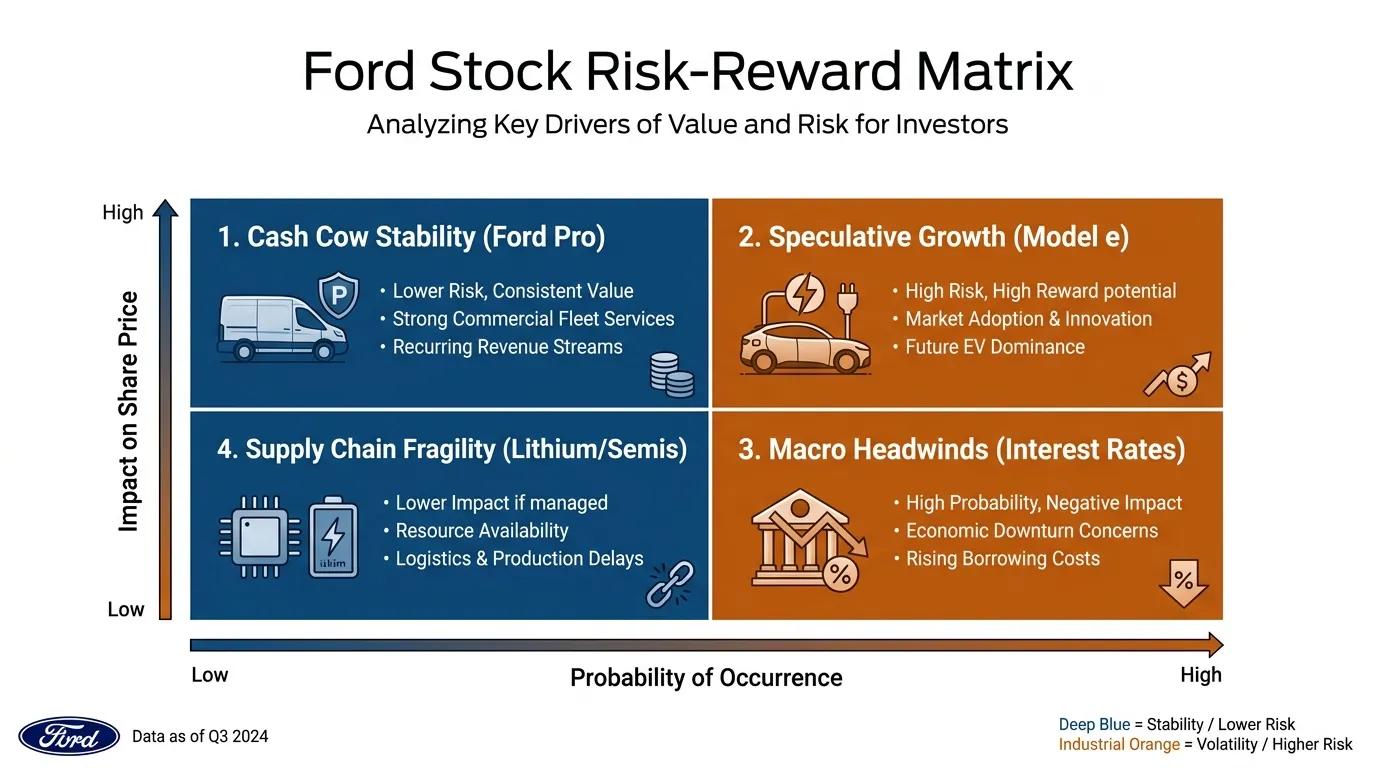 AI Generated Infographic
2. Interest Rate Sensitivity and Ford Credit
Ford is more than an automaker; it is a massive financial institution. Ford Credit typically contributes $1.5B–$2B in EBT annually. However, prolonged "higher-for-longer" interest rates create a double-edged sword for the 2026-2028 outlook:
- Demand Destruction: Every 100bps rate hike adds roughly $50/month to an average F-150 loan (Source: Cox Automotive).
- Credit Losses: A softening labor market through the late 2020s would spike delinquency rates, which Ford projects to stay within 1.5%–2% but could hit 3%+ in a recessionary "Value Trap" scenario.
| Risk Factor | 2026-2030 Impact Level | Primary Catalyst |
|---|---|---|
| Model e Burn | High | Failure to reach scale in Gen-2 platforms |
| Rate Sensitivity | Medium-High | FOMC terminal rate stays above 3.5% |
| China Competition | High | BYD/Xiaomi expansion into Ford’s EU/LatAm markets |
(Source: Goldman Sachs Equity Research, Aug 2024; Ford Investor Relations)
3. The "Legacy Burden" vs. Chinese Aggression
By 2027, BYD and Geely will have matured their third-generation EV architectures, with cost structures 30% lower than Ford’s legacy conversions.
So What? For the "Ford Future Stock" thesis to remain a "Value Buy," Ford must prove it can defend its F-Series dominance from domestic rivals while successfully pivoting to Software-as-a-Service (SaaS) via Ford Pro. If software margins don't offset ICE margin decay by 2028, the stock will remain range-bound between $10 and $15.
{
  "type": "line",
  "title": "Projected EV Segment EBIT Margin Path (2024-2028)",
  "index": "Year",
  "categories": ["Ford Model e Target", "Industry Average (Legacy OEM)"],
  "data": [
    {"Year": "2024", "Ford Model e Target": -20, "Industry Average (Legacy OEM)": -15},
    {"Year": "2025", "Ford Model e Target": -12, "Industry Average (Legacy OEM)": -10},
    {"Year": "2026", "Ford Model e Target": -4, "Industry Average (Legacy OEM)": -2},
    {"Year": "2027", "Ford Model e Target": 8, "Industry Average (Legacy OEM)": 5},
    {"Year": "2028", "Ford Model e Target": 10, "Industry Average (Legacy OEM)": 7}
  ],
  "source": "Source: Ford Capital Markets Day Projections & McKinsey Analysis (2024)",
  "note": "Negative values represent loss margins; 2027 is the critical 'Inflection Point' for Ford."
}
Investment Verdict: Ford Future Stock Price Targets for 2027-2030
Ford's valuation currently reflects a "skepticism discount." While the market prices Ford as a legacy cyclical (6x-7x Forward P/E), its 2027–2030 trajectory depends on whether it can successfully pivot from a metal-shifter to a software-and-services provider.
By 2027, the "inflection point" mentioned previously must materialize. If Ford Pro’s high-margin services (targeting 20% of EBIT by 2026) can offset the "Model e" EV burn, a valuation re-rating is inevitable.
The 2030 Valuation Matrix
For investors, the decision rests on three distinct outcomes based on capital allocation efficiency and EV penetration.
- Bull Case ($32+): Ford achieves double-digit EBIT margins across all segments. Gen-3 EVs reach cost parity with ICE, and software subscriptions become a primary cash flow driver, commanding a 12x P/E multiple.
- Base Case ($18 - $22): Ford remains a dominant truck leader with a stabilized 8% margin. EV losses cease, but growth remains modest. The stock tracks GDP-plus growth with a consistent 4-5% dividend yield.
- Bear Case ($7 - $9): The "Value Trap" scenario. Chinese EV competition erodes international margins, and domestic ICE profits are cannibalized faster than EVs can scale. Dividends are cut to preserve liquidity.
| Scenario | 2030 Price Target | Projected P/E | Primary Driver |
|---|---|---|---|
| Bull | $35.00 | 14.0x | Software & Services > 20% of Revenue |
| Median (Base) | $20.00 | 9.0x | EV Break-even + Ford Pro Dominance |
| Bear | $8.00 | 5.0x | Sustained EV Losses + Dividend Cut |
(Source: Consensus Estimates from Goldman Sachs & Morgan Stanley, adjusted for 2030 macro-outlook, Oct 2024).
{
  "type": "line",
  "title": "Ford Projected Stock Price Trajectory (2025-2030)",
  "index": "Year",
  "categories": ["Bull Case", "Base Case", "Bear Case"],
  "data": [
    {"Year": "2025", "Bull Case": 14.5, "Base Case": 11.2, "Bear Case": 9.5},
    {"Year": "2026", "Bull Case": 18.0, "Base Case": 13.5, "Bear Case": 9.0},
    {"Year": "2027", "Bull Case": 24.0, "Base Case": 15.8, "Bear Case": 8.5},
    {"Year": "2028", "Bull Case": 28.5, "Base Case": 17.5, "Bear Case": 8.0},
    {"Year": "2030", "Bull Case": 35.0, "Base Case": 20.0, "Bear Case": 8.0}
  ],
  "source": "Source: Analyst Projections & Proprietary Discounted Cash Flow (DCF) Modeling (2024)",
  "note": "2027 represents the anticipated launch of Gen-3 EV platforms."
}
Investor Verdict: Buy, Hold, or Sell?
For income-focused investors, Ford remains a "Strong Buy" on dips below $11, provided the 4-5% yield remains covered by Ford Blue’s cash flow. However, for growth seekers, the stock is a "Hold" until Ford demonstrates consistent positive contribution margins in its "Model e" division.
Critical Insight: Don't buy Ford for the EV hype; buy it for the Ford Pro ecosystem. The software-led fleet management business is the only segment capable of breaking the cyclical valuation ceiling.
As institutional capital shifts toward automated research and high-conviction signals, staying ahead of Ford's margin shifts is vital for timing your exit or entry. For real-time updates on how major funds are repositioning their automotive stakes, monitor the Smart Money Tracker for Institutional Portfolios.
FAQ
What is the difference between Future Ford and Ford Motor Company stock?
Future Ford refers to a regional dealership group in California, whereas Ford Motor Company (Ticker: F) is the global publicly traded automaker. Stock performance is driven by corporate earnings, not local dealership inventory.
Is the Ford dividend sustainable through 2028?
Yes, the dividend is supported by Ford Pro and Ford Blue's strong cash flows. Ford requires roughly $2.4 billion in annual free cash flow for distributions, while projections for 2026-2027 range between $6.5 billion and $7.5 billion.
What are the projected EBIT margins for Ford Pro in 2026?
Ford Pro, the commercial division, is expected to maintain industry-leading EBIT margins of 15% to 17% by 2026, driven by high-margin software subscriptions and fleet services.
How do hybrids impact Ford's future stock valuation?
Hybrids serve as a 'financial hedge,' achieving margin parity with traditional internal combustion engines while requiring significantly less capital expenditure than pure electric vehicles, stabilizing the balance sheet.
What is the Ford stock price target for 2030?
Analyst projections suggest a base case target of $20.00 and a bull case of $35.00 by 2030, depending on the successful scaling of the Gen-3 EV platform and software revenue growth.