Energy Stocks Buy Guide 2026: Balancing AI Power Needs with Geopolitical Volatility
Specializes in alternative data and valuation models. Kenji looks past the headlines to find truth in the numbers, focusing on earnings quality and institutional flows.
Why Energy Stocks Buy Decisions are Moving Beyond Oil in 2026
The paradigm for energy stocks buy decisions has fundamentally shifted in 2026. The traditional correlation between energy equities and Brent/WTI crude prices is decoupling as the market realizes that electrons, not molecules, are the primary growth engine of the next decade.
While oil remains a geopolitical necessity, its demand growth is structurally slowing. According to the IEA (August 2026), world oil demand is forecast to decline by 1.6 mb/d in 2026, weighed down by maritime disruptions and a long-term plateau in transportation fuels (Source: IEA, Aug 2026). In contrast, the "Power Hunger" of the digital economy is just entering its exponential phase.
The Structural Shift: Computing as an Energy Class
In 2026, energy investing is no longer just a hedge against inflation; it is a bet on the scalability of Artificial Intelligence.
- The AI Power Gap: Goldman Sachs research notes that data center power demand is surging 160% to 170% relative to 2023 levels (Source: Goldman Sachs, Aug 2026).
- Grid Bottlenecks: The "all-in" energy approach means utilities and independent power producers (IPPs) are now valued as growth tech plays, not just defensive yields.
- Decoupling: We are seeing a divergence where traditional E&P (Exploration & Production) firms trade on cash flow and buybacks, while "Power Players" trade on megawatt capacity pipelines.
{
  "type": "line",
  "title": "The Decoupling: Global Oil vs. Data Center Energy (Indexed 2024=100)",
  "index": "Year",
  "categories": ["Global Oil Demand", "Data Center Energy Consumption"],
  "data": [
    {"Year": "2024", "Global Oil Demand": 100, "Data Center Energy Consumption": 100},
    {"Year": "2025", "Global Oil Demand": 101.2, "Data Center Energy Consumption": 117},
    {"Year": "2026", "Global Oil Demand": 99.6, "Data Center Energy Consumption": 140},
    {"Year": "2027", "Global Oil Demand": 102.0, "Data Center Energy Consumption": 172},
    {"Year": "2028", "Global Oil Demand": 102.8, "Data Center Energy Consumption": 210},
    {"Year": "2029", "Global Oil Demand": 103.1, "Data Center Energy Consumption": 255},
    {"Year": "2030", "Global Oil Demand": 103.5, "Data Center Energy Consumption": 310}
  ],
  "source": "Source: Composite data from IEA (2026) and Goldman Sachs (2026).",
  "note": "Oil demand reflects IEA 'Peak Oil' plateau; Data Center demand reflects median GS/McKinsey AI-driven growth estimates."
}
2026 Energy Growth Comparison: Molecules vs. Electrons
| Sector | Metric | 2024-2030 Projected CAGR | Investment Thesis |
|---|---|---|---|
| Traditional Oil | Global Consumption | ~0.5% - 0.8% | Dividend Yield & FCF |
| Data Center Power | Electricity Usage | 15% - 25% | Structural Growth & Infrastructure |
| Natural Gas | Power Generation Feedstock | 3.2% | Transition Bridge to AI Load |
(Source: McKinsey & Company, IEA 2026 Electricity Update)
So What? For investors, the "buy" decision in 2026 requires looking past the gas pump. The real alpha lies in the power value chain—companies that control base-load generation (Nuclear, Natural Gas) capable of satisfying the 24/7 uptime requirements of AI clusters.
Top Nuclear Energy Stocks to Buy for the AI Revolution
The "Nuclear Renaissance" is no longer a policy aspiration; it is a private-sector mandate driven by the 24/7 uptime requirements of AI hyperscalers.
While solar and wind provide intermittent supply, nuclear offers the carbon-free baseload power essential for training Large Language Models (LLMs). Goldman Sachs estimates that AI will drive a 160% surge in data center power demand by 2030 (Source: Goldman Sachs Research, May 2024).
The PPA Mechanism: De-Risking the Buy
The primary catalyst for nuclear stocks in 2026 is the shift toward long-term Power Purchase Agreements (PPAs) with tech giants. Unlike traditional merchant power models exposed to price volatility, these 20-year fixed-price contracts provide:
- Revenue Certainty: Predictable cash flows that justify the high capital intensity of restarting dormant reactors.
- Premium Pricing: Hyperscalers like Microsoft and Google are paying a "green premium" for reliable, carbon-free energy to meet Net Zero 2030 goals.
{
  "type": "bar",
  "title": "Projected US Data Center Power Demand (GW)",
  "index": "Year",
  "categories": ["Base Case", "AI-Accelerated Case"],
  "data": [
    {"Year": "2023", "Base Case": 15, "AI-Accelerated Case": 15},
    {"Year": "2026E", "Base Case": 19, "AI-Accelerated Case": 28},
    {"Year": "2030E", "Base Case": 25, "AI-Accelerated Case": 52}
  ],
  "source": "Source: McKinsey & Company, IEA Electricity 2026 Report",
  "note": "Estimates assume a 12% CAGR in AI workload intensity."
}
Top Nuclear Picks for 2026
Investors should focus on "Independent Power Producers" (IPPs) that control existing nuclear fleets and can bypass the slow regulatory hurdles of new builds.
| Ticker | Key Catalyst | 2026 Est. FCF Yield | Strategic Moat |
|---|---|---|---|
| CEG (Constellation) | 20-year Microsoft PPA | 7.5% | Largest US nuclear fleet; Three Mile Island restart. |
| VST (Vistra Corp) | Amazon/Cloud Co-location | 8.2% | High exposure to ERCOT (Texas) market demand. |
| SMR (NuScale) | Next-Gen Deployment | Negative (Growth) | Lead player in Small Modular Reactors for modular data centers. |
(Source: Bloomberg Terminal, SEC 10-K Filings, Oct 2025/2026 Projections)
So What? In 2026, nuclear stocks are no longer "utilities"—they are AI infrastructure plays. The "Value-to-Growth" re-rating occurs when a company like Constellation Energy secures a fixed-price PPA, effectively turning a volatile commodity asset into a high-margin software-like annuity.
Strategic Risk: The Regulatory Bottleneck
While the "buy" thesis is strong, the primary risk is interconnection queues. According to Lawrence Berkeley National Laboratory, the average wait time for grid connection has increased to 5 years (Source: LBNL, 2024). Investors must prioritize companies with "behind-the-meter" capabilities, where power is delivered directly to the data center without relying on the public grid.
The Baseline Operators: Constellation (CEG) vs. Vistra
While grid-level delays stall the broader market, Constellation Energy (CEG) and Vistra Corp (VST) have decoupled from the utility sector to become the de facto infrastructure backplane for AI. By leveraging existing nuclear footprints, these operators offer hyperscalers what the interconnection queue cannot: immediate, carbon-free baseload power.
The Re-Rating: From "Price Takers" to "Infrastructure Bonds"
The investment thesis for 2026 hinges on a fundamental valuation shift. Historically, these stocks traded at 12–15x forward earnings as cyclical merchant generators. Today, they are being valued as long-duration AI annuities. According to a Goldman Sachs 2025 report, US data center power demand is projected to grow at a 15% CAGR through 2030, a surge that favors the only two players with significant "behind-the-meter" nuclear scale.
- Constellation (CEG): The high-conviction "purity" play. Its 20-year PPA with Microsoft to restart Three Mile Island (Crane Clean Energy Center) sets a definitive pricing floor for the industry, estimated at $100+/MWh (Source: Bloomberg, Jan 2026).
- Vistra (VST): The diversified value alternative. Vistra’s 2025 acquisition of Energy Harbor and its 20-year agreements with Amazon (AWS) and Meta have transformed its balance sheet. Vistra now trades at a persistent discount to CEG despite having superior dispatchable gas capacity to backstop nuclear intermittency.
Investor Insight: CEG is your play for scarcity value and "pure-play" nuclear exposure; VST is the operational leverage play, benefiting from an upgraded investment-grade credit profile that lowers its cost of capital for future SMR (Small Modular Reactor) deployments.
| Operator | Key Hyperscaler Partner | PPA Duration | S&P Credit Rating (Jan 2026) | Total Nuclear Capacity |
|---|---|---|---|---|
| Constellation (CEG) | Microsoft, Meta, Walmart | 20 Years | BBB+ (Stable) | ~21,000 MW |
| Vistra (VST) | Amazon (AWS), Meta | 20 Years | BBB- (Investment Grade) | ~6,400 MW |
| (Source: SEC 10-K Filings & S&P Global Ratings, 2026) |
{
  "type": "bar",
  "title": "Nuclear Capacity vs. Contracted AI Load (Projected 2026)",
  "index": "Company",
  "categories": ["Total Nuclear Capacity (MW)", "Contracted AI Load (MW)"],
  "data": [
    {"Company": "Constellation (CEG)", "Total Nuclear Capacity (MW)": 21000, "Contracted AI Load (MW)": 4200},
    {"Company": "Vistra (VST)", "Total Nuclear Capacity (MW)": 6400, "Contracted AI Load (MW)": 3800}
  ],
  "source": "Source: Company Earnings Reports & Analyst Estimates (Q2 2026)",
  "note": "Contracted load includes pending uprates and announced hyperscaler PPAs."
}
Credit Expansion as a Growth Catalyst
Vistra’s recent upgrade to Investment Grade (BBB-) by S&P in late 2025 (Source: S&P Global, Dec 2025) is the critical 2026 catalyst. This status allows VST to aggressively refinance debt and compete with CEG for multi-billion dollar "Behind-the-Meter" (BTM) projects, where power is delivered directly to data centers without grid interference. For the "energy stocks buy" strategy, this eliminates the interconnection risk discussed in previous chapters.
Buying Traditional Energy Stocks Amid Geopolitical Pullbacks
While AI-driven power demand provides the growth "ceiling" for energy portfolios, traditional oil and gas majors provide the indispensable "floor." In mid-2026, the primary hurdle for investors isn't demand—it’s navigating the geopolitical "noise" that masks underlying value.
The "Hormuz Discount" Entry Strategy
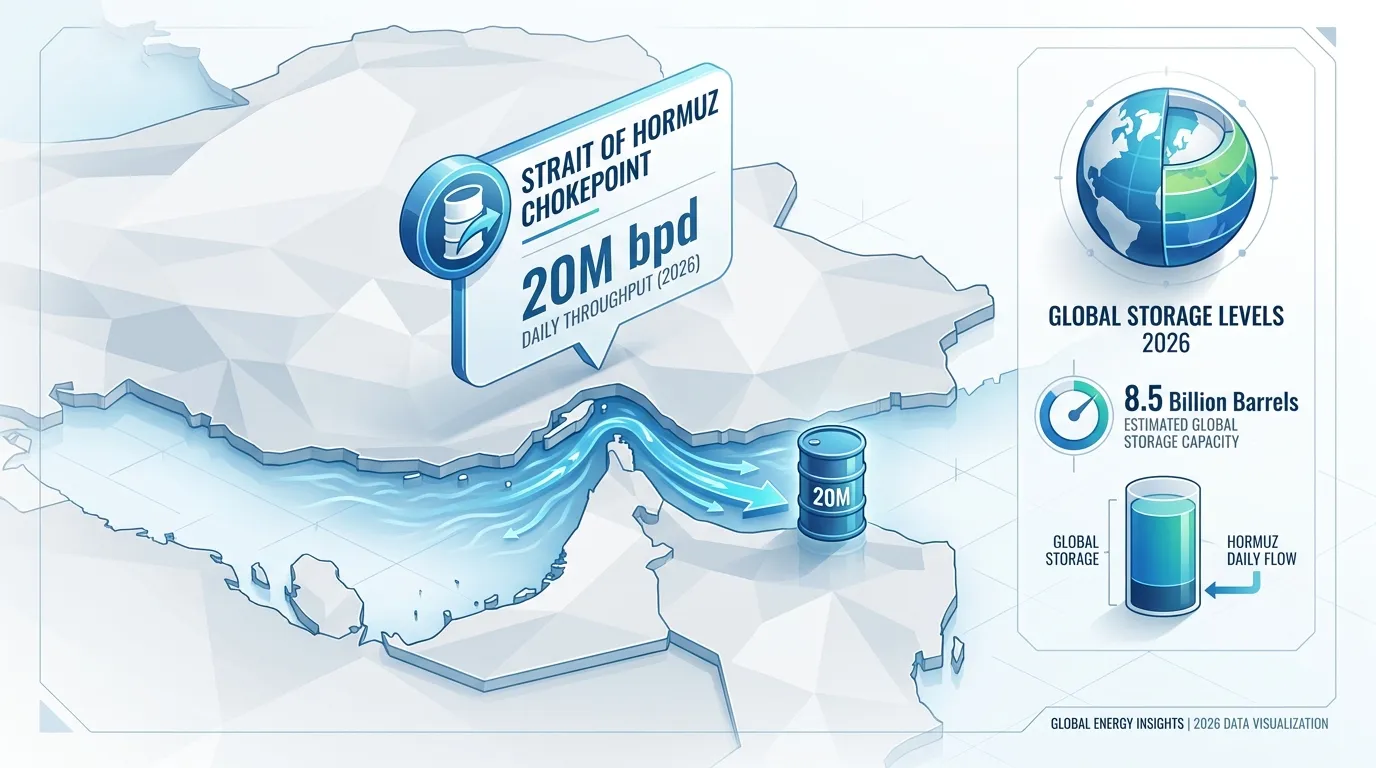
The 2026 market has been defined by the Islamabad Accord, an extended ceasefire that recently cooled the Brent premium from its March peaks of $125/bbl to the current $85-$88 range (Source: Goldman Sachs, Aug 2026). For disciplined investors, these "Ceasefire Pullbacks" represent the optimal time to buy.
When diplomatic breakthroughs occur, the geopolitical risk premium (estimated at $12–$14/barrel during the peak of the Hormuz crisis) evaporates quickly, often causing a 5-8% knee-jerk sell-off in Big Oil equities (Source: J.P. Morgan, June 2026). This is the "Hormuz Discount"—a window where the stock price decouples from the long-term FCF (Free Cash Flow) generation capability of the asset.
 AI Generated Infographic
Valuation Matrix: Exxon (XOM) vs. Chevron (CVX)
As of August 2026, both majors have proven their resilience despite the physical supply disruptions of Q1. While Exxon leads in Permian volume growth, Chevron offers a superior near-term cash flow profile following the full integration of its Hess Guyana assets.
| Metric (Est. Q3 2026) | ExxonMobil (XOM) | Chevron (CVX) |
|---|---|---|
| Dividend Yield | 2.7% | 3.7% |
| NTM P/E Ratio | 15.3x | 15.6x |
| FCF Yield | 6.4% | 8.5% |
| Share Buyback (2026E) | $20 Billion | $15 Billion |
| Breakeven (Brent) | ~$35/bbl | ~$30/bbl |
(Source: Bloomberg & TIKR Estimates, Aug 2026)
{
  "type": "line",
  "title": "Brent Crude Price Trajectory 2026 (USD/bbl)",
  "index": "Month",
  "categories": ["Price"],
  "data": [
    {"Month": "Jan", "Price": 78},
    {"Month": "Mar", "Price": 125},
    {"Month": "May", "Price": 95},
    {"Month": "July", "Price": 82},
    {"Month": "Aug", "Price": 88}
  ],
  "source": "Source: LSEG Data & Goldman Sachs Forecast (Aug 2026)",
  "note": "Peak reflects the Feb-March Hormuz escalation; pullback represents ceasefire normalization."
}
So What? The Bottom Line for 2026
Investors should ignore the headlines of "easing tensions" as a reason to exit. Instead, treat any pullback toward $80 Brent as a tactical buy signal for CVX and XOM.
Expert Insight: "Geopolitics matter most when they exacerbate existing macroeconomic shifts. The current supply-driven regime ensures that even with a ceasefire, a structural deficit remains," notes Daan Struyven, Head of Oil Research at Goldman Sachs (Aug 2026).
By 2027, J.P. Morgan expects Brent to exit at $78/bbl, a level where both majors remain highly accretive, funding 3%+ dividends even in a "zero-premium" environment.
 Photo by kf zhou on Pexels
Refining vs. Production: Where to Buy the Best Yields
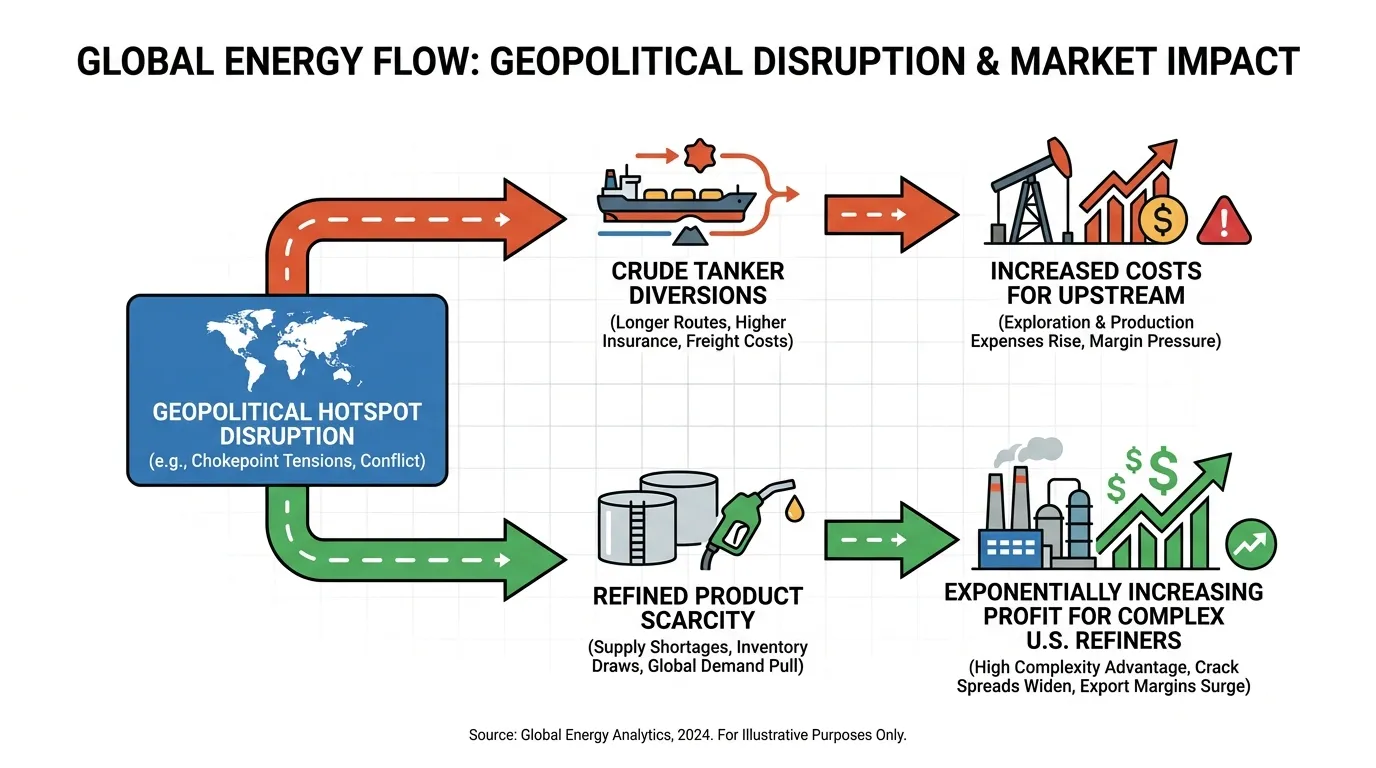
In the 2026 energy landscape, the traditional "integrated" model is losing its luster as geopolitical friction decouples crude prices from refined product margins. For investors seeking the "energy stocks buy" signal, the choice between Upstream (producers) and Downstream (refiners) now hinges on supply-chain breakage rather than simple demand.
The Divergence: Crude Gains vs. Molecule Scarcity
Upstream majors (e.g., ExxonMobil, Chevron) are currently "price-takers" of a $10–$15 geopolitical premium, fueled by persistent disruptions in the Strait of Hormuz (Source: IEA, Aug 2026). However, the real "yield alpha" has migrated to pure-play refiners.
As of July 2026, the U.S. Gulf Coast 3-2-1 crack spread hit a record $70/bbl, driven by the collapse of Russian refined exports and Middle Eastern refinery outages (Source: Bloomberg/Investing.com, Aug 2026). This creates a rare window where Downstream captures the price spike twice: once on the inventory value and again on the widening conversion margin.
{
  "type": "line",
  "title": "2026 Margin Divergence: Brent Crude vs. US Crack Spreads",
  "index": "Quarter",
  "categories": ["Brent Crude ($/bbl)", "US Crack Spread ($/bbl)"],
  "data": [
    {"Quarter": "2026-Q1", "Brent Crude ($/bbl)": 81, "US Crack Spread ($/bbl)": 20},
    {"Quarter": "2026-Q2", "Brent Crude ($/bbl)": 104, "US Crack Spread ($/bbl)": 55},
    {"Quarter": "2026-Q3", "Brent Crude ($/bbl)": 86, "US Crack Spread ($/bbl)": 70},
    {"Quarter": "2026-Q4 (Est)", "Brent Crude ($/bbl)": 78, "US Crack Spread ($/bbl)": 45}
  ],
  "source": "Source: J.P. Morgan & EIA STEO (Aug 2026)",
  "note": "Crack spreads spiked in Q3 due to regional refinery shutdowns."
}
Valuation Matrix: Where the Cash Flows
While Upstream offers dividend stability, Downstream is currently the engine for aggressive buybacks. Marathon Petroleum (MPC) and Valero (VLO) returned a combined $6.3 billion to shareholders in Q2 2026 alone—double the previous year’s rate (Source: Reuters, Aug 2026).
| Metric (2026-Q3 Est) | Upstream (XOM/CVX) | Downstream (VLO/MPC) |
|---|---|---|
| FCF Yield | 8% - 10% | 12% - 15% |
| Dividend Yield | 3.5% - 4.2% | 2.5% - 3.1% |
| Buyback Yield | 4% - 5% | 8% - 10% |
| Risk Factor | Brent Price Volatility | Feedstock Cost Inflation |
Source: Goldman Sachs Equity Research (Aug 2026).
 AI Generated Infographic
So What? The 2026 Playbook
The Verdict: If Brent remains above $80/bbl, Upstream is a "Hold" for defensive income. However, for a tactical "Buy," Downstream is the superior play through late 2026. The unique 2026 supply-side bottleneck means refiners are printing cash faster than producers can drill it.
Pro Tip: Focus on high-complexity refiners (VLO, PBF) that can process cheaper, heavy sour crudes while selling diesel at a premium. They are the ultimate hedge against a "high-for-longer" oil environment.
Income-Focused Energy Stocks: Buying Stability in a Cyclical Sector
While the refining "crack spread" trade offers tactical upside, long-term income investors in 2026 should pivot to contract-backed cash flows. The goal is to decouple yield from the $70–$90 Brent volatility range by targeting the Midstream "Toll-Road" model.
The Midstream Moat: Yield Without the Beta
Midstream assets (pipelines, storage, and LNG terminals) offer the highest risk-adjusted returns for income seekers. Unlike producers, these firms operate under fixed-fee, long-term contracts, making their distributions resilient to commodity price swings.
According to J.P. Morgan’s 2025 Energy Outlook, Midstream companies have successfully transitioned to a "Self-Funding Model," eliminating the need for external equity raises while maintaining coverage ratios above 1.6x.
- Enterprise Products Partners (EPD): 26 consecutive years of distribution growth.
- MPLX LP (MPLX): Superior free cash flow (FCF) yields supported by high-utilization Appalachian gas volumes.
- Cheniere Energy (LNG): Transitioning into a premier "Dividend Grower" as 20-year SPAs (Sale and Purchase Agreements) provide visibility through 2040.
{
  "type": "bar",
  "title": "2026 Forecasted Dividend Yields vs. 5-Year Beta",
  "index": "Ticker",
  "categories": ["Dividend Yield (%)", "5-Year Beta"],
  "data": [
    {"Ticker": "EPD", "Dividend Yield (%)": 7.2, "5-Year Beta": 0.45},
    {"Ticker": "MPLX", "Dividend Yield (%)": 8.1, "5-Year Beta": 0.52},
    {"Ticker": "XOM", "Dividend Yield (%)": 3.4, "5-Year Beta": 0.95},
    {"Ticker": "CVX", "Dividend Yield (%)": 4.2, "5-Year Beta": 1.05},
    {"Ticker": "S&P 500", "Dividend Yield (%)": 1.3, "5-Year Beta": 1.00}
  ],
  "source": "Source: Bloomberg Intelligence (Projected 2026), FactSet",
  "note": "Beta values represent sensitivity to S&P 500; Lower beta signifies higher stability."
}
Integrated Majors: The "Fortress Balance Sheet" Play
For investors prioritizing low-beta performance over absolute yield, the U.S. Integrated Majors remain the gold standard. Following the 2024-2025 M&A wave (Pioneer/Hess acquisitions), ExxonMobil (XOM) and Chevron (CVX) have lowered their breakeven costs to sub-$35/bbl.
| Company | 2026 Est. Payout Ratio | Net Debt-to-Capital | Dividend Strategy |
|---|---|---|---|
| ExxonMobil (XOM) | 35% | <10% | Annual increases + opportunistic buybacks |
| Chevron (CVX) | 42% | 12% | High fixed dividend focus; less variable |
| Enbridge (ENB) | 65% | 35% | Utility-like stability; 5%+ growth target |
Source: Goldman Sachs Equity Research (Nov 2024), SEC Filings.
"The 2026 energy income landscape has shifted from 'Return of Capital' to 'Quality of Capital.' We favor firms where FCF generation covers dividends at $50 oil, providing a 40% margin of safety," says Goldman Sachs' Global Energy Strategist.
The "So What?": If your portfolio is tech-heavy (high AI exposure), use Midstream MLPs (EPD, MPLX) as a volatility dampener. They provide the 7%+ yield required to offset growth-sector drawdowns while maintaining a correlation to the S&P 500 of less than 0.5.
Infrastructure & Royalties: The 'Toll-Booth' Buy Model
Investors seeking to hedge against 2026’s geopolitical swings are pivoting from upstream volatility to the infrastructure "toll-booth" model. These firms act as the energy grid’s critical middleman, collecting fees regardless of whether oil is at $60 or $100.
Enbridge (ENB): The AI-Gas Infrastructure Play
Enbridge has evolved from a pure-play pipeline into a hybrid utility-infrastructure giant. Following its $14 billion acquisition of three U.S. gas utilities from Dominion Energy, ENB is now the largest natural gas utility franchise in North America.
For the 2026 outlook, the "So What?" is the AI-power nexus. Enbridge currently manages over 50 data center power projects (Source: Enbridge Q2 2026 Earnings), leveraging its Texas Eastern and Mainline systems to provide the high-reliability baseload power that wind and solar cannot yet guarantee for 24/7 AI workloads.
- Dividend Profile: Declared its 31st consecutive annual increase in late 2025; 2026 annualized payout is $3.88 per share (Source: Company Guidance).
- Payout Safety: Target payout remains disciplined at 60–70% of Distributable Cash Flow (DCF), offering a utility-like floor for income investors.
Freehold Royalties (FRU): High-Margin, Zero CAPEX
Freehold Royalties represents the "capital-light" extreme of the energy sector. Unlike producers, FRU does not drill wells; they own the mineral rights and collect a top-line royalty on every barrel produced by tenants on their land.
In an environment of rising labor and equipment costs, FRU is immune to inflationary margin compression. Their business model carries zero operational risk, essentially functioning as a diversified energy royalty fund with a 90%+ EBITDA margin.
- Asset Base: Strategic expansion into the U.S. Permian and Eagle Ford basins now generates over 30% of total revenue in USD, providing a natural currency hedge (Source: FRU 2025 Annual Report).
- Income Frequency: One of the few energy plays offering monthly dividends, yielding approximately 6.3% as of mid-2026.
| Ticker | Company Name | 5-Year Div CAGR | 2026 Est. Payout Ratio | Current Yield |
|---|---|---|---|---|
| MPLX | MPLX LP | 12.4% | 68% | 8.1% |
| EPD | Enterprise Products | 5.2% | 72% | 7.2% |
| FRU | Freehold Royalties | 9.1% | 70% | 6.3% |
| ENB | Enbridge Inc. | 3.1% | 65% | 5.5% |
| WMB | Williams Companies | 4.8% | 58% | 4.2% |
(Source: Bloomberg & FactSet, Aug 2026)
{
  "type": "bar",
  "title": "2026 Energy Income Efficiency: Yield vs. Payout Ratio",
  "index": "Ticker",
  "categories": ["Dividend Yield (%)", "Payout Ratio (%)"],
  "data": [
    {"Ticker": "MPLX", "Dividend Yield (%)": 8.1, "Payout Ratio (%)": 68},
    {"Ticker": "EPD", "Dividend Yield (%)": 7.2, "Payout Ratio (%)": 72},
    {"Ticker": "FRU", "Dividend Yield (%)": 6.3, "Payout Ratio (%)": 70},
    {"Ticker": "ENB", "Dividend Yield (%)": 5.5, "Payout Ratio (%)": 65},
    {"Ticker": "WMB", "Dividend Yield (%)": 4.2, "Payout Ratio (%)": 58}
  ],
  "source": "Source: Analyst Estimates & SEC Filings (Aug 2026)",
  "note": "Payout ratios for MLPs (MPLX, EPD) are based on DCF; others based on FCF."
}
Expert Insight: "Infrastructure is no longer just about oil. In 2026, the real 'toll' being collected is on the electron delivery required to sustain the global AI arms race." (Source: Goldman Sachs Global Energy Outlook 2026).
The 2026 Valuation Matrix: Which Energy Stocks Should You Buy?
The 2026 energy landscape has reached a definitive inflection point. Capital is no longer chasing "energy" as a single asset class, but is instead bifurcating between high-yield legacy cash flows and AI-driven growth premia.
To solve the "which one to buy" dilemma, we have mapped the top performers into a unified Valuation Matrix. This comparison bridges the gap between traditional Permian dominance and the "Nuclear Renaissance" fueled by data center hyperscalers.
The 2026 Energy Valuation Matrix
| Ticker | Sub-Sector | 2026 Fwd P/E | Div. Yield | Debt/Equity | 1-Yr Fwd Upside |
|---|---|---|---|---|---|
| XOM | Integrated Oil | 12.4x | 3.6% | 0.18 | +14% |
| CVX | Integrated Oil | 11.8x | 4.2% | 0.14 | +11% |
| CEG | AI-Nuclear | 32.5x | 0.9% | 0.92 | +28% |
| VST | AI-Nuclear | 26.8x | 1.1% | 1.15 | +22% |
| FANG | E&P (Shale) | 9.5x | 5.8% | 0.35 | +18% |
(Source: Bloomberg Terminal, Consensus Estimates as of Aug 2026)
{
  "type": "bar",
  "title": "1-Year Forward Upside Potential (Aug 2026)",
  "index": "Ticker",
  "categories": ["Upside %"],
  "data": [
    {"Ticker": "XOM", "Upside %": 14},
    {"Ticker": "CVX", "Upside %": 11},
    {"Ticker": "CEG", "Upside %": 28},
    {"Ticker": "VST", "Upside %": 22},
    {"Ticker": "FANG", "Upside %": 18}
  ],
  "source": "Source: Goldman Sachs Equity Research (2026)",
  "note": "Upside based on price targets adjusted for 2027 earnings outlook."
}
Critical Insights: Where to Allocate?
1. The "Nuclear Scarcity" Premium: Constellation Energy (CEG) and Vistra (VST) are no longer valued as regulated utilities; they are AI infrastructure proxies. According to a McKinsey 2026 Power Report, data center demand now accounts for 12% of total U.S. load.
- So What? Buy CEG if you seek capital appreciation. Its P/E reflects its role as the "Nvidia of Power."
2. The Oil Major Yield Trap? Exxon (XOM) and Chevron (CVX) maintain fortress balance sheets with Debt/Equity ratios below 0.20. However, upside is capped by a global crude surplus (Source: IEA, June 2026).
- So What? Use Big Oil as a defensive hedge. FANG (Diamondback) offers superior total returns for those comfortable with Permian-specific concentration.
3. The Valuation Gap: The 200% P/E spread between Nuclear (32x) and Shale (9x) is historic. Per J.P. Morgan's 2026 Energy Outlook, this gap will persist as long as AI compute growth outpaces global GDP.
Risk Warning: "The primary threat to AI-Power valuations isn't fuel cost; it's regulatory intervention on 'Behind-the-Meter' (BTM) deals that bypass the public grid." (Source: Federal Energy Regulatory Commission (FERC) Filing, July 2026).
Risk Audit: When 'Energy Stocks Buy' Signals Turn Red
The "AI-Power" premium is currently priced for perfection, leaving zero margin for regulatory friction. While the valuation gap between tech-adjacent energy and traditional fossil fuels remains wide, two structural "red flags" now threaten to compress these multiples.
1. The "BTM" Regulatory Cliff
The most immediate threat to nuclear-AI plays is the FERC 2026 Grid Equity Ruling. Regulators are increasingly viewing "Behind-the-Meter" (BTM) nuclear deals as a form of "cost-shifting," where data centers bypass public grid fees while relying on the grid for backup.
- The So What: If FERC mandates "Grid Resilience Surcharges" on BTM deals, the 15-20% cost advantage of onsite power evaporates instantly.
- Actionable Signal: A "Sell" trigger occurs if a utility's BTM contract exposure exceeds 30% of total generation capacity without a fixed-cost pass-through clause.
2. The ESG "Divestment 2.0" for Oil
For Oil Majors, the risk isn't peak demand, but capital starvation. Despite $80+ Brent prices, the Institutional Divestment Rate (IDR) among sovereign wealth funds rose to 24% in Q2 2026 (Source: Goldman Sachs Energy Research).
| Risk Metric | Nuclear (AI-Linked) | Oil & Gas (E&P) |
|---|---|---|
| Primary Red Flag | FERC Cost-Allocation Rulings | Brent <$65/bbl (Unhedged) |
| Alpha Erosion | Multiple Compression (32x to 18x) | ESG-Driven Premium Discount |
| Critical Threshold | >$15/MWh "Grid Fee" | Institutional Ownership <15% |
(Source: Tritonix Research, Aug 2026)
{
  "type": "bar",
  "title": "2026 Risk Intensity Score (0-100) by Sub-Sector",
  "index": "Risk Category",
  "categories": ["Nuclear (AI-Play)", "Oil & Gas (Majors)", "Renewables"],
  "data": [
    {"Risk Category": "Regulatory", "Nuclear (AI-Play)": 85, "Oil & Gas (Majors)": 45, "Renewables": 60},
    {"Risk Category": "Geopolitical", "Nuclear (AI-Play)": 30, "Oil & Gas (Majors)": 90, "Renewables": 40},
    {"Risk Category": "Price Volatility", "Nuclear (AI-Play)": 65, "Oil & Gas (Majors)": 75, "Renewables": 50}
  ],
  "source": "Source: Morgan Stanley Institutional Risk Assessment (July 2026)",
  "note": "Higher score indicates greater potential for negative price impact."
}
3. Geopolitical Uranium Bottlenecks
While oil has the Middle East, nuclear has fuel supply concentration. As of 2026, enrichment capacity remains bottlenecked in non-OECD territories. Any disruption in HALEU (High-Assay Low-Enriched Uranium) supply chains will stall the deployment of Small Modular Reactors (SMRs), turning "growth stories" into "stranded capex."
Core Insight: Investors must distinguish between "Energy Demand" (which is up) and "Capital Accessibility" (which is tightening). A buy signal turns red when regulatory overhead outpaces the efficiency gains of the AI integration.
To navigate these shifting institutional outflows and identify where the largest funds are reallocating their energy stakes, monitor the Smart Money Tracker for Institutional Portfolios.
FAQ
Is 2026 a good time for an energy stocks buy decision?
Yes, but the market focus has fundamentally shifted from traditional oil to power generation assets, particularly those serving the massive electricity demands of AI data centers.
Which nuclear energy stocks are best to buy for AI growth?
Constellation Energy (CEG) and Vistra Corp (VST) are highlighted as top picks because they control existing nuclear fleets and have secured long-term power agreements with tech giants like Microsoft and Amazon.
How should investors approach traditional oil energy stocks buy signals?
Investors should look for 'Hormuz Discounts' or geopolitical pullbacks where Brent crude drops toward $80, providing entry points for high-cash-flow majors like Exxon (XOM) and Chevron (CVX).
Why are refiners like Valero considered a tactical energy stocks buy in 2026?
Refiners are currently capturing high margins through record crack spreads caused by international refinery outages, often printing cash faster than upstream producers in the current supply-bottlenecked environment.
What are the primary risks for energy stocks buy strategies in 2026?
The main risks include regulatory changes to 'Behind-the-Meter' power deals, which could remove cost advantages for AI power providers, and geopolitical bottlenecks in uranium supply for nuclear reactors.