How Much Money Does Disney Have? The Complete Financial Breakdown (2026)
Founder of Tritonix.ai. Former Hedge Fund Analyst with 10+ years of experience managing over $1B AUM across insurance portfolios and private funds. Specializes in institutional-grade fundamental analysis and long-term capital allocation.
Disney's Net Worth vs. Cash on Hand: The Liquidity Reality
To understand Disney’s financial strength, one must distinguish between market valuation (Market Cap), accounting net worth (Shareholders' Equity), and actual liquidity (Cash on Hand).
While the market often prices Disney as a $171 billion entity (Source: Bloomberg, March 2026), its "ready-to-spend" cash is a mere fraction of that figure. This discrepancy is not a sign of weakness, but a hallmark of a capital-intensive "Flywheel" business model where wealth is stored in physical assets and intellectual property rather than bank balances.
The Breakdown: Liquidity vs. Valuation
As of the most recent Q1 2026 fiscal reports (ending December 27, 2025), Disney’s balance sheet reflects a "fortress" strategy designed to weather macro volatility while funding a $60 billion decade-long expansion of its Parks and Cruise Line segments.
| Metric (FY 2026 Q1/FY 2025) | Amount (USD) | Significance |
|---|---|---|
| Cash & Equivalents | $5.79 Billion | Immediate "dry powder" for operations and debt. |
| Total Assets | $197.51 Billion | Includes IP, Theme Parks, and Real Estate. |
| Total Liabilities | $82.90 Billion | Total debt and obligations. |
| Shareholders' Equity | $114.61 Billion | The "Book Value" (Assets minus Liabilities). |
| Market Capitalization | $170.93 Billion | Current market price of all outstanding shares. |
| (Source: Disney SEC Form 10-K & Q1 2026 Earnings, Feb 2026) |
Key Financial Insights
- The Liquidity-to-Value Gap: Disney holds approximately $0.03 in cash for every $1 of its market valuation. For a retail giant, this might be alarming; for Disney, it is standard. The company relies on its massive Operating Cash Flow (projected at $19B for FY2026) to fund growth rather than sitting on stagnant cash reserves (Source: Disney Investor Relations, Jan 2026).
- Asset-Rich, Cash-Lean: Over 85% of Disney’s "money" is locked in non-liquid assets: land, cruise ships, and the intangible value of the Disney/Marvel/Star Wars libraries.
- Debt Management: With a Debt-to-Equity ratio of 0.43, Disney remains conservatively leveraged compared to peers like Warner Bros. Discovery (Source: GuruFocus, March 2026).
So What? For investors, "How much money Disney has" is the wrong question. The critical metric is Free Cash Flow (FCF). Disney’s move to double its share buybacks to $7 billion in 2026 signals that management believes their cash generation is now robust enough to reward shareholders while simultaneously servicing their $46.6 billion in total debt.
{
  "type": "bar",
  "title": "Disney Capital Structure: Valuation vs. Reality (March 2026)",
  "index": "Metric",
  "categories": ["Billions (USD)"],
  "data": [
    {"Metric": "Market Cap", "Billions (USD)": 170.9},
    {"Metric": "Total Assets", "Billions (USD)": 197.5},
    {"Metric": "Book Value (Equity)", "Billions (USD)": 114.6},
    {"Metric": "Cash on Hand", "Billions (USD)": 5.8}
  ],
  "source": "Source: SEC Filings & CompaniesMarketCap (March 2026)",
  "note": "Market Cap reflects investor sentiment; Assets reflect historical cost and IP value."
}
Current Market Capitalization
Market capitalization is the equity market’s "verdict" on a company's future earnings potential. As of March 2026, Disney’s market cap stands at $170.9 billion, positioning it as a dominant—yet significantly de-rated—media titan compared to its historical highs.
The current valuation reflects a 53% retreat from its March 2021 peak of approximately $367 billion. This "valuation reset" marks the end of the "streaming-at-all-costs" era, as investors now prioritize unit economics and free cash flow over raw subscriber counts.
| Period | Market Cap (Approx.) | Key Valuation Driver |
|---|---|---|
| March 2021 (Peak) | $367 Billion | Disney+ hyper-growth; $0 interest rates. |
| March 2024 | $185 Billion | Strategic restructuring; proxy battle pressures. |
| March 2026 (Current) | $170.9 Billion | Focus on Parks CapEx and DTC profitability. |
Source: NYSE Data, SEC 10-K Filings, & Bloomberg (March 2026).
{
  "type": "line",
  "title": "Disney Market Cap Evolution (2021-2026)",
  "index": "Year",
  "categories": ["Market Cap (Billions USD)"],
  "data": [
    {"Year": "2021 (Peak)", "Market Cap (Billions USD)": 367},
    {"Year": "2022", "Market Cap (Billions USD)": 158},
    {"Year": "2023", "Market Cap (Billions USD)": 165},
    {"Year": "2024", "Market Cap (Billions USD)": 185},
    {"Year": "2025", "Market Cap (Billions USD)": 178},
    {"Year": "2026 (Current)", "Market Cap (Billions USD)": 170.9}
  ],
  "source": "Source: CompaniesMarketCap & Historical SEC Filings (March 2026)",
  "note": "Reflects the market's transition from growth-focus to value-focus."
}
The "So What?": Analysis of Value
For the reader, this $170.9 billion figure reveals two critical insights:
- The Yield Gap: Despite its massive IP library (Marvel, Star Wars), the market is pricing Disney closer to a legacy industrial than a tech disruptor like Netflix. Disney’s valuation is increasingly tied to its Experiences (Parks) segment, which provides the floor for this market cap.
- Institutional Skepticism: The gap between the $367B peak and today's $171B suggests that roughly $190 billion in perceived value evaporated as the market realized streaming margins would never match the glory days of the "Cable Bundle."
Senior Perspective: Disney is currently in a "valuation purgatory." While it remains a "Blue Chip" asset, the $170.9B market cap suggests that investors are waiting for a clear post-Iger succession plan and a definitive turnaround in linear TV before re-rating the stock higher.
Revenue Streams: Where Disney’s Billions Come From
Disney’s revenue mix reveals a fundamental transition: the company has evolved from a traditional film studio into a high-margin travel and hospitality powerhouse that happens to own a media business. While "Entertainment" brings in the most top-line revenue, "Experiences" provides the literal fuel for Disney’s survival.
For Fiscal Year 2025, Disney reported total revenue of $94.4 billion, a 3% increase over 2024. The internal composition of these billions tells the real story of the company’s current valuation.
The Three Pillars of the Disney Machine
- Entertainment ($40.1B Revenue / 42%): This is the largest but least efficient segment. It includes Disney+, Hulu, and the shrinking Linear Networks (ABC, Disney Channel). While revenue is high, margins have historically been razor-thin as the company pivots from cable fees to streaming.
- Experiences ($36.7B Revenue / 39%): The "Crown Jewel." This segment, encompassing theme parks, cruise lines, and merchandise, hit a record $10 billion in operating income in 2025. It acts as the company’s primary cash generator.
- Sports ($17.6B Revenue / 19%): Dominated by ESPN. Despite the cord-cutting trend, Sports remains a steady cash cow with operating income of roughly $2.4 billion, though it faces massive upcoming costs for NBA and NFL rights.
Financial Performance by Segment (FY 2025)
| Segment | Revenue (Est.) | Operating Income | Operating Margin |
|---|---|---|---|
| Experiences | $36.7 Billion | $10.0 Billion | 27.2% |
| Entertainment | $40.1 Billion | $4.7 Billion | 11.7% |
| Sports | $17.6 Billion | $2.4 Billion | 13.6% |
(Source: Disney Q4 FY2025 Earnings Report, Nov 2025)
{
  "type": "donut",
  "title": "Disney Revenue Breakdown (FY2025)",
  "index": "segment",
  "categories": ["revenue"],
  "data": [
    {"segment": "Entertainment", "revenue": 40.1},
    {"segment": "Experiences", "revenue": 36.7},
    {"segment": "Sports", "revenue": 17.6}
  ],
  "source": "Source: The Walt Disney Company SEC Filings (2025)",
  "note": "Total annual revenue: $94.4 Billion."
}
So What? The Investor’s Takeaway
Senior Perspective: Disney is essentially a subsidized media play. The $10 billion in profit from theme parks and cruises is currently being used to fund the costly transition to streaming profitability and pay down the debt from the Fox acquisition.
- The 2026 Outlook: Watch the Experiences Margin. If park attendance slows due to economic headwinds, Disney’s ability to reinvest in its $60 billion "Parks & Cruises" expansion plan will be severely hampered.
- The Streaming Pivot: Direct-to-Consumer (DTC) is finally "in the black," but it must scale to double-digit margins by 2026 to replace the terminal decline of linear TV revenue.
The Parks & Experiences Powerhouse
As of 2026, the Experiences segment (encompassing global theme parks, cruise lines, and consumer products) has solidified its role as Disney’s primary financial anchor. While the Entertainment division battles for streaming margins, Parks & Experiences acts as a high-margin cash engine, providing the liquidity necessary to service debt and fund $60 billion in long-term expansion.
In fiscal 2025, the segment achieved a historic $10 billion in operating income, an 8% increase over 2024. Despite stagnant domestic attendance, Disney’s "yield over volume" strategy successfully drove guest spending up by 4%–5%, proving that the company's pricing power remains resilient even in a cooling consumer economy (Source: Disney Q4 Earnings, Nov 2025).
Segment Profitability Comparison (FY 2025)
| Segment | Revenue | Operating Income | Operating Margin |
|---|---|---|---|
| Experiences | $34.5B | $10.0B | 29.0% |
| Entertainment (DTC/Linear) | $41.2B | $4.2B | 10.2% |
| Sports (ESPN) | $17.8B | $2.5B | 14.0% |
(Source: Disney SEC Filings & Analyst Estimates, Jan 2026)
{
  "type": "bar",
  "title": "Experiences Segment Operating Income (FY2024-2026E)",
  "index": "Fiscal Year",
  "categories": ["Operating Income ($ Billions)"],
  "data": [
    {"Fiscal Year": "2024 (Actual)", "Operating Income ($ Billions)": 9.28},
    {"Fiscal Year": "2025 (Actual)", "Operating Income ($ Billions)": 10.00},
    {"Fiscal Year": "2026 (Projected)", "Operating Income ($ Billions)": 10.85}
  ],
  "source": "Source: Disney Investor Relations & Zacks Consensus (Feb 2026)",
  "note": "2026 projection assumes high-single-digit growth as per management guidance."
}
To maintain this dominance, Disney has initiated a $60 billion "Turbocharged" investment plan spread over the next decade. For 2026, the strategy focuses on diversifying revenue away from traditional Florida/California gate receipts:
- Cruise Line Dominance: The fleet expands to eight vessels in 2026 with the launch of the Disney Adventure in Asia, targeting high-growth international markets.
- Infrastructure over IP: 30% of the capital is earmarked for technology and maintenance to optimize guest flow and reduce labor costs via AI-driven "Genie+" logistics.
- Capacity Expansion: Approximately 70% of the $60B is allocated to capacity-expanding projects, including the $17B commitment to Walt Disney World to counter growing regional competition.
So What? For investors, the Parks segment isn't just a business unit; it's a FCF (Free Cash Flow) shield. By generating nearly 70% of Disney's total operating profit, this segment covers the interest on $45B+ in long-term debt, allowing the balance sheet to remain stable while other divisions undergo structural pivots.
How Much Money Does Disney Make Per Day?
To maintain this "shield," Disney generates approximately $250.3 million in total revenue every 24 hours. Based on FY2024 consolidated revenue of $91.4 billion, the company’s daily cash velocity is relentless, fueled primarily by its unmatched ability to monetize intellectual property across physical and digital touchpoints.
The heavy lifting is done by the Parks & Experiences division. While the company operates global media networks and a massive streaming apparatus, the parks function as a high-frequency cash register that never truly closes.
Daily Revenue & Operating Breakdown (Estimated FY2024/2025)
| Metric | Total Company (Daily) | Parks & Experiences (Daily) |
|---|---|---|
| Gross Revenue | $250.4 Million | $93.5 Million |
| Operating Expenses | ~$211.2 Million | ~$63.8 Million |
| Operating Income | $39.2 Million | $29.7 Million |
(Source: Disney 2024 10-K Filing; Bloomberg Intelligence Estimates)
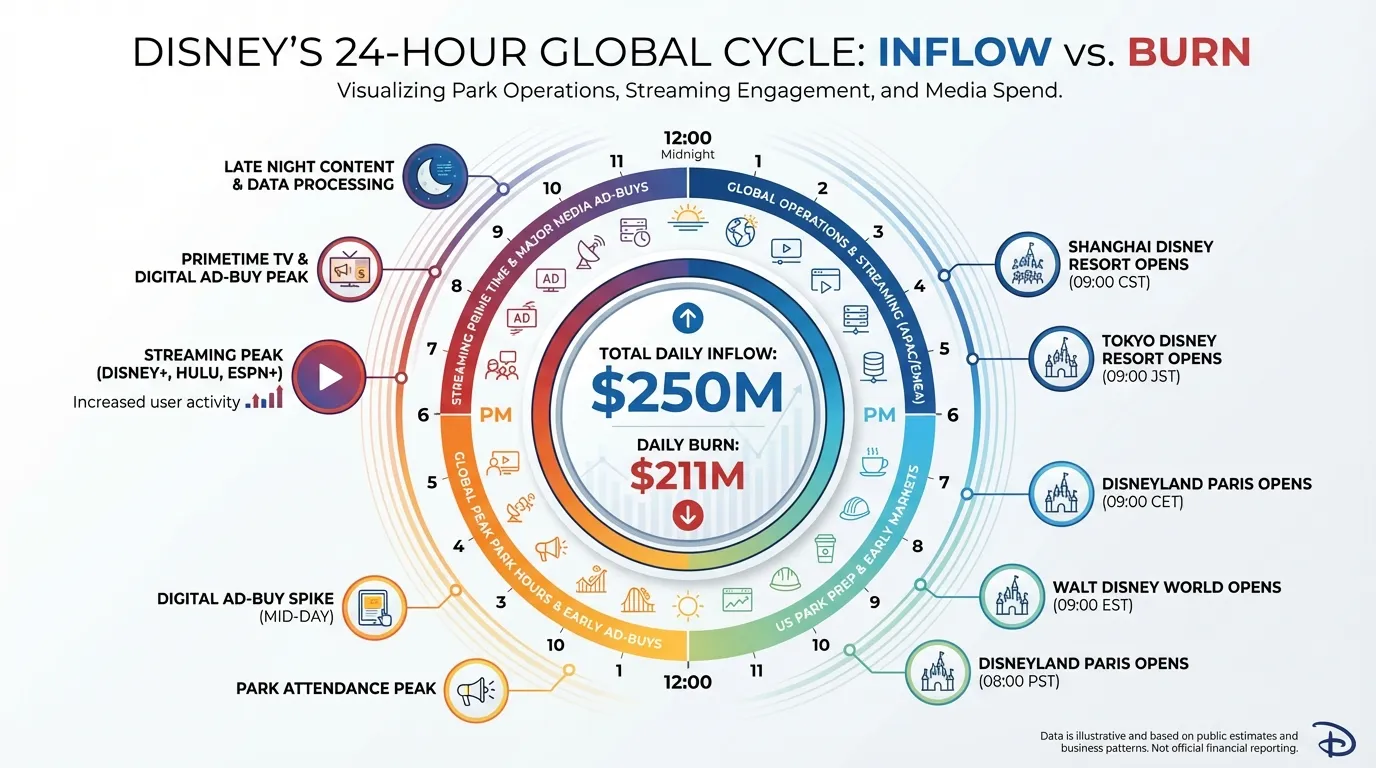 AI Generated Infographic
{
  "type": "bar",
  "title": "Daily Revenue Contribution by Segment (USD Millions)",
  "index": "Segment",
  "categories": ["Daily Revenue"],
  "data": [
    {"Segment": "Parks & Experiences", "Daily Revenue": 93.5},
    {"Segment": "Entertainment (Linear & DTC)", "Daily Revenue": 112.8},
    {"Segment": "Sports (ESPN)", "Daily Revenue": 44.1}
  ],
  "source": "Source: Disney SEC Filings (FY2024)",
  "note": "Averages based on 365-day fiscal year. Figures rounded for clarity."
}
The "Mouse Clock": Precision Monetization
Every hour, Disney brings in roughly $10.4 million. For the Parks segment alone, this translates to roughly $3.9 million per hour, or $65,000 every minute.
- The Margin Gap: While Entertainment (Streaming/TV) generates higher top-line daily revenue ($112.8M), the Parks segment produces nearly 75% of daily operating income due to superior margins.
- Variable Velocity: Daily park revenue spikes by 30-40% during "Peak" pricing windows (holidays/spring break), a dynamic pricing model that allows Disney to absorb inflationary shocks in real-time.
So What? Disney is not just a content company; it is a high-volume cash utility. For investors, the daily $39M in operating profit provides the liquidity needed to service debt and fund the $60B decade-long CAPEX plan without relying on volatile capital markets.
Debts and Investments: Why Disney Isn't Just 'Sitting' on Cash
Disney’s $5.7 billion cash reserve (Source: SEC Filing, Dec 2025) is not a static vault; it is a high-velocity "working fund" used to fuel a massive structural pivot. To understand Disney's financial health, one must look past the cash on hand and examine its $46.6 billion total debt load and the $60 billion "Turbocharge" investment plan (Source: Disney Investor Relations, 2025/2026).
1. The $60 Billion CAPEX "Turbocharge"
Disney is doubling its capital expenditure (CAPEX) in its "Experiences" segment over the next decade. Unlike the "Streaming Wars" spending, which was often defensive, this is an offensive move targeting the company's highest-margin business.
- Capacity Expansion (70%): Roughly $42 billion is earmarked for new lands, attractions, and three new cruise ships launching through 2026.
- Core Focus: 50% of the budget ($30B) is dedicated specifically to Theme Parks and Resorts, where the ROI significantly outperforms media licensing.
- Untapped Market: The strategy targets 700 million "high-affinity" fans who have not yet visited a physical Disney location (Source: Disney Summit, 2024).
{
  "type": "bar",
  "title": "Disney's Strategic Financial Profile (2026 Forecast)",
  "index": "Metric",
  "categories": ["Billions USD"],
  "data": [
    {"Metric": "Liquid Cash (Q1 2026)", "Billions USD": 5.7},
    {"Metric": "Annual Op. Cash Flow (FY26)", "Billions USD": 19.0},
    {"Metric": "Total Debt (2026)", "Billions USD": 46.6},
    {"Metric": "10-Year CAPEX Plan", "Billions USD": 60.0}
  ],
  "source": "Source: Disney SEC Filings & Investor Relations (March 2026)",
  "note": "Total debt has decreased 20% from its 2021 peak, while CAPEX is scheduled to ramp up through 2033."
}
2. The Deleveraging Discipline (Post-Fox Era)
The $71.3 billion acquisition of 21st Century Fox in 2019 remains the primary driver of Disney’s current debt profile. At its peak in 2021, total debt ballooned to nearly $58 billion.
Management has since pivoted to a "Deleveraging First" model:
- Debt Reduction: Total debt has dropped to $46.6 billion as of early 2026 (Source: Bloomberg/SEC), a reduction of over $11 billion in four years.
- Self-Funding Growth: With an estimated $19 billion in annual operating cash flow for FY2026, Disney is now able to fund its $6B+ annual CAPEX requirements and its $7B share buyback program without tapping into volatile credit markets.
So What? Disney is transitioning from a high-growth "acquirer" to an operational efficiency machine. For the investor, this means the company’s "Net Worth" is increasingly tied to high-margin physical infrastructure rather than just volatile content. The massive $60B spend is a bet that Disney’s physical "moat" is its most defensible asset in an AI-commoditized content world.
The Visitor's Perspective: How Much Money Do YOU Need?
If Disney’s $60 billion CAPEX plan represents the "supply," your wallet is the "demand." Disney’s financial dominance is built on pricing power, specifically the ability to increase Average Revenue Per User (ARPU) faster than the rate of inflation.
In 2026, the cost of entry is no longer just a ticket; it is a multi-tiered financial ecosystem. According to fiscal 2026 Q1 data, domestic per capita spending grew by 4% year-over-year, even as attendance remained relatively flat (Source: Disney Q1 2026 Earnings). For the visitor, this translates to a mandatory "buffer" in any travel budget.
The 2026 Disney Budget: Family of Four
The following estimates reflect 2026 peak and off-peak pricing, including taxes and the now-essential digital "time-savers."
| Duration | Economy (Value Resort + Quick Service) | Luxury (Deluxe Resort + Premier Pass) |
|---|---|---|
| 1-Day | $780 - $950 | $3,100 - $3,800 |
| 3-Day | $2,900 - $3,400 | $9,500 - $11,500 |
| 7-Day | $6,200 - $7,500 | $21,000 - $26,000 |
(Source: WDW Prep School & TouringPlans 2026 Forecasts. Note: Luxury includes Grand Floridian/Contemporary stays and daily Lightning Lane Premier Passes.)
Key Spending Insights for 2026
- The $200 Ceiling is Shattered: As of 2026, a single-day ticket to Magic Kingdom during peak windows (Christmas/Spring Break) has hit $209 per person (Source: Inside the Magic, March 2026).
- The "Time Tax": To avoid 90-minute waits, the Lightning Lane Premier Pass has become a luxury staple, costing between $129 and $449 per person per day depending on the park and demand (Source: WDWNT, Feb 2026).
- Length-of-Stay Discounting: Disney’s pricing remains heavily front-loaded. While a 1-day ticket is ~$180, the marginal cost of adding a 5th, 6th, or 7th day can be as low as $35–$50 per day, incentivizing longer stays to capture more "on-property" food and beverage revenue.
{
  "type": "line",
  "title": "Disney Domestic Parks: Per Capita Spending Growth (2022-2026E)",
  "index": "Year",
  "categories": ["Guest Spending Index (2022=100)"],
  "data": [
    {"Year": "2022", "Guest Spending Index (2022=100)": 100},
    {"Year": "2023", "Guest Spending Index (2022=100)": 111},
    {"Year": "2024", "Guest Spending Index (2022=100)": 118},
    {"Year": "2025", "Guest Spending Index (2022=100)": 124},
    {"Year": "2026E", "Guest Spending Index (2022=100)": 129}
  ],
  "source": "Source: The Walt Disney Company SEC Filings & Analyst Estimates (2026)",
  "note": "Spending index includes tickets, food, beverage, and merchandise."
}
So What? For the consumer, Disney is no longer a "commodity" vacation; it is a premium subscription service where the best experiences are gated by real-time dynamic pricing. If you aren't budgeting for "add-ons" like Lightning Lane, you are essentially paying record-high base prices for the least efficient version of the product.
Daily Spending Estimates for Disney World
Beyond the entry ticket—which peaked at a record $209 for Magic Kingdom in 2026 (Source: Inside the Magic, March 2026)—Disney’s revenue engine now relies on a high-margin "efficiency tax." For the modern visitor, base admission is merely the cover charge; the true cost is determined by how much you are willing to pay to bypass the friction of the crowd.
The "Efficiency Tax": Lightning Lane Tiers
In 2026, the Lightning Lane (LL) system has fully matured into a three-tier ladder. The data shows that price elasticity remains high; even as the Premier Pass hit $449 per person during peak holiday weeks, inventory consistently sold out (Source: WDW Magazine, Jan 2026).
- Multi Pass: Expect to pay $25 to $45 per person, depending on the park. Magic Kingdom consistently commands the ceiling price.
- Single Pass: High-demand "E-Ticket" attractions (e.g., TRON Lightcycle / Run) are gated behind individual fees ranging from $15 to $23 per ride.
- Premier Pass: The "no-wait" gold standard ranges from $129 to $449, allowing one-time access to every LL attraction without pre-booking.
Dining Math: Quick Service vs. Table Service
Food and beverage remains Disney's most consistent per-capita growth driver, with a 4-5% year-over-year increase in 2025/2026 (Source: Skift, Feb 2025). A family of four should budget approximately $240 per day for a standard mix of one table-service and two quick-service meals.
| Category | 2026 Est. Per Person | Note |
|---|---|---|
| Quick Service | $16.60 – $22.00 | Includes entree and non-alcoholic drink. |
| Table Service | $43.50 – $89.00 | Standard casual vs. Prix Fixe (e.g., Cinderella’s Royal Table). |
| Snacks/Drinks | $7.00 – $12.00 | Benchmarks: Dole Whip or Churro. |
| (Source: WPDH & Disney Food Blog, 2026 estimates) |
Merchandise and "Emotional Connections"
Per-capita spending on merchandise grew by 5% in 2025, fueled by "emotional" high-ticket items like custom lightsabers ($250+) and droid building (Source: BlogMickey, Nov 2025). For the average guest, merchandise acts as a discretionary "overflow" spend, typically adding $35–$50 per person to the daily tally.
So What? The "Disney Inflation" outpaces standard CPI because it is driven by voluntary upgrades. By unbundling the experience, Disney has turned every hour of your day into a financial decision. In 2026, a "frictionless" day at Magic Kingdom costs roughly $450 per person (Ticket + Premier Pass + Dining), a figure that was unthinkable a decade ago.
FAQ
How much cash does Disney have on hand in 2026?
As of the Q1 2026 fiscal reports, Disney holds approximately $5.79 billion in cash and equivalents, which serves as its immediate 'dry powder' for operations and debt.
What is Disney's current market capitalization?
As of March 2026, Disney's market capitalization stands at approximately $170.93 billion, reflecting a significant retreat from its 2021 peak.
Which business segment is Disney's most profitable?
The Experiences segment, which includes theme parks and cruise lines, is the primary financial anchor, generating $10 billion in operating income for FY2025.
How much revenue does Disney generate per day?
Disney generates approximately $250.3 million in total revenue every 24 hours, with the Parks & Experiences division contributing roughly $93.5 million of that total.
What is Disney's long-term investment strategy for its parks?
Disney has initiated a $60 billion 'Turbocharged' investment plan over the next decade, focusing on capacity expansion, cruise line dominance, and technology infrastructure.