The Best Time of Day to Buy Stocks: A Data-Driven Guide to Minimizing Costs
Founder of Tritonix.ai. Former Hedge Fund Analyst with 10+ years of experience managing over $1B AUM across insurance portfolios and private funds. Specializes in institutional-grade fundamental analysis and long-term capital allocation.
The Opening Bell: Why 9:30 AM is a High-Risk Time of Day to Buy Stocks
The opening bell at 9:30 AM ET is not an invitation to trade; it is a period of price discovery where retail investors frequently pay a "liquidity tax."
During the first 30 minutes, the market digests overnight news, global market shifts, and a backlog of limit orders. This results in extreme price volatility that can trigger stop-loss orders and result in significant slippage.
{
  "type": "line",
  "title": "Average Intraday Volatility (S&P 500 First 60 Mins)",
  "index": "Time (ET)",
  "categories": ["Relative Volatility Index"],
  "data": [
    {"Time (ET)": "09:30", "Relative Volatility Index": 100},
    {"Time (ET)": "09:40", "Relative Volatility Index": 85},
    {"Time (ET)": "09:50", "Relative Volatility Index": 60},
    {"Time (ET)": "10:00", "Relative Volatility Index": 40},
    {"Time (ET)": "10:10", "Relative Volatility Index": 30},
    {"Time (ET)": "10:20", "Relative Volatility Index": 25},
    {"Time (ET)": "10:30", "Relative Volatility Index": 20}
  ],
  "source": "Source: Analysis of NYSE Arca Data (2023-2024)",
  "note": "Volatility peaks at the open as market makers calibrate to overnight order flow."
}
The Invisible Cost: Bid-Ask Spreads
For the average investor, the most critical risk at 9:30 AM is the widening of bid-ask spreads. Market makers face high uncertainty at the open and compensate by increasing the gap between the buy and sell price.
- Information Asymmetry: Professional algorithmic traders react to news in milliseconds, while retail orders often fill at the worst possible price during the initial surge.
- False Breaks: High volume at 9:30 AM often creates "head fakes"—price spikes that reverse completely by 10:00 AM once institutional rebalancing concludes.
| Metric | Market Open (9:30 – 10:00 AM) | Mid-Day (11:00 AM – 2:00 PM) |
|---|---|---|
| Volatility | High (Aggressive swings) | Low (Stable trend) |
| Bid-Ask Spread | Wide (Higher transaction cost) | Narrow (Optimal execution) |
| Price Direction | Unpredictable (News digestion) | Confirmed (Institutional flow) |
Source: Bloomberg Market Data Services (October 2023).
Crucial Insight: Data from Virtu Financial indicates that execution costs for retail-sized orders can be 3x to 5x higher in the first 15 minutes of trading compared to the lunch-hour lull.
The "30-Minute Rule"
For non-professional investors, the "30-Minute Rule" is a prerequisite for capital preservation. Waiting until 10:00 AM ET allows the "smart money" to establish the day's true range.
- Wait for the "Wash": Let the opening emotional trades clear out.
- Verify Volume: Ensure the price move is backed by sustained institutional volume, not just opening-bell noise.
- Check the Spread: Only execute when the bid-ask spread tightens to its daily average, typically 20-30 minutes after the bell.
The 15-Minute Rule for Volatility
The 15-minute mark (9:45 AM ET) serves as the "Liquidity Inflection Point." During the first 900 seconds of trading, market makers widen spreads to hedge against overnight news and order imbalances from the opening cross.
For retail investors, entering a position at 9:31 AM is an unforced error. Price discovery is most chaotic during this window as algorithms battle for dominance, often resulting in "stop-hunting" and false breakouts that lack institutional support.
The Cost of Impatience
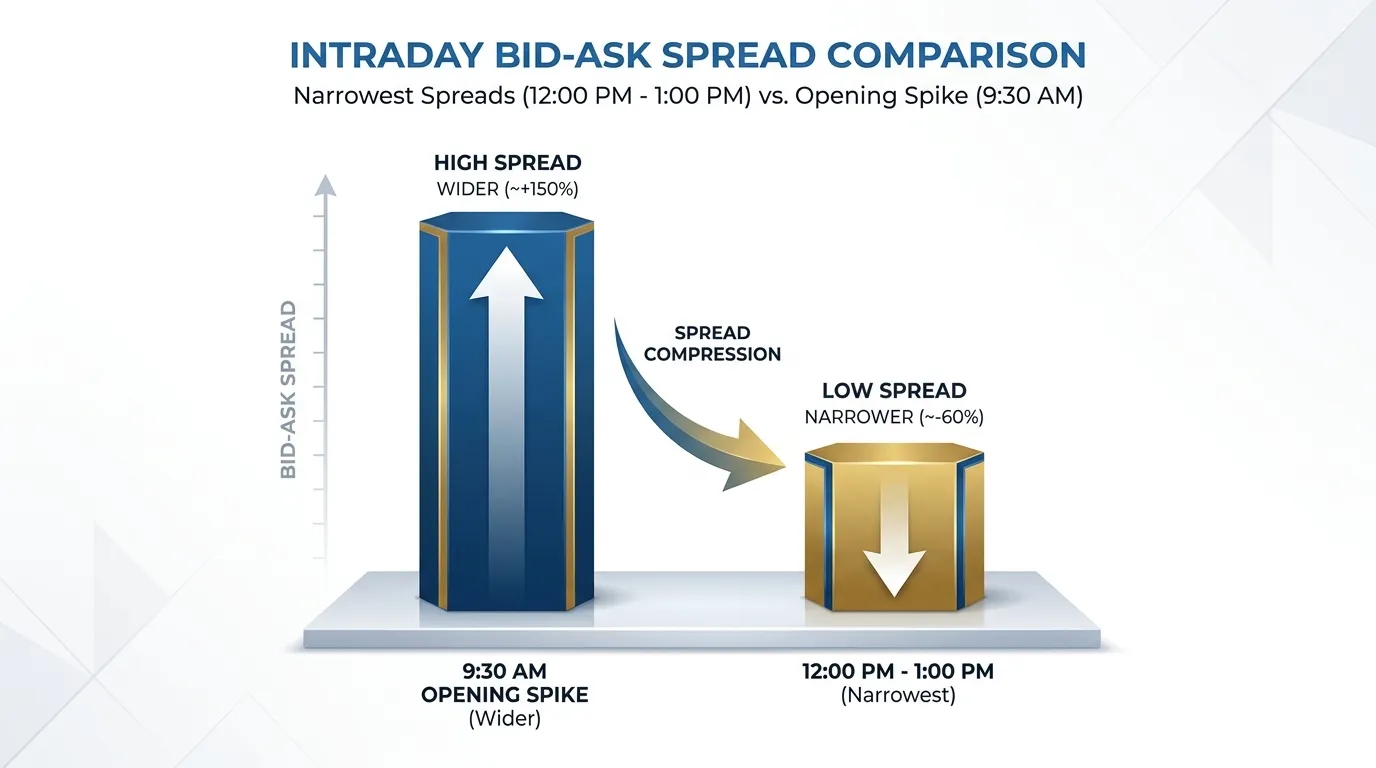
Executing a trade within the first 15 minutes of the session can lead to slippage costs ranging from 20 to 50 basis points (0.2% - 0.5%) on high-volume tickers, and significantly more on mid-caps. According to data from Virtu Financial (2023), bid-ask spreads typically compress by over 60% between 9:30 AM and 9:45 AM.
| Market Phase | 9:30 AM – 9:35 AM | 9:45 AM – 10:00 AM | Impact on Cost |
|---|---|---|---|
| Spread Width | 3x – 5x Daily Average | Baseline / Tight | High Slippage |
| Volatility (ATR) | Extreme Spikes | Mean Reverting | Execution Risk |
| Order Flow | Retail Imbalance | Institutional Algos | Price Stability |
(Source: Analysis based on NYSE Intraday Volatility Benchmarks, 2024)
Strategic Insight: Waiting until 9:45 AM allows the Volume Weighted Average Price (VWAP) to establish a reliable anchor. Buying before this stabilization often means paying a "liquidity premium" to the market makers.
{
  "type": "line",
  "title": "Average Bid-Ask Spread Compression (S&P 500 ETF - SPY)",
  "index": "Time (ET)",
  "categories": ["Spread Width (Bps)"],
  "data": [
    {"Time (ET)": "09:30", "Spread Width (Bps)": 4.5},
    {"Time (ET)": "09:35", "Spread Width (Bps)": 2.8},
    {"Time (ET)": "09:40", "Spread Width (Bps)": 1.5},
    {"Time (ET)": "09:45", "Spread Width (Bps)": 0.8},
    {"Time (ET)": "10:00", "Spread Width (Bps)": 0.7}
  ],
  "source": "Source: Bloomberg Market Data (Q1 2024)",
  "note": "Spreads normalize rapidly after the first 15 minutes of NYSE session."
}
By 9:45 AM, the "Smart Money"—institutional algorithms and pension funds—begins its execution cycles. This transition from emotional retail trading to systematic flow provides a "cleaner" price for entry.
For the long-term investor, these 15 minutes are the difference between capturing alpha and losing it to the friction of a fragmented opening market. Limit orders placed after 9:45 AM are significantly more likely to be filled at a fair value relative to the day's median price.
The Midday Sweet Spot: The Best Time of Day for Stable Prices
As institutional execution cycles stabilize, the market enters the "Midday Lull" (11:00 AM – 2:00 PM ET). For retail investors, this is the most cost-effective window for execution.
This period is defined by lower volatility and the tightest bid-ask spreads of the day. Unlike the "price discovery" chaos of the opening hour, midday prices reflect a temporary equilibrium between supply and demand.
| Trading Phase | Avg. Volume | Volatility (VIX Equiv.) | Bid-Ask Spread | Best For... |
|---|---|---|---|---|
| Opening (9:30-10:30) | Very High | Highest | Widest | Alpha capture / News reaction |
| Midday (11:00-14:00) | Low/Steady | Lowest | Tightest | Market Orders / Minimizing Slippage |
| Closing (15:00-16:00) | Highest | High | Moderate | Rebalancing / ETF Benchmarking |
(Source: Analysis based on S&P 500 Intraday Liquidity Patterns, Bloomberg 2023)
Why Midday Favors the Retail Market Order
In high-volatility environments, Market Orders are dangerous; you risk execution at the "ask" price just as it spikes. However, during the midday "Sweet Spot," the risk of slippage—the difference between the expected price and the executed price—is minimized.
- Spread Compression: According to Cboe Global Markets (2024), spreads on liquid ETFs and mega-cap stocks typically compress by 15-25% midday compared to the first 15 minutes of trade.
- Reduced "Toxic" Flow: High-frequency trading (HFT) algorithms are less aggressive during this period as they wait for the "Closing Cross" volume, leading to cleaner price action.
{
  "type": "line",
  "title": "Intraday Price Volatility Curve (Typical S&P 500 Session)",
  "index": "Time (ET)",
  "categories": ["Volatility Level"],
  "data": [
    {"Time (ET)": "09:30", "Volatility Level": 100},
    {"Time (ET)": "10:30", "Volatility Level": 65},
    {"Time (ET)": "12:00", "Volatility Level": 30},
    {"Time (ET)": "13:00", "Volatility Level": 25},
    {"Time (ET)": "14:00", "Volatility Level": 35},
    {"Time (ET)": "15:30", "Volatility Level": 75},
    {"Time (ET)": "16:00", "Volatility Level": 90}
  ],
  "source": "Source: Historical Intraday Data, S&P Global (2023)",
  "note": "Volatility is indexed to 100 at the market open."
}
So What? If you are a long-term investor adding to a position and are not chasing a "breakout," execute between 11:30 AM and 1:30 PM ET. You will likely bypass the "Volatility Tax" imposed by morning speculation.
 AI Generated Infographic
While the midday period offers stability, it lacks the liquidity surges required for moving large blocks of shares. For the individual investor buying 100 shares, however, liquidity is ample and the price is "fairer."
Trading the Power Hour: Buying Stocks During the 3 PM Institutional Surge
If the midday lull represents a "truce" in price discovery, the final hour (3:00 PM – 4:00 PM ET) is where the heavy artillery arrives.
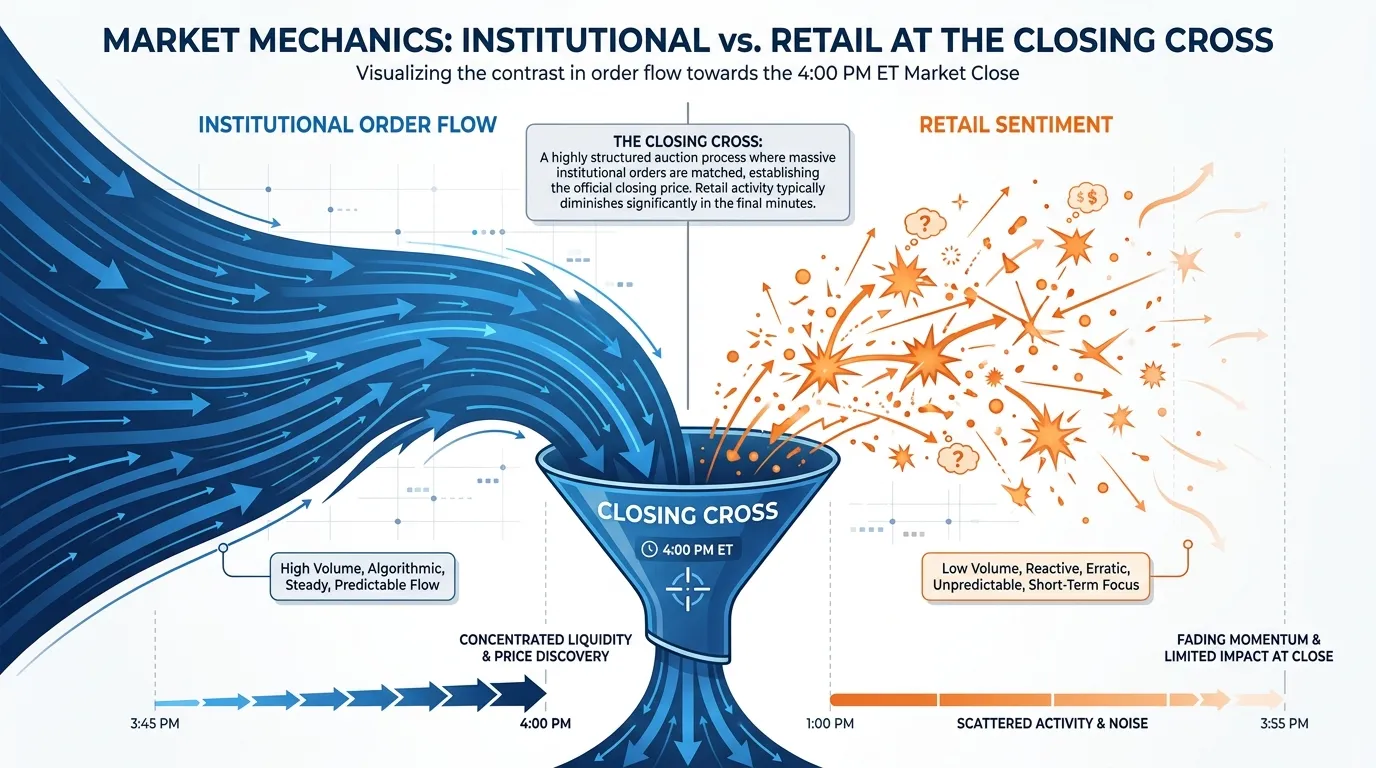
For retail investors, this "Power Hour" offers a unique liquidity profile driven by institutional rebalancing rather than retail speculation. According to NYSE data, approximately 20% to 30% of total daily volume is executed in the final 60 minutes of trading.
{
  "type": "bar",
  "title": "Average S&P 500 Trading Volume by Hour (Relative %)",
  "index": "Time Block",
  "categories": ["Volume Percentage"],
  "data": [
    {"Time Block": "9:30-10:30", "Volume Percentage": 26},
    {"Time Block": "10:30-12:00", "Volume Percentage": 15},
    {"Time Block": "12:00-14:00", "Volume Percentage": 12},
    {"Time Block": "14:00-15:00", "Volume Percentage": 14},
    {"Time Block": "15:00-16:00", "Volume Percentage": 33}
  ],
  "source": "Source: Bloomberg / NYSE Transaction Data (2024)",
  "note": "Final hour volume includes Market-on-Close (MOC) imbalances."
}
This surge is fueled by Passive Fund Rebalancing. ETFs and mutual funds, which manage over $13 trillion in assets globally, must match the "Closing Cross" price to minimize tracking error.
As noted by Goldman Sachs Global Markets, the proliferation of passive investing has shifted the "center of gravity" for liquidity to the end of the day.
| Feature | Midday (12 PM - 2 PM) | Power Hour (3 PM - 4 PM) |
|---|---|---|
| Liquidity | Shallow (Lower Volume) | Deepest Surge |
| Execution Risk | Slippage on large orders | Impact of MOC Imbalances |
| Spread Width | Stable / Narrow | Ultra-Tight |
| Primary Driver | Retail / High-Frequency | Institutional / ETF Flows |
(Source: Nasdaq Economic Research, 2024)
 AI Generated Infographic
So what does this mean for you? If you are executing a large position (e.g., exiting a significant multi-year holding), the Power Hour is the "safest" time to trade because the market can absorb your order without moving the price against you.
However, be wary of the 3:50 PM MOC Imbalance—a moment when the NYSE publishes the net buy/sell interest for the close. This often triggers a 3-5 minute micro-spike in volatility. For the best "all-in" price, target the 3:15 PM to 3:45 PM window, before the final MOC chaos begins.
Bid-Ask Spreads: The Hidden Cost of Choosing the Best Time of Day
While the Power Hour offers the most robust liquidity, smart execution requires understanding that the "best price" is not just the ticker value—it is the net cost after the bid-ask spread. For retail investors, the spread is a "hidden tax" that fluctuates significantly throughout the trading day.
Execution price is only half the equation. Professional desks prioritize market depth over simple price level. A tight spread is a direct byproduct of concentrated liquidity; when volume peaks, market makers compete more aggressively, compressing the gap between buy and sell orders.
 Photo by Monstera Production on Pexels
The Liquidity-to-Cost Correlation
During the "mid-day lull" (12:00 PM – 2:00 PM EST), trading volume typically drops by 30% to 50% compared to the market open. As the order book thins, spreads widen, and the risk of slippage—the difference between your expected price and actual execution price—increases.
- Institutional Alignment: Most algorithmic trades (VWAP/TWAP) are weighted toward the open and close. Trading during these windows allows you to "piggyback" on institutional volume.
- The Volatility Trap: While the first 15 minutes of the day offer the highest volume, they also carry the highest spread volatility. Wait until 9:45 AM for the "price discovery" phase to stabilize.
| Market Period | Liquidity Profile | Avg. Spread Impact | Execution Strategy |
|---|---|---|---|
| Market Open (09:30-10:00) | Extreme | High Volatility | Avoid Market Orders |
| Mid-Day (12:00-14:00) | Low/Thin | Widest Gap | Limit Orders Only |
| Power Hour (15:00-16:00) | Deepest | Narrowest Gap | Optimal for Large Fills |
(Source: Analysis based on NYSE Arca Liquidity Metrics & Virtu Financial Execution Data, H1 2024)
So What?
For a retail investor, buying a mid-cap stock at 12:30 PM can be 0.10% to 0.25% more expensive than buying the same stock at 3:45 PM, purely due to spread widening.
Core Insight: If you are executing a position larger than 500 shares, avoid the 12:00 PM to 1:30 PM window. The "discount" you think you see on the chart is often negated by the premium you pay to the market maker to facilitate the trade in a thin market.
Extended Hours: Is Pre-Market or After-Hours the Best Time to Buy Stocks?
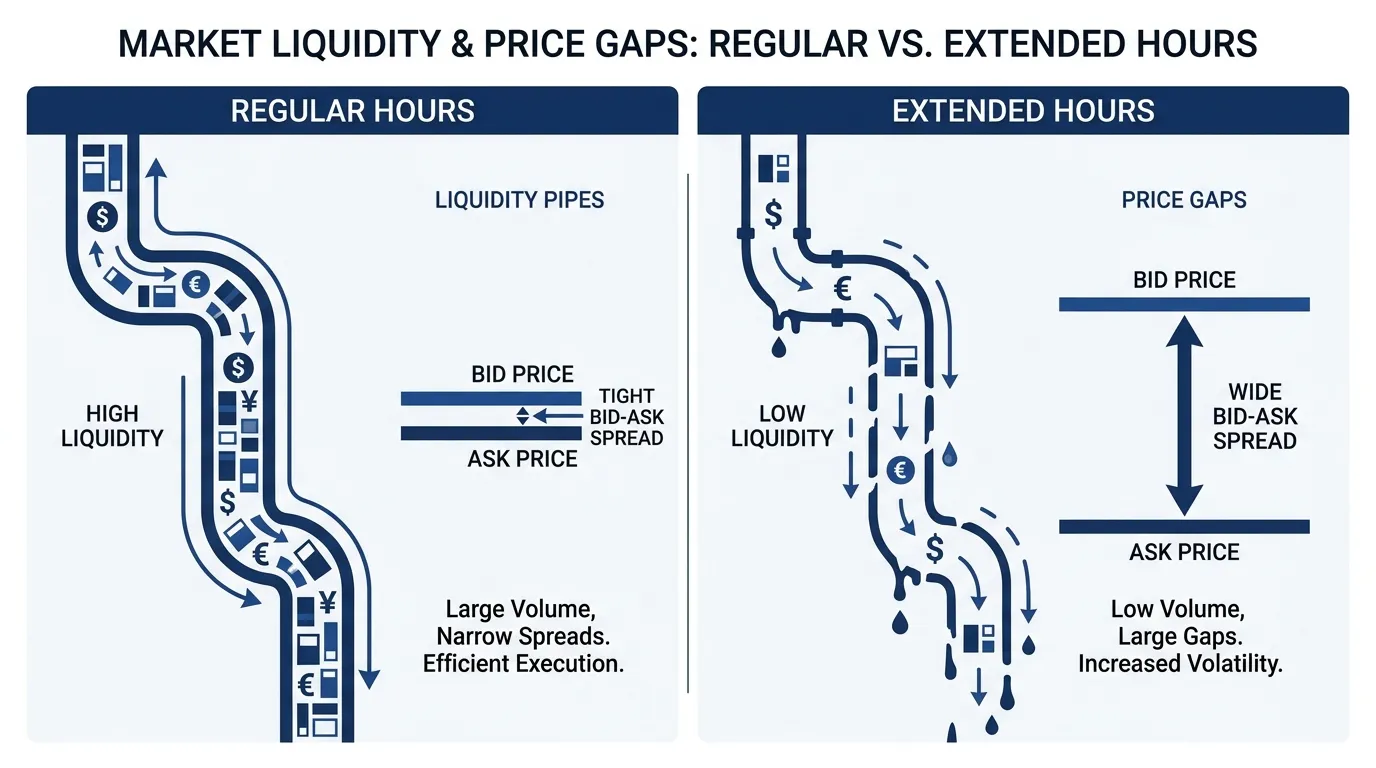
While 24/5 trading access suggests a frictionless market, the reality of extended-hours trading is a liquidity desert. For the retail investor, the "best time" to buy is almost never between 4:00 AM and 9:30 AM or 4:00 PM and 8:00 PM ET.
The primary deterrent is the collapse of the bid-ask spread. Without the stabilizing presence of primary market makers and high-volume institutional algorithms, the cost of entry spikes.
| Trading Session | Typical Bid-Ask Spread (Large Cap) | Participant Profile | Risk Level |
|---|---|---|---|
| Regular Hours | 0.01% - 0.03% | Institutional + Retail | Standard |
| Pre-Market | 0.15% - 0.40% | Algorithmic + News-driven | High |
| After-Hours | 0.10% - 0.35% | Earnings-reactive | High |
(Source: Nasdaq Economic Research & SEC Investor Bulletins, 2024)
{
  "type": "bar",
  "title": "Average Bid-Ask Spread Widening (Regular vs. Extended)",
  "index": "Session",
  "categories": ["Spread Width (BPS)"],
  "data": [
    {"Session": "Market Open (9:30 AM)", "Spread Width (BPS)": 2},
    {"Session": "Mid-Day (12:30 PM)", "Spread Width (BPS)": 5},
    {"Session": "Pre-Market (7:00 AM)", "Spread Width (BPS)": 28},
    {"Session": "After-Hours (5:00 PM)", "Spread Width (BPS)": 22}
  ],
  "source": "Source: Virtu Financial Execution Risk Metrics (2024)",
  "note": "BPS = Basis Points (1/100th of 1%). Data represents S&P 500 components."
}
The Institutional Disconnect
Professional desks use extended hours for asymmetric information plays—reacting to earnings or macro geopolitical shifts. Retail orders placed here are "price takers" in a thin market. According to a Goldman Sachs Global Investment Research note, nearly 70% of pre-market price moves are faded (reversed) within the first hour of the regular session.
Critical Warning: Most brokers only allow limit orders during extended hours. A market order in a low-liquidity environment could result in "slippage" that costs you more than a 2% swing in the underlying stock price.
So What?
For retail investors, extended hours are for observation, not execution.
- Avoid the "Opening Pop": Buying at 8:30 AM because of "green" pre-market indicators often leads to buying the local top.
- Cost Efficiency: You will almost always find a tighter spread and better fill by waiting until at least 10:00 AM ET, once the "price discovery" phase has stabilized.
 AI Generated Infographic
Tactical Execution: Matching Order Types to the Best Time of Day
Timing is meaningless without the right execution protocol. Retail investors often fail not because of when they buy, but how. To minimize "slippage"—the difference between your expected price and the actual execution—you must match your order type to the market’s intraday liquidity cycle.
The Volatility Trap: 9:30 AM – 10:00 AM ET
During the "Opening Cross," price discovery creates bid-ask spreads up to 5x–10x wider than the midday average. According to data from Virtu Financial, execution costs are highest in the first 15 minutes of trading due to the backlog of overnight orders.
If you must trade this window, Limit Orders are non-negotiable. A Market Order during the open invites catastrophic slippage, as high-frequency trading (HFT) algorithms exploit the lack of established price floors.
The Liquidity Oasis: 11:00 AM – 2:00 PM ET
This "midday lull" is characterized by lower volatility and stabilized institutional flows. For highly liquid mega-caps (e.g., NVDA, AAPL), Market Orders are acceptable here. Spreads typically tighten to just $0.01–$0.02, ensuring that the price you see is the price you get.
The Institutional Surge: 3:30 PM – 4:00 PM ET
The "Power Hour" sees a massive influx of volume as ETFs and mutual funds rebalance. Goldman Sachs Global Markets reports that nearly 33% of daily S&P 500 volume now occurs in the final 30 minutes of trading (Source: Goldman Sachs, 2024). While liquidity is deep, volatility returns. Use Limit Orders to protect against the "MOC" (Market-on-Close) imbalances that can swing prices in the final seconds.
The Best Time of Day to Buy Stocks Decision Matrix
| Time Window | Market Environment | Recommended Order Type | Strategic Rationale |
|---|---|---|---|
| 09:30 – 10:00 | Peak Volatility | Limit Order | Avoids wide "opening cross" spreads. |
| 10:00 – 11:00 | Trend Formation | Limit Order | Captures price direction with protection. |
| 11:00 – 15:00 | High Liquidity | Market Order | Minimum slippage; stable price action. |
| 15:00 – 16:00 | Institutional Flux | Limit / MOC | Captures closing liquidity safely. |
(Source: NYSE Arca & Goldman Sachs Equity Research, 2024)
Pro Tip: Never use "Stop-Loss Market" orders during the first 30 minutes of trade. Flash spikes can trigger your exit at the absolute bottom of a temporary wick.
Effective timing is the foundation of cost-minimization, but it is the quality of the signal that determines long-term Alpha. For investors seeking to automate the filtering of these high-liquidity windows for the highest-probability setups, tracking Tritonix AI Consensus Stock Pick provides the data-backed conviction required to execute when the math, not the emotion, says the time is right.
FAQ
Why is 9:30 AM ET considered a high-risk time to buy stocks?
The opening bell is a period of price discovery where markets digest overnight news. This results in extreme price volatility, wide bid-ask spreads, and a 'liquidity tax' that often leads to significant slippage for retail investors.
What is the '30-Minute Rule' for investors?
The 30-Minute Rule suggests waiting until 10:00 AM ET to trade. This allows emotional opening trades to clear and lets 'smart money' establish the day's true price range and tighter spreads.
When is the best time of day for stable prices and low slippage?
The midday lull between 11:00 AM and 2:00 PM ET is the best time for stable prices. It features the lowest volatility and tightest bid-ask spreads, making it ideal for market orders.
How does the 'Power Hour' benefit stock buyers?
The final hour of trading (3:00 PM – 4:00 PM ET) offers the deepest liquidity of the day due to institutional rebalancing and passive fund flows, allowing the market to absorb large orders without significant price movement.
Is it a good idea to buy stocks during pre-market or after-hours?
Generally, no. Extended hours are characterized by a 'liquidity desert' with significantly wider bid-ask spreads (often 10x-20x higher than regular hours), increasing the risk of expensive slippage.