Best Investment for Seniors: A 2026 Strategy for Maximum Yield and Inflation Protection
Founder of Tritonix.ai. Former Hedge Fund Analyst with 10+ years of experience managing over $1B AUM across insurance portfolios and private funds. Specializes in institutional-grade fundamental analysis and long-term capital allocation.
Why the Best Investment for Seniors Must Outpace 'Retirement Inflation'
For seniors, the word "safety" is often a euphemism for purchasing power erosion. While the headline Consumer Price Index (CPI) measures a broad basket of goods, it fundamentally fails to capture the "Personal Inflation Rate" (PIR) of a retiree.
In 2026, the divergence between general inflation and senior-specific costs—primarily healthcare and specialized housing—has reached a critical breaking point. Relying solely on "safe" assets like T-bills or CDs effectively locks in a guaranteed real-term loss.
The Senior Inflation Gap
According to PwC’s 2026 Medical Cost Trend report, medical inflation is projected to hit 8.5%, driven by specialized labor shortages and the soaring costs of breakthrough therapeutics (Source: PwC, July 2025). This is more than triple the 2.5%–3.0% target for headline CPI.
{
  "type": "bar",
  "title": "2026 Projected Inflation: Healthcare vs. General Economy",
  "index": "Category",
  "categories": ["Projected Inflation Rate (%)"],
  "data": [
    {"Category": "General CPI (Target)", "Projected Inflation Rate (%)": 2.5},
    {"Category": "Retiree Healthcare Costs", "Projected Inflation Rate (%)": 8.5},
    {"Category": "Assisted Living Services", "Projected Inflation Rate (%)": 7.4},
    {"Category": "Prescription Drugs", "Projected Inflation Rate (%)": 11.0}
  ],
  "source": "Source: PwC 'Behind the Numbers 2026' & Fidelity Retiree Health Estimate (2026)",
  "note": "Healthcare-specific inflation remains structurally higher than the general economy due to labor and R&D costs."
}
So What? If your portfolio isn't yielding at least 6% after taxes, you are not maintaining your lifestyle; you are funding a slow-motion bankruptcy.
Senior-Specific Cost Drivers (2024-2026)
To outpace retirement inflation, an investment strategy must account for these three non-discretionary pillars:
| Expense Category | 2026 Est. Annual Cost | 3-Year Avg. Trend | Why It's Rising |
|---|---|---|---|
| Medicare Premiums | ~$185,500 (Lifetime) | +7.5% YoY | High utilization of chronic care services. |
| Assisted Living | ~$74,400 | +10% YoY | Severe shortages in nursing/caregiver labor. |
| Rx Drugs (Specialty) | Variable | +11% YoY | Introduction of high-cost gene and RNA therapies. |
Source: Fidelity Investments (July 2026); Genworth Cost of Care Survey (2025).
A portfolio heavy on nominal "safety" (cash) ignores the asymmetric risk of a late-life health event. The best investment for seniors in 2026 must trade some perceived price stability for growth-oriented assets and inflation-linked securities. Without this exposure, the "Three-Bucket" framework cannot provide the liquidity required to meet the $185,500 average healthcare price tag today's 65-year-old now faces.
The Immediate Access Bucket: Best Low-Risk Investments for 0-2 Years
The 2026 interest rate environment has handed seniors a rare gift: a "higher-for-longer" yield plateau. With the Federal Reserve maintaining the benchmark rate at 3.50%–3.75% as of August 2026, the Immediate Access Bucket is no longer a "drag" on performance, but a meaningful contributor to total return.
For the 0–2 year liquidity need, the objective is to capture the current 4.0% yield ceiling without sacrificing the ability to fund a sudden $50,000 medical invoice.
The 2026 Cash Landscape
Currently, the market reflects a "hawkish pause." As noted by J.P. Morgan Global Research (Aug 2026), sticky inflation has pushed the terminal rate expectations higher, creating a sweet spot for short-duration assets.
- High-Yield Savings (HYSA): Top-tier digital banks are offering 3.80% APY. This remains the "gold standard" for the first 6 months of living expenses due to instant liquidity.
- Treasury Bills (T-Bills): The 3-month T-Bill is yielding approximately 3.98%. For seniors in high-tax states like California or New York, the state-tax exemption makes T-Bills the superior choice over equivalent CDs.
- CD Ladders: 12-month certificates are peaking at 4.10%. Locking in these rates now protects against the Fed's projected 2027 easing cycle.
| Asset Type | 2026 Target Yield (APY) | Liquidity Profile | Best For |
|---|---|---|---|
| FDIC-Insured CD (12mo) | 4.00% – 4.15% | Low (Early Penalty) | Fixed 2027 expenses |
| Money Market Account | 3.75% – 3.90% | High (Check Writing) | Monthly bill pay |
| 3-Month T-Bill | 3.85% – 3.98% | Moderate (T+1) | Tax-efficient reserves |
(Source: FDIC National Rates; Bloomberg Terminal, August 2026)
{
  "type": "bar",
  "title": "2026 Risk-Free Yield Comparison",
  "index": "Asset",
  "categories": ["Yield (%)"],
  "data": [
    {"Asset": "Natl Avg Savings", "Yield (%)": 0.38},
    {"Asset": "Top HYSA", "Yield (%)": 3.80},
    {"Asset": "3-Month T-Bill", "Yield (%)": 3.98},
    {"Asset": "12-Month CD", "Yield (%)": 4.10}
  ],
  "source": "Source: FDIC and U.S. Treasury Data (Aug 2026)",
  "note": "Top-tier rates based on leading digital bank offerings."
}
So What? In 2026, holding "lazy cash" in a traditional brick-and-mortar savings account (yielding 0.38%) costs the average senior $3,600 per year in lost income for every $100,000 held.
The strategy is simple: Keep 6 months in an HYSA for immediate shocks and ladder the remaining 18 months of "Bucket 1" into 4-week T-Bills. This captures the maximum yield peak while ensuring cash is never more than 30 days away.
CD Laddering for Predictable Senior Income
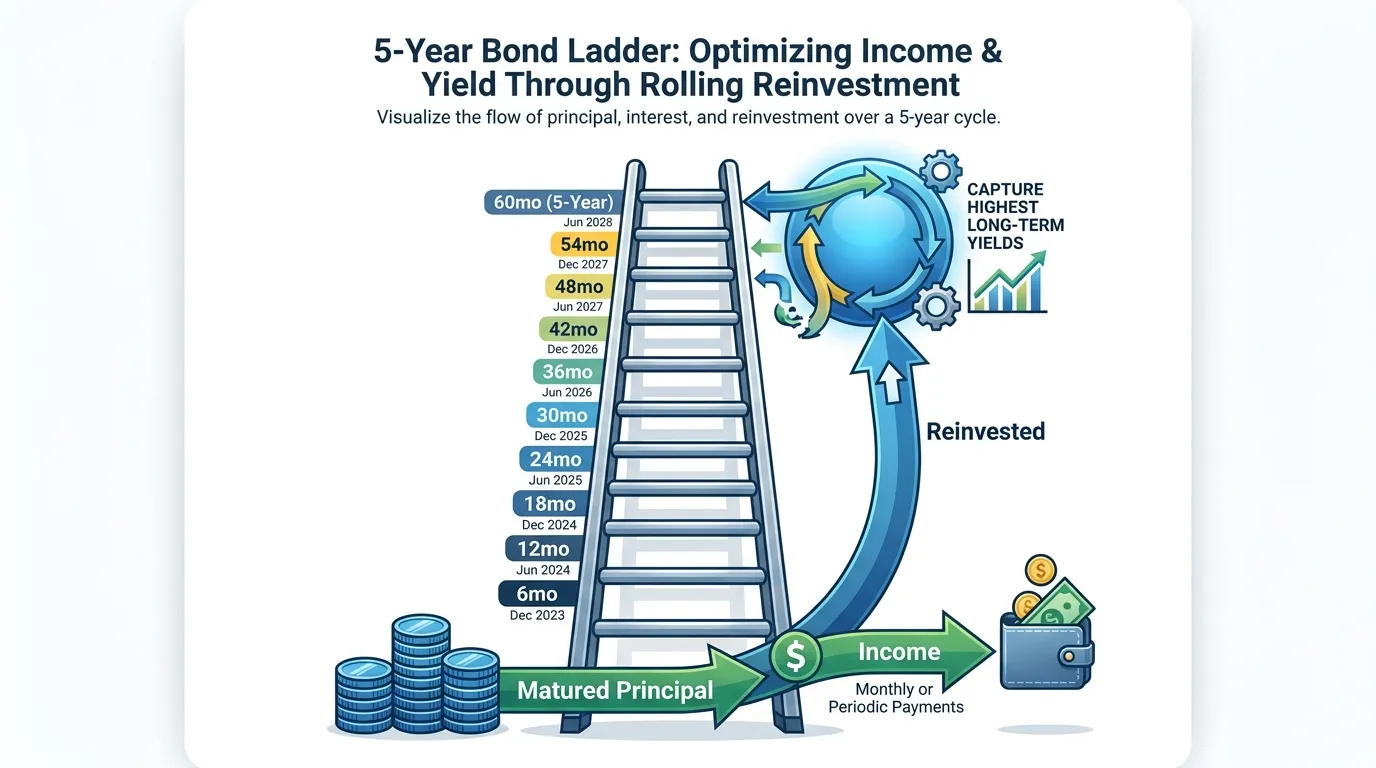
While HYSAs and T-Bills secure your immediate "Bucket 1" liquidity, they leave you vulnerable to reinvestment risk if the Federal Reserve resumes rate cuts. To secure a predictable "private paycheck" through 2031, seniors should transition core cash into a 5-Year CD Ladder.
The 6-Month Liquidity Mechanism
A standard CD ladder is often built in annual rungs, but for seniors requiring more frequent cash flow, the "Split-Rung" strategy is superior. By staggering $100,000 into ten $10,000 CDs with maturities spaced 6 months apart, you create a self-sustaining cycle where principal becomes available twice a year.
- Principal Protection: Every dollar is FDIC-insured up to $250,000 (Source: FDIC, Aug 2026).
- Yield Capture: You lock in 2026’s "higher-for-longer" rates (averaging 3.8%–4.1% at top-tier online banks) before potential 2027 volatility.
- The "Paycheck" Effect: As each 6-month rung matures, you either harvest the interest and principal for living expenses or roll the principal into a new 5-year "top rung" to maintain the yield.
 AI Generated Infographic
2026 CD Yield Landscape: National vs. Elite Rates
As of August 2026, the yield curve remains slightly inverted. While national averages are modest, Elite Online Banks (e.g., Marcus, Synchrony, Capital One) offer a significant premium.
| Term | National Avg (APY) | Elite Online (APY) | Strategy Note |
|---|---|---|---|
| 1-Year | 2.02% | 4.05% | Maximum liquidity; hedge vs. 2027 cuts. |
| 3-Year | 1.68% | 3.85% | Stabilizes "Bucket 2" intermediate needs. |
| 5-Year | 1.73% | 3.90% | Long-term "anchor" for health care costs. |
(Source: Bankrate & FDIC Survey, Aug 2026)
{
  "type": "bar",
  "title": "Elite CD Yields vs. National Averages (Aug 2026)",
  "index": "term",
  "categories": ["National Average", "Elite Online Rates"],
  "data": [
    {"term": "1-Year", "National Average": 2.02, "Elite Online Rates": 4.05},
    {"term": "3-Year", "National Average": 1.68, "Elite Online Rates": 3.85},
    {"term": "5-Year", "National Average": 1.73, "Elite Online Rates": 3.90}
  ],
  "source": "Source: Bankrate Survey (Aug 2026)",
  "note": "Elite rates reflect top 1% of FDIC-insured online offerings."
}
So What? A passive $250,000 portfolio in a traditional 12-month CD earns roughly $5,050 annually at national rates. The 5-year Split-Rung ladder at elite rates generates $9,875 while providing cash access every 180 days. For a senior, this is the difference between covering monthly Medicare Part B premiums out of pocket or having the ladder automate the payment entirely.
The Income Engine: Best Investment for Seniors Seeking Reliable Yield (3-7 Years)
To transition from the immediate liquidity of a CD ladder to the 3–7 year intermediate bucket, investors must pivot from "storing" cash to optimizing tax-adjusted yield.
In the 2026 landscape, the "Income Engine" relies on two primary vehicles: Tax-Exempt Municipal Bonds and Single Premium Immediate Annuities (SPIAs). However, the choice is not about preference, but about your specific tax bracket and the "longevity gap" in your 20-year plan.
The Tax-Equivalent Advantage
For seniors in the 24% federal tax bracket or higher, Municipal Bonds remain the superior engine. As of August 2026, AAA-rated 5-year Munis offer yields that, when adjusted for taxes, consistently outperform equivalent Treasuries.
| Feature | 5-Year Municipal Bond (AAA) | Fixed Period Annuity (SPIA) |
|---|---|---|
| Current Yield (Est.) | 3.65% (Nominal) | 5.20% - 5.80% (Payout) |
| Tax Treatment | Federal (and often State) Exempt | Partially Taxed (Exclusion Ratio) |
| Liquidity | High (Secondary Market) | Zero to Low |
| Fees | 0.10% - 0.50% (via ETFs/Funds) | 1.5% - 3.0% (Embedded) |
(Source: J.P. Morgan Asset Management / Bloomberg, Q3 2026)
The Annuity Trap: Fees vs. Longevity Insurance
Avoid variable or equity-indexed annuities in this 3–7 year bucket. Their high internal costs (often exceeding 3% annually) and surrender charges cannibalize the very yield seniors seek.
However, a low-cost SPIA serves a single, critical purpose: Longevity Insurance. If your "Bucket 1" cash is insufficient to cover non-discretionary expenses (healthcare/housing) for life, an annuity converts a lump sum into a guaranteed stream, effectively acting as a private pension.
{
  "type": "bar",
  "title": "Tax-Equivalent Yield (TEY) Comparison (2026)",
  "index": "Investor Type",
  "categories": ["Taxable Yield", "Muni TEY (35% Bracket)"],
  "data": [
    {"Investor Type": "Conservative", "Taxable Yield": 4.10, "Muni TEY (35% Bracket)": 5.62},
    {"Investor Type": "Moderate", "Taxable Yield": 4.85, "Muni TEY (35% Bracket)": 6.45}
  ],
  "source": "Source: BlackRock Tax-Exempt Income Study (Updated 2026)",
  "note": "TEY assumes 35% Federal + 5% State tax rate."
}
So What? For a senior in a high-tax state like California or New York, a 5.62% Tax-Equivalent Yield on a muni portfolio provides $14,050 in annual tax-free income on a $250,000 allocation. Choosing a high-fee variable annuity instead could cost you over $7,500 in hidden fees over the 3-7 year horizon—effectively wiping out two years of inflation protection.
The Strategy: Use Munis for the 3-7 year engine to maintain principal flexibility. Only pivot to an annuity if your "Three-Bucket" analysis shows a 20% or greater shortfall in guaranteed lifetime floor income.
Dividend Stocks and REITs for Senior Portfolios
For the "Growth & Inflation" bucket, fixed income alone is insufficient. While Munis provide tax-free floors, Dividend Growth Equities and REITs serve as the engine to counteract healthcare-specific inflation, which historically outpaces the headline CPI by 1.5x to 2x (Source: Fidelity, 2024).
The Dividend Growth Advantage
Senior portfolios should prioritize Dividend Aristocrats—companies that have increased payouts for 25+ consecutive years—over high-yield "traps." These firms offer a lower beta (~0.80) compared to the broader S&P 500, providing a cushion during market drawdowns while ensuring income keeps pace with rising costs.
- Compound Annual Growth Rate (CAGR): Seek companies with a 5-year dividend growth rate of >7%.
- Volatility Mitigation: Dividend growers historically capture 80% of market upside but only 70% of the downside (Source: S&P Global, 2024).
{
  "type": "line",
  "title": "Dividend Growth vs. Healthcare Inflation (5-Year Projection)",
  "index": "Year",
  "categories": ["Div Growth Index", "Healthcare CPI"],
  "data": [
    {"Year": "2022", "Div Growth Index": 100, "Healthcare CPI": 100},
    {"Year": "2023", "Div Growth Index": 108, "Healthcare CPI": 104},
    {"Year": "2024", "Div Growth Index": 116, "Healthcare CPI": 109},
    {"Year": "2025 (E)", "Div Growth Index": 125, "Healthcare CPI": 114},
    {"Year": "2026 (P)", "Div Growth Index": 134, "Healthcare CPI": 120}
  ],
  "source": "Source: Bureau of Labor Statistics & Goldman Sachs Asset Management (2024 Estimates)",
  "note": "Projections assume a 7.5% Dividend CAGR vs 4.5% Healthcare Inflation."
}
Specialized REITs: Aligning Wealth with Health
Real Estate Investment Trusts (REITs) are the most direct hedge against rising replacement costs. For 2026, the strategy shifts from commercial office space to Senior Housing and Medical Office Buildings (MOBs). These assets benefit from the "Silver Tsunami" demographic shift, providing triple-net lease structures that pass inflationary costs directly to tenants.
| REIT Sector | Avg. Yield (2025) | Volatility (Beta) | 2026 Outlook |
|---|---|---|---|
| Healthcare (Senior Housing) | 4.8% - 5.5% | 0.75 | Strong (Supply Shortage) |
| Industrial (Logistics) | 3.2% - 3.9% | 1.10 | Neutral (Rate Sensitive) |
| Medical Office (MOB) | 5.1% - 5.8% | 0.65 | Defensive (Recession Proof) |
Source: NAREIT Total Return Data (Dec 2024)
So What? A 30% allocation to these equity income assets ensures your "Three-Bucket" strategy isn't just surviving inflation—it's compounding through it. Prioritize Medical Office REITs for the lowest correlation to the S&P 500, effectively stabilizing your monthly cash flow.
The Growth & Legacy Bucket: Best Long-Term Investment for Seniors (7+ Years)
The fatal error in senior portfolio design is the "Growth Gap"—the delta between low-yielding fixed income and the compounding cost of late-stage healthcare. While general CPI may hover near 2.5%, healthcare inflation is projected to surge 5.8% to 8.5% in 2026 (Source: Milliman / PwC).
To prevent capital depletion over a 20+ year retirement, your Growth & Legacy Bucket must prioritize capital appreciation over immediate yield.
The Index Anchor: Low-Cost Global ETFs
For seniors, the core of this bucket should be Total Market or Dividend Growth ETFs with expense ratios below 0.10%. According to Vanguard’s 2026 Capital Markets Model, U.S. equities are projected to deliver a modest 4.2%–6.2% annualized return over the next decade.
- VTI / VOO: Captures the broad market beta with near-zero friction.
- SCHD / VIG: Focuses on companies with sustainable cash flows, providing a "yield cushion" during market drawdowns.
- Global Diversification: Vanguard projects international developed markets to outperform U.S. large-caps by ~30 basis points (Source: Vanguard, July 2026).
{
  "type": "bar",
  "title": "10-Year Annualized Return vs. Inflation Projections (2026-2036)",
  "index": "Asset / Metric",
  "categories": ["Projected Return / Rate (%)"],
  "data": [
    {"Asset / Metric": "U.S. Equities (Vanguard)", "Projected Return / Rate (%)": 5.2},
    {"Asset / Metric": "Private Equity (Historical Alpha)", "Projected Return / Rate (%)": 11.7},
    {"Asset / Metric": "Healthcare Inflation (Milliman)", "Projected Return / Rate (%)": 5.8},
    {"Asset / Metric": "Target Legacy Yield", "Projected Return / Rate (%)": 7.5}
  ],
  "source": "Source: Vanguard VCMM & Milliman Retiree Health Cost Index (2026)",
  "note": "PE return represents historical 6.5% spread over public equities."
}
The Alpha Driver: Private Equity for Heirs
Private Equity (PE) is no longer restricted to institutional "whales." In 2026, semi-liquid interval funds allow accredited seniors to access buyouts and venture capital.
History is clear: over the 20 years ending Dec 2025, Private Equity outperformed global listed stocks by 6.5% annually (Source: Wealth Club/Morningstar). This asset class acts as a "forced savings" mechanism for heirs, as its 7–10 year lock-up period prevents emotional selling during public market volatility.
| Feature | Low-Cost Index ETFs | Private Equity (Interval Funds) |
|---|---|---|
| Expected Return | 4.2% - 6.5% | 10% - 14% (Target) |
| Liquidity | Daily (High) | Quarterly/None (Low) |
| Primary Use | Late-stage care funding | Wealth transfer to heirs |
| Volatility | Market-correlated | Smoothed (Valuation-based) |
Source: J.P. Morgan Asset Management / McKinsey PE Report (2026)
So What? If your portfolio is 100% liquid, you are paying a "liquidity tax" in the form of lower returns. Allocating 10-15% of your legacy bucket to illiquid Private Equity captures the complexity premium needed to offset 5.8%+ medical inflation.
Risk vs. Reward: Ranking the Best Investment for Seniors in 2026
In the current 2026 macro environment, seniors face a bifurcated inflation risk: while headline CPI has stabilized near 3.5%, specialized healthcare inflation is surging at 9.6% (Source: WTW Global Medical Trend Report, Nov 2025). This gap makes traditional "safe" portfolios—heavy in cash and nominal bonds—mathematically incapable of preserving long-term purchasing power for retiree-specific costs.
To solve this, our 2026 ranking prioritizes assets that offer "Real Yield" (nominal yield minus sector-specific inflation).
2026 Senior Investment Decision Matrix
| Investment Class | Safety | Target Yield | Liquidity | Inflation Protection | Primary Role (Bucket) |
|---|---|---|---|---|---|
| Short-Term TIPS | Ultra-High | 4.8% - 5.2%* | High | Excellent (CPI-Linked) | Liquidity (1-2 yr) |
| Dividend Aristocrats | Moderate | 3.5% - 4.5% | High | Moderate (Pricing Power) | Income (3-7 yr) |
| Private Credit | Low-Mod | 8.0% - 10.5% | Low | Moderate (Floating Rate) | Legacy (7+ yr) |
| Healthcare REITs | Moderate | 5.5% - 6.8% | Mod | High (Direct Hedge) | Income/Growth |
*Yield includes projected principal adjustment based on 3.5% CPI. (Source: Bloomberg/Goldman Sachs Research, Aug 2026).
{
  "type": "bar",
  "title": "2026 Inflation vs. Asset Yields: The Healthcare Gap",
  "index": "Category",
  "categories": ["Yield/Rate (%)"],
  "data": [
    {"Category": "Healthcare Inflation", "Yield/Rate (%)": 9.6},
    {"Category": "Private Credit Yield", "Yield/Rate (%)": 8.5},
    {"Category": "10-Year Treasury", "Yield/Rate (%)": 4.6},
    {"Category": "Headline CPI", "Yield/Rate (%)": 3.5},
    {"Category": "Avg Dividend Yield", "Yield/Rate (%)": 3.8}
  ],
  "source": "Source: PwC Medical Cost Trend / Trading Economics (Aug 2026)",
  "note": "A 5% yield is a 'real loss' against 9.6% medical inflation."
}
The 2026 Playbook: Moving Beyond "Nominal Safety"
- TIPS are Non-Negotiable: With the 10-year Treasury yield hovering at 4.61% (Source: Trading Economics, Aug 2026), nominal bonds fail to protect the "Liquidity Bucket." Vanguard Short-Term TIPS (VTIP) remains the gold standard for preserving immediate spending cash.
- The Private Credit Premium: To bridge the 4.1% gap between Treasury yields and healthcare costs, seniors must capture the "complexity premium." Goldman Sachs’ 2026 Outlook suggests that high-quality private debt, currently yielding 8-10%, is the only viable engine for the "Legacy Bucket."
- Dividend Durability: Focus on funds like SCHD (Schwab US Dividend Equity) which holds companies with high pricing power. In a 2026 "scarcity regime" (Source: BlackRock), companies that can pass costs to consumers are the ultimate inflation hedge.
So What? If your portfolio yield is below 6%, you are effectively losing wealth every time you visit a doctor. To survive 2026, you must pivot 15-20% of your "Income Bucket" from traditional bonds into Healthcare REITs or Private Credit to offset the 9.6% medical inflation wall.
Avoiding Senior Investment Scams and High-Fee Traps
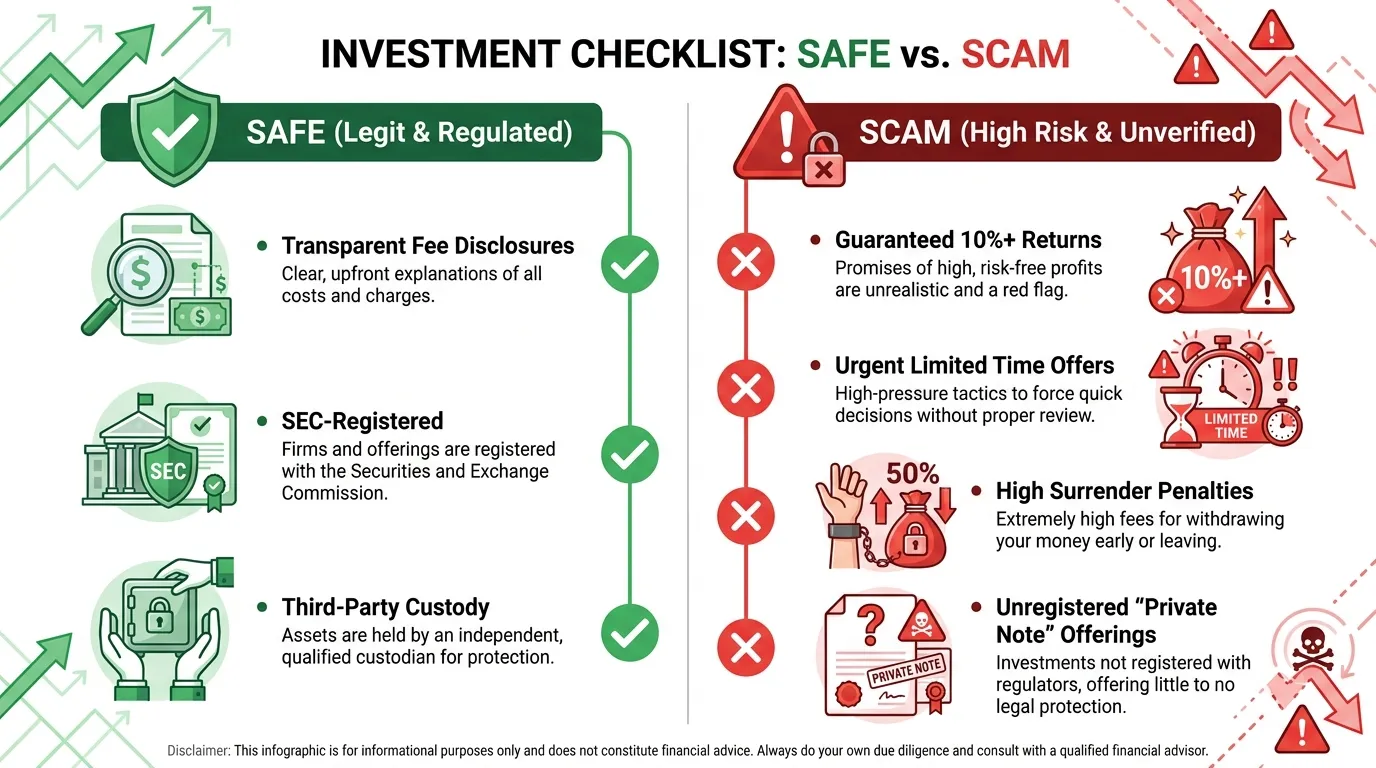
High yields in 2026 are meaningless if they are eroded by hidden fee structures or lost to predatory "zero-risk" schemes. As inflation remains sticky, the desperation for yield makes seniors prime targets for complex insurance-wrapped products and unregistered private offerings.
The Complexity Trap: High-Fee Annuities
The most pervasive "legal" trap for seniors in 2026 is the Variable Annuity (VA) with excessive riders. While marketed as "guaranteed income," the layered fees—including M&E charges, administrative fees, and investment management fees—often exceed 3.5% annually.
According to FINRA warnings, the surrender charges on these products can lock up liquidity for 7–10 years, precisely when "Health-Wealth" bucket liquidity is most needed.
| Product Type | Typical Annual Fee | 10-Yr Impact on $500k Portfolio* | Liquidity |
|---|---|---|---|
| Low-Cost Dividend ETF | 0.06% - 0.15% | ~$492,000 (Principal + Growth) | Daily |
| Variable Annuity (with Riders) | 3.25% - 4.00% | ~$345,000 (After Fees) | Restricted |
| Healthcare REIT (Institutional) | 0.75% - 1.10% | ~$450,000 (After Fees) | Quarterly/Monthly |
(Source: Morningstar Fee Study & SEC Investor Bulletin, 2025 projections. *Assumes 6% gross return before fees.)
[Visual: Data Chart]
{
  "type": "bar",
  "title": "The 10-Year Cost of Fees ($500k Initial Investment)",
  "index": "Fee Level",
  "categories": ["Portfolio Value After 10 Years"],
  "data": [
    {"Fee Level": "Low Fee (0.1%)", "Portfolio Value After 10 Years": 886000},
    {"Fee Level": "Average Fee (1.0%)", "Portfolio Value After 10 Years": 814000},
    {"Fee Level": "High Fee (3.0%)", "Portfolio Value After 10 Years": 671000}
  ],
  "source": "Source: SEC Compound Interest Calculator (2025)",
  "note": "Assumes 6% annual growth rate. High fees result in a $215,000 'fee tax' over a decade."
}
Red-Flag Checklist for 2026
Predatory marketing in 2026 often leverages AI-generated deepfakes of known financial personalities or "exclusive" access to private credit.
So What? If a product requires more than three sentences to explain how it generates yield, or if the "guarantee" is backed by an offshore entity rather than a Tier-1 insurer, walk away. In a 9.6% medical inflation environment, your biggest risk isn't volatility—it's illiquidity.
 AI Generated Infographic
To ensure your portfolio aligns with institutional-grade safety rather than retail traps, tracking where the "Smart Money" is actually flowing provides a necessary reality check against marketing hype. For a transparent view of where major funds are allocating in this high-inflation environment, monitor the Smart Money Tracker for Institutional Portfolios.
FAQ
What is the best investment for seniors to beat inflation in 2026?
A combination of Short-Term TIPS, Healthcare REITs, and Dividend Growth stocks is recommended to outpace rising medical costs, which are projected to hit 8.5%.
Why are traditional savings accounts risky for retirees now?
Holding cash in traditional savings accounts yielding only 0.38% results in a real-term loss against retiree-specific inflation, costing seniors thousands in lost purchasing power annually.
How does a CD ladder help senior investors?
A CD ladder, specifically the 'Split-Rung' strategy, creates a predictable 'private paycheck' by staggering maturities every 6 months to ensure liquidity and consistent yield.
Are annuities a safe choice for senior portfolios?
Low-cost SPIAs can serve as longevity insurance, but seniors should avoid variable annuities with high riders, as fees often exceed 3.5%, eroding retirement wealth.
What is the benefit of Medical Office REITs for seniors?
Medical Office REITs offer high yields (5.1%-5.8%) and act as a direct hedge against rising replacement costs in the healthcare sector, providing defensive income.