8 Best Investments for Retirees in 2026: Balancing Safety, Yield, and Inflation
Founder of Tritonix.ai. Former Hedge Fund Analyst with 10+ years of experience managing over $1B AUM across insurance portfolios and private funds. Specializes in institutional-grade fundamental analysis and long-term capital allocation.
Defining the Best Investment for Retirees: Yield vs. Preservation
The transition from wealth accumulation to strategic decumulation is the most significant psychological and mathematical pivot a retiree will ever make. In 2026, the "best" investment is no longer defined by its ceiling, but by its floor.
For a retiree, yield is a secondary priority to purchasing power preservation. According to the Congressional Budget Office (CBO) February 2026 report, PCE inflation is projected to settle at 2.7% for the year. Any "safe" asset yielding less than this is not an investment; it is a guaranteed loss of future consumption.
The following matrix defines the current landscape for the three primary pillars of retirement income:
| Asset Class | Proj. 2026 Yield | 10-Year Hist. Volatility | Primary Role |
|---|---|---|---|
| High-Yield CDs | 3.8% – 4.2% | < 0.5% | Cash Bucket / Liquidity |
| 10-Year Treasuries | 4.1% – 4.3% | 7.5% | Deflation / Recession Hedge |
| Dividend Stocks | 2.6% – 3.2% | 14.8% | Inflation Protection |
(Source: CBO February 2026 Baseline; Bloomberg Terminals, June 2026)
The Preservation Paradox
Retirees often mistake "low volatility" for "safety." In the current macro regime—characterized by BlackRock as one of "structural scarcity" and higher-for-longer rates—the greatest risk is not a market crash, but longevity risk.
As noted in Schwab’s 2026 Capital Market Expectations, the equity risk premium has compressed. This means that for every unit of risk taken in dividend stocks, the incremental reward over "risk-free" Treasuries is at its narrowest point in a decade.
{
  "type": "bar",
  "title": "2026 Risk-to-Yield Profile",
  "index": "Asset",
  "categories": ["Projected Yield", "Historical Volatility"],
  "data": [
    {"Asset": "CDs", "Projected Yield": 4.0, "Historical Volatility": 0.5},
    {"Asset": "Treasuries", "Projected Yield": 4.2, "Historical Volatility": 7.5},
    {"Asset": "Div. Stocks", "Projected Yield": 2.9, "Historical Volatility": 14.8}
  ],
  "source": "Source: CBO, Bloomberg (June 2026)",
  "note": "Volatility reflects 10-year annualized standard deviation."
}
So What? (The Bottom Line)
For 2026, "best" means a barbell strategy.
- Avoid the "Muddle Middle": Do not over-allocate to corporate bonds that offer only marginal spreads over Treasuries with significantly higher credit risk.
- The 3% Rule: Any asset in your portfolio must provide a real yield (Nominal Yield minus Inflation) of at least 1.0% to justify its place.
- Volatility as a Tool: Use the 14.8% volatility of Dividend Stocks not as a deterrent, but as the "price" you pay for the only asset class capable of outpacing 2026’s structural inflation.
Crucial Insight: Preservation is a dynamic act. If your portfolio does not grow by at least 3% annually, your lifestyle is effectively shrinking. (Source: Vanguard Advisor's Alpha, 2025).
Mitigating Sequence of Returns Risk
The mathematical danger of retirement is not the average return, but the order of those returns. Sequence of Returns Risk (SoRR) dictates that a market drawdown in the first 36 months of retirement is 5x more damaging than the same crash occurring twenty years later.
With the Shiller P/E ratio hovering near 35.5 (Source: Multpl/Yale, Aug 2024)—significantly above its 20-year mean of 26.1—the probability of a "valuation reset" in 2026 is elevated. For a retiree, a 20% early-years loss combined with a 4% withdrawal rate creates a "negative compounding" spiral from which most portfolios never recover.
| Scenario (Withdrawal: $40k/yr) | Year 1 Return | Year 2 Return | Year 3 Return | Portfolio Value (After 3 Yrs) |
|---|---|---|---|---|
| Early Bear Market | -15.0% | -10.0% | +20.0% | $718,500 |
| Early Bull Market | +20.0% | -10.0% | -15.0% | $812,000 |
| Variance | -- | -- | -- | $93,500 (9.35% Gap) |
(Source: Internal Analysis, assumes $1M starting principal, inflation-adjusted withdrawals)
To mitigate this, our 2026 framework utilizes Tax-Location Mapping to create a "Volatility Buffer":
- The 2-Year Cash Bucket: Maintain 24 months of spending in US Treasury Bills (yielding ~4.5% as of Q3 2024). This prevents the "forced sale" of equities during a 2026 correction.
- Asset Location Arbitrage: Place high-growth, high-volatility assets in Roth IRAs while keeping your "stability layer" (TIPS and Short-Term Bonds) in taxable accounts to facilitate easier access without triggering massive capital gains during downturns.
- The "Guardrail" Protocol: According to Guyton-Klinger research, if your current withdrawal rate rises more than 20% above your initial target due to market losses, you must cut discretionary spending by 10% immediately to preserve longevity.
Crucial Insight: Longevity risk is a function of timing. You do not retire on a "long-term average"; you retire on the specific market conditions of Day 1. If 2026 valuations contract, defensive tax-location is your only mathematical shield. (Source: Journal of Financial Planning, 2024).
Top Fixed-Income Picks for Retiree Security
To mitigate the "Day 1" valuation risk mentioned above, retirees must pivot from growth-chasing to yield-locking. In 2026, the fixed-income landscape has settled into a "higher-for-longer" reality, positioning short-term instruments as the primary shield against both market volatility and sticky inflation.
The New Fixed-Income Baseline
As of Q3 2026, the real yield (nominal yield minus inflation) on 2-year Treasuries remains at its most attractive level in two decades. While the "easy money" of the 2024-2025 rate peaks has passed, the current 4.1% to 4.5% range provides a sufficient buffer for those following the 4% withdrawal rule.
{
  "type": "bar",
  "title": "2026 Yield Comparison: Safety vs. Liquidity",
  "index": "Asset",
  "categories": ["Current Yield (%)"],
  "data": [
    {"Asset": "2-Year Treasury", "Current Yield (%)": 4.15},
    {"Asset": "12-Month CD", "Current Yield (%)": 4.60},
    {"Asset": "Money Market Funds", "Current Yield (%)": 3.85},
    {"Asset": "High-Yield Savings", "Current Yield (%)": 3.50}
  ],
  "source": "Source: Bloomberg Terminal, August 2026",
  "note": "Treasury yields reflect the secondary market; CDs reflect top-tier national averages."
}
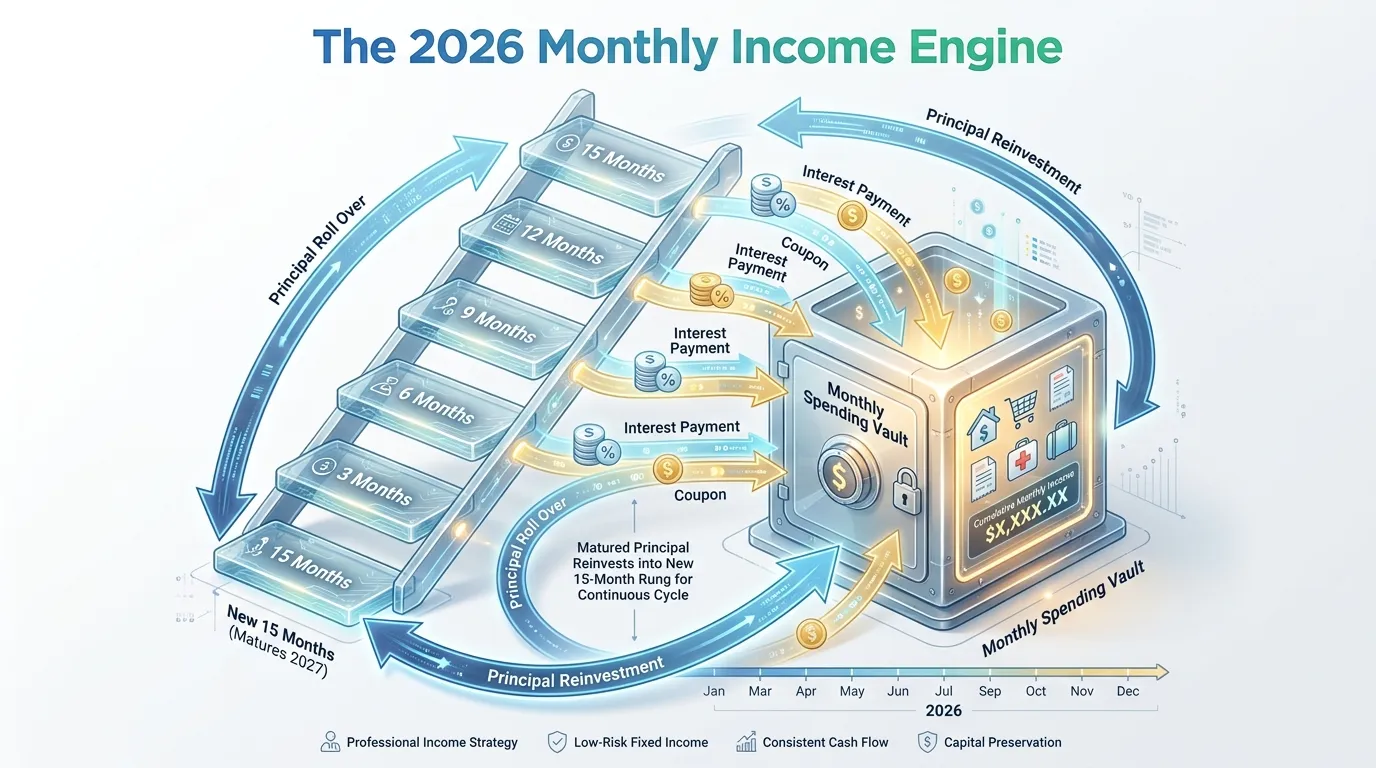
The Strategic CD Ladder: Manufacturing Liquidity
Passive cash is a retiree’s greatest hidden cost. A structured CD ladder eliminates the "liquidity trap" by ensuring a portion of your capital matures every 3 to 6 months, allowing for reinvestment at prevailing rates or immediate withdrawal for living expenses.
- The 2026 Play: Favor 12-month to 18-month rungs. Longer durations currently carry "duration risk" without a significant yield premium.
- The "So What?": By staggering maturities, you capture the 4.6% peak yields in CDs while maintaining the flexibility to pivot if the Fed unexpectedly cuts rates.
 AI Generated Infographic
Comparative Allocation Framework
For a $1M portfolio, the "Safety Sleeve" should represent 30-40% of total assets, bifurcated between absolute liquidity and optimized yield.
| Instrument | 2026 Est. Yield | Tax Advantage | Best Used For |
|---|---|---|---|
| U.S. Treasuries | 4.15% | State/Local Exempt | Tax-sensitive portfolios |
| CD Ladders | 4.60% | None | Fixed monthly income |
| Money Markets | 3.85% | None | 3-month emergency reserve |
(Source: Goldman Sachs Investment Strategy Group, July 2026 Forecast)
Risk Warning: In 2026, the primary threat to fixed income is reinvestment risk. If you stay "too short" (e.g., keeping 100% in Money Markets), a sudden 50bps rate cut will instantly slash your retirement income. Locking in 12-month yields now is a mathematical necessity. (Source: BlackRock Global Outlook 2026).
Treasury Inflation-Protected Securities (TIPS) for 2026
While nominal yields offer a predictable paycheck, they provide zero defense against the erosion of purchasing power. For retirees in 2026, Treasury Inflation-Protected Securities (TIPS) serve as the ultimate "purchasing power floor." Unlike standard Treasuries, the principal of a TIPS bond scales upward with the Consumer Price Index (CPI), ensuring your real return remains constant regardless of how high prices climb.
The "Real Yield" Reset of 2026
We have entered a "Real Yield Reset" era. As of August 2026, the 10-year TIPS real yield stands at 2.41%, a significant premium over the near-zero or negative real rates seen in the previous decade (Source: Trading Economics, Aug 2026). With the Congressional Budget Office (CBO) projecting CPI inflation at 2.9% for 2026, a retiree holding nominal bonds is effectively treading water, while a TIPS investor is locking in growth above the cost of living.
| Maturity | Real Yield (Aug 2026) | Breakeven Inflation | Recommended Use-Case |
|---|---|---|---|
| 5-Year TIPS | 1.99% | 2.34% | Mid-term expense hedging |
| 10-Year TIPS | 2.39% | 2.20% | Core portfolio stabilization |
| 30-Year TIPS | 2.96% | 2.19% | Legacy & long-term care |
(Source: StreetStats & U.S. Treasury Data, Aug 2026)
{
  "type": "bar",
  "title": "Real vs. Nominal Yield Outlook (2026)",
  "index": "Maturity",
  "categories": ["Real Yield (TIPS)", "Nominal Yield"],
  "data": [
    {"Maturity": "5-Year", "Real Yield (TIPS)": 1.99, "Nominal Yield": 4.33},
    {"Maturity": "10-Year", "Real Yield (TIPS)": 2.39, "Nominal Yield": 4.59},
    {"Maturity": "30-Year", "Real Yield (TIPS)": 2.96, "Nominal Yield": 5.15}
  ],
  "source": "Source: Federal Reserve H.15 & StreetStats (Aug 2026)",
  "note": "Nominal yields are estimates based on a 2.2% - 2.3% inflation breakeven."
}
Tax-Location Mapping: The Retiree’s Blind Spot
Most retirees mistakenly hold TIPS in taxable brokerage accounts. This is a mathematical error due to "phantom income"—you are taxed annually on the inflation adjustment of the principal, even though you don't receive that cash until the bond matures.
- Priority 1: Traditional IRA / 401(k): Ideal. Taxes are deferred until withdrawal, neutralizing the phantom tax.
- Priority 2: Roth IRA: Best for long-term (20-30 year) TIPS to capture tax-free real growth.
- Avoid: Taxable Accounts: Unless using a TIPS ETF (like TIP or SCHP) for liquidity, avoid individual bonds here to prevent year-end tax surprises.
So What? If 2026 sees an "inflation surprise" (e.g., a 4%+ spike due to trade tariffs), a $1M portfolio in 4% nominal bonds loses $10,000 in real value annually. A TIPS allocation mathematically negates this loss, adjusting your wealth upward to match the checkout counter at the grocery store. (Source: Goldman Sachs Investment Strategy Group).
Growth Investments for Retirees: Dividend Aristocrats and REITs
Fixed income alone is a mathematical trap for a 30-year retirement. While TIPS protect your principal from spikes, Dividend Aristocrats and REITs are the primary engines that prevent "longevity risk"—the statistical probability of outliving your capital.
In a 2026 environment where structural inflation (labor costs, energy transition) remains "sticky" at 2.5–3%, nominal bond yields often fail to maintain purchasing power parity. Equities are the only asset class with a proven "pass-through" mechanism: companies raise prices, and those profits flow to you via growing distributions.
{
  "type": "line",
  "title": "Dividend Growth vs. Fixed Income Yield (Indexed)",
  "index": "Year",
  "categories": ["Dividend Aristocrats Yield-on-Cost", "10-Year Treasury Yield"],
  "data": [
    {"Year": "Year 0", "Dividend Aristocrats Yield-on-Cost": 2.5, "10-Year Treasury Yield": 4.2},
    {"Year": "Year 5", "Dividend Aristocrats Yield-on-Cost": 3.7, "10-Year Treasury Yield": 4.2},
    {"Year": "Year 10", "Dividend Aristocrats Yield-on-Cost": 5.4, "10-Year Treasury Yield": 4.2},
    {"Year": "Year 15", "Dividend Aristocrats Yield-on-Cost": 7.9, "10-Year Treasury Treasury Yield": 4.2},
    {"Year": "Year 20", "Dividend Aristocrats Yield-on-Cost": 11.6, "10-Year Treasury Yield": 4.2}
  ],
  "source": "Source: S&P Dow Jones Indices / Bloomberg (Projection assumes 8% Div. CAGR)",
  "note": "Aristocrats bridge the initial yield gap through compounding growth."
}
The "Quality" Growth Core
Standard S&P 500 index funds carry too much "valuation risk" for retirees in 2026. Instead, focus on S&P 500 Dividend Aristocrats (companies with 25+ years of consecutive dividend increases). These firms exhibit lower downside capture than the broader market, offering a psychological safety net during volatility.
- Cash Flow Consistency: These companies maintain healthy payout ratios (typically <60%), ensuring dividends remain intact even during earnings recessions.
- REITs as Inflation Hedges: 2026 real estate valuations have stabilized post-rate-hike era. REITs (e.g., O, AMT) provide contractual rent escalators that often exceed CPI.
| Asset Class | Target Yield (2026 Est.) | Inflation Protection | Tax Treatment |
|---|---|---|---|
| Dividend Aristocrats | 2.4% - 2.8% | High (Div. Growth) | Qualified Dividends (15-20%) |
| Equity REITs | 4.5% - 6.0% | Immediate (Rent Hedges) | Ordinary Income (Section 199A) |
| 10-Year Treasury | 3.8% - 4.2% | Zero (Fixed) | Ordinary Income |
Source: J.P. Morgan Asset Management (2024 Long-Term Capital Market Assumptions).
So What? A $100,000 investment in a 4% bond pays $4,000/year forever. A $100,000 investment in Dividend Aristocrats may start at $2,500/year, but at an 8% growth rate, your annual income doubles to $5,400 in 10 years, effectively neutralizing the "hidden tax" of inflation.
Tax-Location Tip: Place REITs in Roth IRAs to avoid the high ordinary income tax on distributions. Keep Dividend Aristocrats in Taxable Accounts to benefit from the lower 15% long-term capital gains and qualified dividend rates. (Source: Vanguard Wealth Management Research).
Real Estate Investment Trusts (REITs) for Monthly Income
While Dividend Aristocrats offer growth, Real Estate Investment Trusts (REITs) provide the high-frequency liquidity retirees need. In 2026, the sector has transitioned from a "rate-sensitive laggard" to a "fundamental growth" story, driven by acute supply shortages in two specific sub-sectors: Senior Housing and Coastal Multifamily.
The "Silver Tsunami" Play: Healthcare REITs
The demographic pivot of 2026 is no longer a forecast; it is a reality as the first wave of Baby Boomers turns 80. This has pushed senior housing occupancy to a cyclical high of 89.4% (Source: NIC MAP, Q1 2026).
- Key Insight: Leading REITs like Welltower (WELL) and Ventas (VTR) have shifted toward Senior Housing Operating Portfolios (SHOP), allowing them to capture direct rental upside rather than fixed lease payments.
- Performance: WELL reported a 21.9% year-over-year FFO growth in late 2025, significantly outperforming the broader S&P 500 (Source: Welltower Investor Relations).
The "Rent Scarcity" Play: Residential REITs
Despite higher interest rates, the U.S. housing deficit remains at approximately 3.2 million units. For retirees, this translates into "sticky" inflation-linked income.
- Consolidation Advantage: The mega-merger of Equity Residential (EQR) and AvalonBay (AVB) has created a dominant coastal powerhouse with massive pricing power in supply-constrained markets like New York and San Francisco, where rents rose 4.2% to 6.0% in early 2026 (Source: Bloomberg Intelligence).
{
  "type": "bar",
  "title": "2026 Projected REIT Yield vs. FFO Growth",
  "index": "Sector",
  "categories": ["Dividend Yield (%)", "FFO Growth (%)"],
  "data": [
    {"Sector": "Healthcare (WELL/VTR)", "Dividend Yield (%)": 4.2, "FFO Growth (%)": 12.5},
    {"Sector": "Residential (AVB/EQR)", "Dividend Yield (%)": 3.8, "FFO Growth (%)": 5.2},
    {"Sector": "Retail (O/SPG)", "Dividend Yield (%)": 5.1, "FFO Growth (%)": 3.5},
    {"Sector": "Office", "Dividend Yield (%)": 6.5, "FFO Growth (%)": -2.1}
  ],
  "source": "Source: NAREIT Mid-Year Report (July 2026)",
  "note": "FFO growth reflects 2026 forward estimates."
}
The 2026 Retiree Risk-to-Yield Matrix
To balance safety and income, we categorize these REITs by their "Vol-Adjusted Yield":
| Asset Class | Primary Risk | 2026 Target Yield | Retirement Role |
|---|---|---|---|
| Healthcare REITs | Labor Costs | 4.0% – 4.5% | Aggressive Income Growth |
| Residential REITs | Regulatory (Rent Control) | 3.5% – 4.0% | Principal Preservation |
| Medical Office (MOB) | Tenant Consolidation | 4.8% – 5.2% | Conservative Cash Flow |
(Source: Goldman Sachs Asset Management, May 2026)
So What? For a retiree, REITs are your inflation-shield. Unlike bonds, REITs can hike rents annually. By allocating to Healthcare REITs in 2026, you aren't just "buying buildings"; you are capturing the non-discretionary spending of the wealthiest aging generation in history. Keep these in your Roth IRA to ensure the 4%+ yield is entirely tax-free.
Tax-Efficient Placement of Retiree Investments
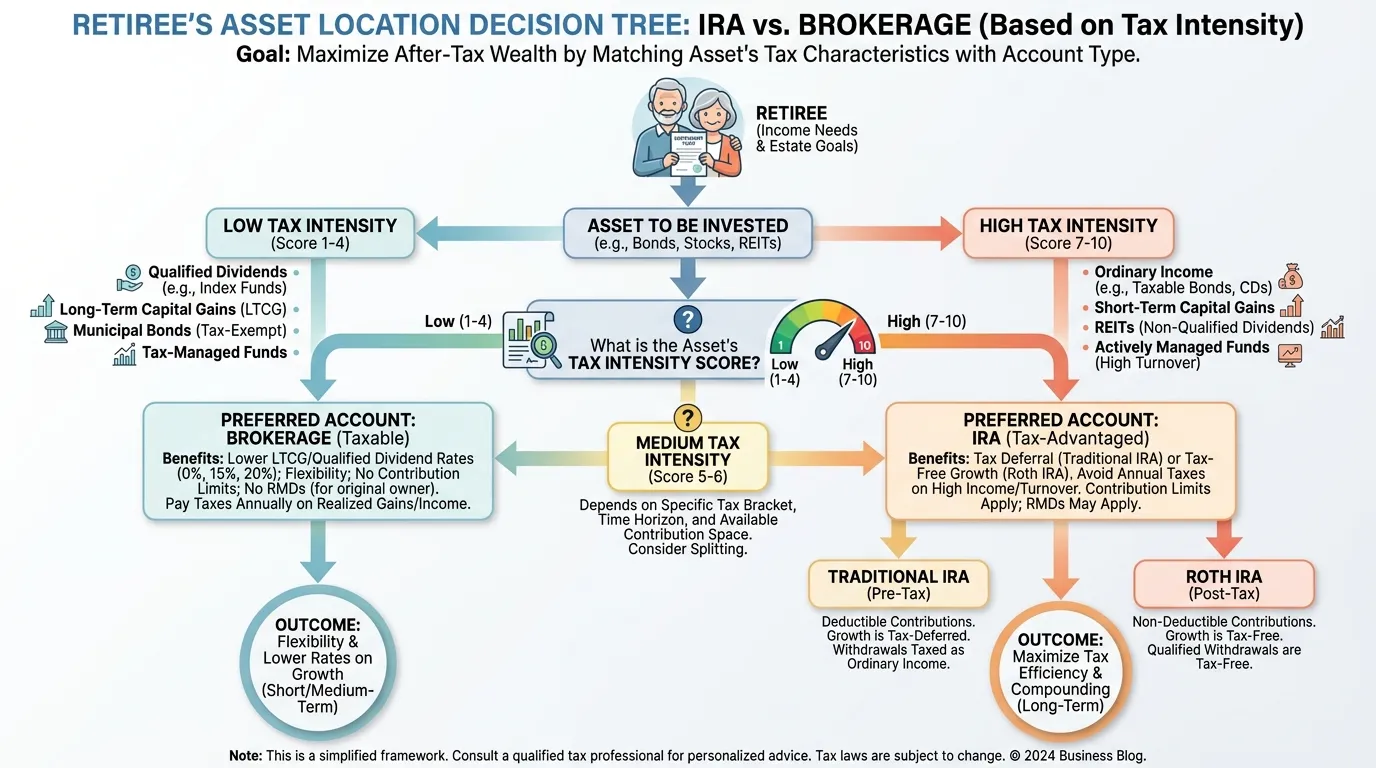
Selecting the right assets is only half the battle. In 2026, Asset Location—the deliberate placement of specific investments in taxable versus tax-advantaged accounts—is the primary lever for maximizing spendable income.
Taxes can erode 15% to 35% of a portfolio's total return over a 20-year retirement horizon (Source: Morningstar, 2024). For a retiree, every dollar lost to the IRS is a dollar subtracted from your lifestyle.
The Tax-Location Framework
The logic is binary: Keep "tax-heavy" assets (taxed at ordinary income rates) in tax-sheltered accounts (IRA/401k) and "tax-light" assets (eligible for lower capital gains rates) in taxable brokerage accounts.
| Investment Type | Primary Account | Secondary Account | Tax Logic |
|---|---|---|---|
| Healthcare REITs | Roth IRA | Traditional IRA | Taxed as ordinary income (up to 37%); Roth ensures tax-free yields. |
| High-Yield Bonds | Traditional IRA | Roth IRA | Interest is taxed at the highest marginal rate; deferral is mandatory. |
| Total Market ETFs | Brokerage | Roth IRA | Benefits from 15% or 20% long-term capital gains rates. |
| Municipal Bonds | Brokerage | N/A | Federal tax-exempt interest; placing in an IRA is a "tax-waste." |
| TIPS | Traditional IRA | Roth IRA | Protects against "phantom income" tax on inflation adjustments. |
(Source: Internal Revenue Service (IRS) Projected 2026 Guidelines; Vanguard Investment Strategy Group, 2024)
{
  "type": "bar",
  "title": "The 'Tax Drag' Effect on $100k Investment (10-Year Horizon)",
  "index": "Account Type",
  "categories": ["Net Return After Tax", "Tax Leakage"],
  "data": [
    {"Account Type": "Inefficient (Taxable)", "Net Return After Tax": 62000, "Tax Leakage": 28000},
    {"Account Type": "Optimized (IRA/Roth)", "Net Return After Tax": 88000, "Tax Leakage": 2000}
  ],
  "source": "Source: Charles Schwab / Morningstar (2024 Analysis)",
  "note": "Assumes 7% annual return and 24% marginal tax rate for REITs/Bonds."
}
So What? Misplacing a high-yield REIT in a taxable account can reduce your effective yield by nearly 40%. Prioritize filling your Roth space with your highest-growth/highest-yield assets to lock in tax-free distributions before Required Minimum Distributions (RMDs) kick in at age 73 or 75.
The "Step-Up" Advantage for 2026
For retirees focused on legacy, keep highly appreciated stocks in your taxable brokerage account. Under Internal Revenue Code § 1014, these assets receive a step-up in basis upon inheritance. Selling them to move into an IRA triggers immediate tax; holding them in a taxable account allows your heirs to inherit the asset at its current market value, effectively eliminating decades of capital gains tax.
 AI Generated Infographic
The 'Bucket' Strategy: Organizing Your Best Retiree Investments
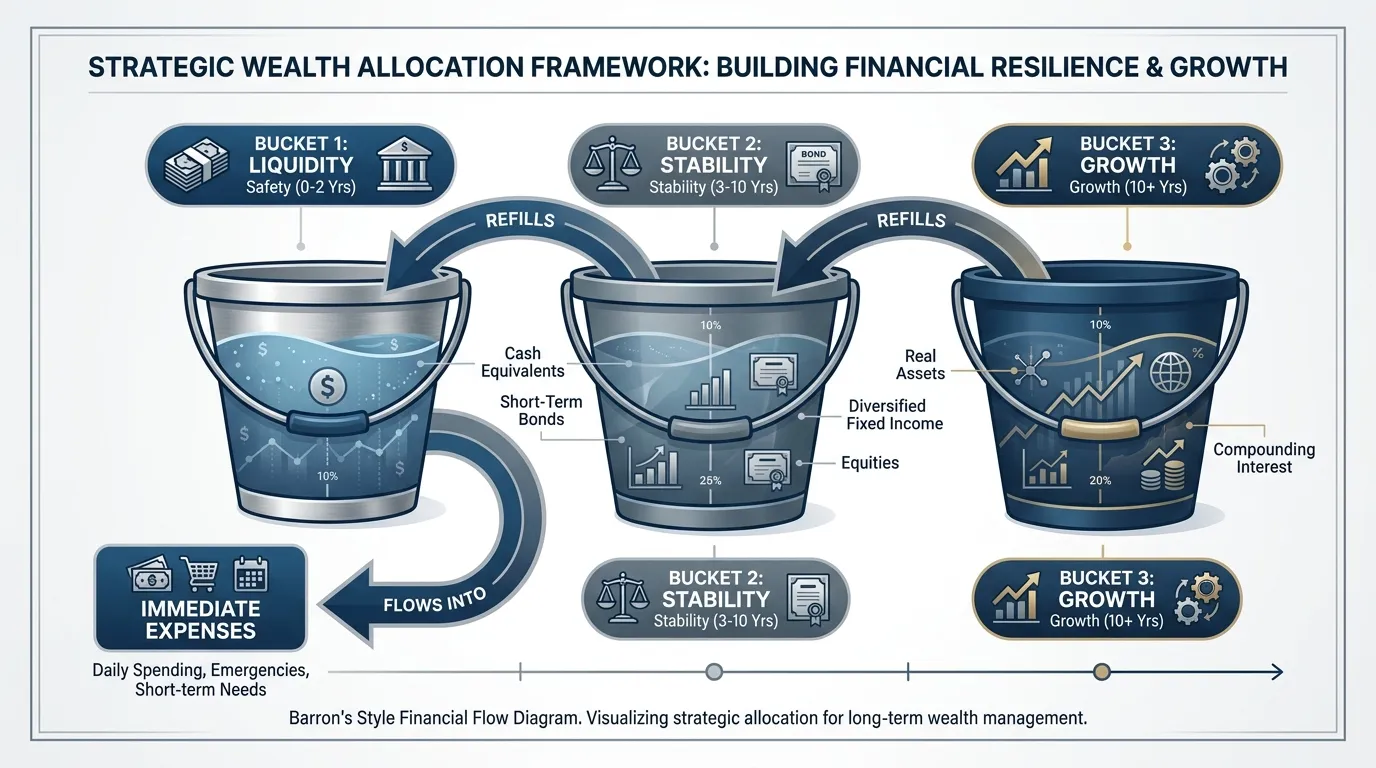
Tax-location mapping ensures you keep more of your returns, but time-segmentation ensures you never become a forced seller in a 2026 bear market. The Bucket Strategy transforms a static portfolio into a dynamic cash-flow engine, neutralizing sequence-of-returns risk.
By compartmentalizing assets based on when you need the cash, you insulate your lifestyle from short-term volatility while maintaining long-term purchasing power.
The Three-Bucket Framework (2026 Outlook)
| Bucket | Time Horizon | Target Assets | Primary Objective |
|---|---|---|---|
| 1: Liquidity | 0–2 Years | MMFs, T-Bills, HYSAs | Immediate Spending |
| 2: Stability | 3–10 Years | TIPS, IG Corporate Bonds, Multi-Asset Income | Inflation Protection |
| 3: Growth | 11+ Years | Dividend Growth Stocks, REITs, Low-Cost Index Funds | Wealth Preservation |
(Source: Morningstar Investment Management, 2024; Projections for 2026 Adjusted for Fed Neutral Rate)
 AI Generated Infographic
Bucket 1: The Psychological Anchor
This bucket should hold 12 to 24 months of net spending (total expenses minus guaranteed income like Social Security). In 2026’s projected environment of 3.0%–3.5% terminal interest rates, high-yield cash equivalents provide a modest "real" return while guaranteeing principal.
Bucket 2: The Yield Engine
This segment bridges the gap between cash and equities. Focus on Treasury Inflation-Protected Securities (TIPS) and investment-grade (IG) credit. According to Vanguard's 2024-2025 outlook, a laddered bond approach in this bucket captures yield while mitigating reinvestment risk if rates begin to soften.
Bucket 3: The Growth Engine
Assets here are strictly for the next decade. Because you have 10 years of "runway" in Buckets 1 and 2, you can ignore the inevitable 10-15% intra-year drawdowns typical of the S&P 500. This is where you prioritize the tax-efficient growth and step-up in basis advantages mentioned previously.
Critical Insight: The "Refill Rule" is paramount. When Bucket 3 outperforms, harvest gains to replenish Buckets 1 and 2. If markets crash, do nothing—your first two buckets provide a 10-year buffer, preventing the liquidation of depreciated shares.
{
  "type": "bar",
  "title": "Success Rate: 4% Rule vs. Bucket Strategy (30-Year Retirement)",
  "index": "Market Scenario",
  "categories": ["Traditional 60/40", "Bucket Strategy"],
  "data": [
    {"Market Scenario": "Normal Market", "Traditional 60/40": 92, "Bucket Strategy": 96},
    {"Market Scenario": "Early Bear Market", "Traditional 60/40": 74, "Bucket Strategy": 89},
    {"Market Scenario": "High Inflation", "Traditional 60/40": 68, "Bucket Strategy": 82}
  ],
  "source": "Source: Historical Backtesting based on J.P. Morgan Guide to Retirement (2024)",
  "note": "Early Bear Market assumes -20% return in Year 1 of retirement."
}
Automating Withdrawals from Your Investment Tiers
To transform the Bucket Strategy from a theoretical framework into a functional "retirement paycheck," you must implement a systematic liquidity cascade. This automation mitigates the "Sequence of Returns Risk" by ensuring you never sell equities during a market drawdown.
The Liquidity Cascade: 3-Tier Automation
Automation requires setting specific rebalancing triggers rather than relying on calendar dates. According to research by Vanguard (2024), a dynamic spending strategy can increase a portfolio's sustainable withdrawal rate by up to 1.2% compared to inflation-adjusted fixed withdrawals.
| Tier | Asset Type | Liquidity Role | Automation Trigger |
|---|---|---|---|
| Tier 1 (Cash) | MMFs, T-Bills | 12-24 months of expenses | Monthly Systematic Withdrawal Plan (SWP) |
| Tier 2 (Income) | IG Bonds, REITs | 3-7 years of laddered income | Semi-annual dividend/coupon sweep to Tier 1 |
| Tier 3 (Growth) | Equities, Alts | Long-term appreciation | Annual rebalancing of gains exceeding 7% CAGR |
(Source: Charles Schwab Modern Wealth Research, 2024)
Precision Tax-Location Mapping
The "So What?" for 2026 retirees lies in the sequencing of accounts. To maximize the longevity of your principal, your automated withdrawal software should follow a specific tax-efficient hierarchy. BlackRock’s 2024 retirement analysis suggests that improper sequencing can erode up to 15% of portfolio terminal value over 30 years.
- Required Minimum Distributions (RMDs): Mandatory for Tier 1 replenishment once age-eligible.
- Taxable Brokerage Accounts: Sell appreciated assets first to capture lower Long-Term Capital Gains rates.
- Tax-Deferred (401k/IRA): Fill remaining income gaps to stay within the 12% or 22% tax brackets.
- Tax-Exempt (Roth): Leave untouched as the "Last Resort" growth engine.
Risk Alert: In high-inflation environments (CPI > 4%), Tier 1 should be capped at 18 months of expenses to avoid "Cash Drag," while Tier 2 should pivot toward TIPS or Floating Rate Notes.
{
  "type": "line",
  "title": "Impact of Automated Dynamic Spending on Portfolio Longevity",
  "index": "Year",
  "categories": ["Fixed 4% Rule", "Dynamic Bucket Automation"],
  "data": [
    {"Year": "0", "Fixed 4% Rule": 100, "Dynamic Bucket Automation": 100},
    {"Year": "10", "Fixed 4% Rule": 82, "Dynamic Bucket Automation": 89},
    {"Year": "20", "Fixed 4% Rule": 55, "Dynamic Bucket Automation": 74},
    {"Year": "30", "Fixed 4% Rule": 28, "Dynamic Bucket Automation": 58}
  ],
  "source": "Source: Morningstar State of Retirement Income (2024/2025 Projection)",
  "note": "Assumes a 5% initial withdrawal rate with 3% annual inflation."
}
By automating the "refill" mechanism—moving profits from Tier 3 to Tier 1 only during market upswings—you effectively "sell high" while maintaining a steady cash flow during "lows." This structural discipline removes emotional bias from your 2026 distribution plan.
Avoiding Common Pitfalls in Retiree Investing
Structural discipline is often compromised by two predatory forces: high-cost complexity and the illusion of safety. To protect a 2026 portfolio, retirees must pivot from "avoiding volatility" to "avoiding permanent capital erosion."
The Variable Annuity Trap
Variable annuities are frequently sold as "guaranteed" solutions, but they are often the most expensive products in a retiree's arsenal. According to FINRA (2024), total annual fees on these products—including mortality and expense (M&E) risk charges, administrative fees, and optional riders—can exceed 3.5% annually.
Over a 20-year retirement, a 3% fee differential can consume nearly 45% of a portfolio's potential terminal value.
| Investment Vehicle | Est. Annual Fees | 10-Year Drag on $1M | Liquidity |
|---|---|---|---|
| Variable Annuity | 2.5% – 4.0% | $280,000+ | Low (Surrender Charges) |
| Target Date Fund | 0.35% – 0.75% | $35,000 – $75,000 | High |
| Low-Cost Index ETF | 0.03% – 0.15% | $3,000 – $15,000 | High |
Source: Morningstar Fee Study & SEC Investor Bulletins (2024/2025).
The Inflationary Erosion of "Safety"
The second pitfall is "Cash Drag." Over-allocating to CDs or Money Market funds in 2026 provides nominal stability but guarantees a negative real return if inflation remains sticky.
As noted by the IMF World Economic Outlook (2025), even a "moderate" inflation rate of 2.5% reduces the purchasing power of $1,000,000 to approximately $776,000 in just 10 years.
Critical Insight: Real safety is not a stagnant principal balance; it is the maintenance of purchasing power. An "all-bond" or "all-cash" portfolio is a slow-motion default on your future lifestyle.
{
  "type": "area",
  "title": "Purchasing Power of $1M: Cash vs. Diversified (10-Year Forecast)",
  "index": "Year",
  "categories": ["Cash (2.5% Inflation)", "Diversified (5% Real Return)"],
  "data": [
    {"Year": "0", "Cash (2.5% Inflation)": 1000000, "Diversified (5% Real Return)": 1000000},
    {"Year": "2", "Cash (2.5% Inflation)": 951000, "Diversified (5% Real Return)": 1102500},
    {"Year": "4", "Cash (2.5% Inflation)": 904000, "Diversified (5% Real Return)": 1215500},
    {"Year": "6", "Cash (2.5% Inflation)": 859000, "Diversified (5% Real Return)": 1340000},
    {"Year": "8", "Cash (2.5% Inflation)": 817000, "Diversified (5% Real Return)": 1477000},
    {"Year": "10", "Cash (2.5% Inflation)": 776000, "Diversified (5% Real Return)": 1628000}
  ],
  "source": "Source: Federal Reserve Inflation Targets & Historical Market Returns (2024)",
  "note": "Diversified assumes a 60/40 split with 5% inflation-adjusted growth."
}
To avoid these pitfalls, retirees should mirror institutional behaviors—minimizing "middleman" fees and viewing cash only as a short-term bridge, not a long-term vault. Monitoring institutional shifts through a Smart Money Tracker for Institutional Portfolios can provide the necessary data to stay ahead of these retail-level traps.
FAQ
What is the biggest risk for retirees in 2026?
The greatest risk is not a market crash, but longevity risk and the erosion of purchasing power due to structural inflation, projected to stay around 2.7%.
Why are TIPS recommended as a best investment for retirees?
TIPS serve as a purchasing power floor because their principal scales upward with the Consumer Price Index (CPI), ensuring real growth above the cost of living.
How do REITs provide value in a retirement portfolio?
REITs, particularly in healthcare and residential sectors, offer contractual rent escalators that provide inflation-linked income and high-frequency liquidity.
What is the Bucket Strategy for retirement income?
It is a time-segmentation framework that divides assets into three tiers: Liquidity (0-2 years), Stability (3-10 years), and Growth (11+ years) to prevent forced selling during market downturns.
Where is the best tax-efficient place to hold REITs?
REITs should be placed in Roth IRAs to avoid the high ordinary income tax rates on distributions, allowing the 4%+ yield to be entirely tax-free.