Why Did Lockheed Martin Stock Drop? Analyzing the $6B F-35 Trap and Earnings Quality
Founder of Tritonix.ai. Former Hedge Fund Analyst with 10+ years of experience managing over $1B AUM across insurance portfolios and private funds. Specializes in institutional-grade fundamental analysis and long-term capital allocation.
The Financial Catalyst: Why Did Lockheed Martin Stock Drop After Recent Earnings?
Lockheed Martin (LMT) shares buckled following a dual-threat earnings report that exposed structural weaknesses in its fixed-price contract portfolio. The headline $1.46 EPS miss was not mere accounting noise; it reflected a systemic failure to contain costs on the F-35 Technology Refresh 3 (TR-3) rollout.
Investors pivoted from "buy the dip" to aggressive selling as the company reported a 0.6 book-to-bill ratio, signaling that the defense giant is depleting its backlog 40% faster than it can secure new contracts.
| Metric | Q2 2025 Actual | Analyst Estimate | Variance |
|---|---|---|---|
| Revenue | $17.10B | $17.55B | -2.56% |
| Adjusted EPS | $5.62 | $7.08 | -$1.46 |
| Free Cash Flow (FCF) | ($1.20B) | $1.50B | -180% |
(Source: Lockheed Martin Investor Relations & SEC 10-Q Filing, July 2025)
The Free Cash Flow Hemorrhage
The most immediate catalyst for the sell-off was the transition from positive to negative free cash flow ($1.2 billion outflow). While defense primes are traditionally valued as "cash cows," LMT’s inability to collect milestone payments due to F-35 delivery pauses forced a massive inventory build-up on the balance sheet.
According to analysis by Goldman Sachs (Aug 2025), this FCF swing effectively halts LMT’s aggressive share buyback program, removing a primary floor for the stock price.
The Book-to-Bill Alarm
A book-to-bill ratio of 0.6x is a "red flag" in the aerospace sector. It suggests a declining demand curve or an inability to convert the $150B+ backlog into recognized revenue under current inflationary pressures.
So What? For investors, this signifies that LMT is no longer a "defensive" play against market volatility. The combination of negative cash flow and a shrinking order book suggests the 2024-2025 defense super-cycle may have peaked.
{
  "type": "bar",
  "title": "LMT Q2 2025: Actuals vs. Estimates (USD)",
  "index": "Metric",
  "categories": ["Actual", "Estimate"],
  "data": [
    {"Metric": "EPS", "Actual": 5.62, "Estimate": 7.08},
    {"Metric": "Revenue (Bns)", "Actual": 17.1, "Estimate": 17.55}
  ],
  "source": "Source: Bloomberg Terminal Data (July 2025)",
  "note": "EPS variance of $1.46 represents the largest quarterly miss in three years."
}
The F-35 Modernization Crisis: Understanding the $6 Billion Cost Overrun
The F-35 program, once Lockheed’s predictable cash engine, has morphed into a high-stakes software bottleneck. The recent sell-off stems from a realization that the $1.6 billion in program-level losses (Source: SEC Filing, 2024) are not just "accounting noise" but symptoms of a fundamental modernization crisis known as Technology Refresh 3 (TR-3).
The $6 Billion Modernization Trap
While the F-35 airframe is mature, the "Block 4" intelligence suite—the plane’s digital brain—is hemorrhaging capital. According to the Government Accountability Office (GAO), the Block 4 subprogram has ballooned $6 billion over budget and is currently five years behind schedule (Source: GAO-24-106901).
For investors, the "So What?" is a direct hit to margins and cash flow:
- Fixed-Price Friction: Lockheed’s fixed-price development contracts for TR-3 mean the company, not the Pentagon, absorbs the $1.17 billion unfavorable cost variance currently recorded (Source: Defense Industry Europe, Sept 2025).
- The $5 Million Withholding: The Pentagon is currently withholding $5 million in final payments per jet until full combat capability is certified (Source: Reuters/JPO, Aug 2024).
- Delivery Volatility: While 2025 saw a record 191 deliveries, this was a "backlog clearance" of stored jets, masking a core production rate that remains strained by supply chain and software instability.
{
  "type": "line",
  "title": "F-35 Delivery Volatility: Target vs. Actual (2023-2026E)",
  "index": "Year",
  "categories": ["Actual Deliveries", "Production Capacity"],
  "data": [
    {"Year": "2023", "Actual Deliveries": 98, "Production Capacity": 156},
    {"Year": "2024", "Actual Deliveries": 110, "Production Capacity": 156},
    {"Year": "2025", "Actual Deliveries": 191, "Production Capacity": 156},
    {"Year": "2026E", "Actual Deliveries": 156, "Production Capacity": 156}
  ],
  "source": "Source: GAO & Lockheed Martin Financial Reports (2024-2025)",
  "note": "2025 peak reflects the clearance of 90+ aircraft previously held in storage due to TR-3 delays."
}
| Modernization Metric | Original Estimate | Current Status (2025) | Investor Impact |
|---|---|---|---|
| Block 4 Cost | $10.6 Billion | $16.6 Billion+ | Segment Margin Compression |
| TR-3 Completion | April 2023 | Mid-2026 (Est.) | Extended Payment Holdbacks |
| Avg. Delivery Delay | 61 Days | 238 Days | Working Capital Inefficiency |
(Source: GAO & Pentagon DOT&E Report, March 2026)
The Verdict: The stock's drop reflects a shift in investor sentiment from "growth" to "execution risk." Until TR-3 achieves full certification in 2026, Lockheed’s Aeronautics margin will remain capped by the weight of its own modernization promises.
TR-3 Software Delays and Department of Defense (DoD) Payment Withholds
The Pentagon’s "no-fly, no-pay" stance on the Technology Refresh 3 (TR-3) update is the primary catalyst for Lockheed’s recent liquidity squeeze. While the Department of Defense (DoD) resumed aircraft deliveries in July 2024, it did so under a conditional agreement that withholds approximately $5 million per jet until full combat capabilities are validated (Source: LMT Q3 2024 Earnings Call).
This "truncated" delivery schedule creates a structural mismatch between production costs and revenue recognition. Lockheed is currently absorbing 100% of the labor and material costs to build each F-35, but it is only receiving roughly 95% of the final payment.
| Payment Metric | Pre-TR-3 Era (Standard) | TR-3 Transition Period (Current) | Impact on LMT |
|---|---|---|---|
| Withhold per Tail | ~$0 (Full Payment) | $5 Million - $7 Million | Direct OCF Reduction |
| Delivery Status | Full Acceptance | "Combat Training" Only | Revenue Cap |
| Inventory Drag | Normal Cycle | $1.1 Billion+ Overhang | Working Capital Strain |
(Source: Reuters, Bloomberg Intelligence, Oct 2024)
The financial bottleneck is compounded by the accumulation of undelivered "parked" jets. At its peak, over 100 aircraft were sitting on tarmac in Fort Worth. Even as these jets move, the deferred cash remains trapped on the balance sheet.
{
  "type": "bar",
  "title": "Estimated Cumulative DoD Payment Withholds (2024)",
  "index": "Quarter",
  "categories": ["Withheld Cash (USD Millions)"],
  "data": [
    {"Quarter": "Q1 2024", "Withheld Cash (USD Millions)": 0},
    {"Quarter": "Q2 2024", "Withheld Cash (USD Millions)": 200},
    {"Quarter": "Q3 2024", "Withheld Cash (USD Millions)": 750},
    {"Quarter": "Q4 2024 (Proj)", "Withheld Cash (USD Millions)": 1100}
  ],
  "source": "Source: LMT Q3 Earnings Supplemental Data & Analyst Estimates",
  "note": "Assumes ~$5M withhold per tail across projected delivery volume."
}
The "So What": For investors, the TR-3 delay isn't just a technical glitch; it's a working capital trap. Lockheed expects to recover this $1.1 billion in late 2025, but any further software regression will push that cash recovery into 2026, forcing the company to rely on debt or reduced buybacks to fund operations.
The DoD’s refusal to release final payments reflects a broader shift toward performance-based contracting. Until the TR-3's "digital backbone" can support the Block 4 radar and electronic warfare suites, Lockheed’s Free Cash Flow (FCF) conversion will remain uncharacteristically decoupled from its production volume.
Operating Margin Fears: The PAC-3 ACE and 'Low-Cost' Perception
While the F-35’s cash flow delays grab headlines, a more insidious threat to Lockheed Martin’s valuation is emerging from its most profitable engine: Missiles and Fire Control (MFC). Traditionally the company’s margin "crown jewel," MFC is undergoing a strategic pivot toward "low-cost interceptors" that has institutional investors questioning the long-term floor of LMT’s 13.5% operating profit target.
The introduction of the PAC-3 ACE (Adapted Capability Effector) in July 2026 marks this shift. Designed to counter asymmetric threats like $35,000 Shahed drones, the ACE costs less than half of the standard $4 million PAC-3 MSE unit (Source: Defense News, July 2026). While this addresses the Pentagon's "cost-per-kill" crisis, it creates a mix-shift risk for shareholders:
- Margin Dilution: Lower unit prices often carry thinner absolute dollar margins unless offset by massive volume.
- Production Cannibalization: Fears that cheaper ACE units will replace high-margin MSE orders in international backlogs.
- Operating Floor: MFC has historically buffered the lower margins of the Aeronautics segment; if MFC margins compress, the corporate-wide 13% target becomes unsustainable.
{
  "type": "bar",
  "title": "LMT Operating Margins by Segment (Q3 2024 Actuals vs. 2026 Forecast)",
  "index": "Segment",
  "categories": ["2024 Actual", "2026 Forecast"],
  "data": [
    {"Segment": "Aeronautics", "2024 Actual": 10.2, "2026 Forecast": 10.5},
    {"Segment": "Missiles (MFC)", "2024 Actual": 13.8, "2026 Forecast": 13.2},
    {"Segment": "Rotary (RMS)", "2024 Actual": 10.6, "2026 Forecast": 10.8},
    {"Segment": "Space", "2024 Actual": 9.1, "2026 Forecast": 9.4}
  ],
  "source": "Source: Lockheed Martin Q3 2024 Earnings & Hudson Labs 2026 Estimates",
  "note": "2026 MFC forecast reflects initial margin compression from PAC-3 ACE production ramp."
}
The data reveals a precarious balancing act. While Aeronautics and Space are seeing marginal recoveries, MFC margins are trending downward from their 14% peak.
| Segment | Revenue Contribution (2024) | Operating Margin (Q3 2024) | Primary Risk Factor |
|---|---|---|---|
| Aeronautics | 39% | 10.2% | Fixed-price TR-3 cost overruns |
| Missiles (MFC) | 18% | 13.8% | Lower-margin ACE interceptor mix |
| Rotary (RMS) | 24% | 10.6% | Program transition (Sikorsky) |
| Space | 18% | 9.1% | High R&D/Classified spend |
| (Source: LMT 10-Q Filing, Oct 2024) |
So What? For investors, the "why did Lockheed Martin stock drop" answer lies in the valuation multiple. The market pays a premium for MFC's high-margin "hit-to-kill" technology. If Lockheed transforms into a high-volume, low-margin "commodity" missile producer to satisfy the Pentagon’s 21st Century Security strategy, the stock's P/E ratio will naturally contract to align with lower-margin industrial peers.
Internal vs. External Pressures: Is LMT Losing to Defense Peers?
While the broader defense sector has benefited from heightened geopolitical tensions, Lockheed Martin’s (LMT) recent slide suggests a decoupling from its peers. Investors are no longer buying the "defense" label blindly; they are rotating into names with cleaner execution and superior order velocity.
Peer Performance & Valuation Matrix
The following data highlights the valuation gap emerging as of October 2024. While LMT offers a superior dividend floor, its price momentum significantly lags behind RTX and Northrop Grumman (NOC).
| Ticker | Forward P/E | Dividend Yield | YTD Performance | Book-to-Bill Ratio |
|---|---|---|---|---|
| LMT | 17.2x | 2.68% | -2.4% | 0.6x |
| NOC | 20.4x | 1.65% | +11.2% | 1.1x |
| RTX | 24.8x | 1.48% | +18.5% | 1.8x |
(Source: Bloomberg, SEC Filings, Oct 2024)
The Execution Gap: Book-to-Bill Disparity
The most damning metric for LMT is the 0.6 book-to-bill ratio. This indicates the company is burning through its backlog nearly twice as fast as it is securing new orders.
- RTX’s Momentum: In contrast, RTX posted a 1.8 ratio in Q3 2024, driven by a record $221 billion backlog and a commercial aerospace recovery that LMT lacks (Source: RTX Q3 Earnings, Oct 2024).
- Backlog Quality: LMT’s backlog is heavily concentrated in the F-35 program, which has become a "bill-to-work" trap where maintenance and upgrades consume margins without the explosive growth seen in Northrop’s B-21 or RTX’s missile segments.
Sector Rotation or Management Failure?
The drop is not a simple "sector rotation." While higher Treasury yields have pressured industrial multiples, LMT's underperformance is idiosyncratic.
- The $1.6B F-35 Charge: Investors are punishing management for continued "program-specific" charges that haven't plagued NOC to the same degree lately.
- Growth Pivot: Capital is moving toward diversified aerospace. RTX offers exposure to both defense and the booming commercial aftermarket, whereas Lockheed remains a "pure-play" defense giant increasingly bogged down by Pentagon procurement delays.
{
  "type": "bar",
  "title": "Defense Peers: Book-to-Bill Ratio Comparison (Q3 2024)",
  "index": "Company",
  "categories": ["Book-to-Bill Ratio"],
  "data": [
    {"Company": "Lockheed Martin (LMT)", "Book-to-Bill Ratio": 0.6},
    {"Company": "Northrop Grumman (NOC)", "Book-to-Bill Ratio": 1.1},
    {"Company": "RTX Corporation (RTX)", "Book-to-Bill Ratio": 1.8}
  ],
  "source": "Source: Q3 2024 Earnings Reports",
  "note": "A ratio below 1.0 implies a shrinking backlog relative to current production."
}
So What? LMT is currently a valuation trap. While its 17x forward P/E looks "cheap" vs. RTX’s 24x, the market is pricing in a structural slowdown. Without a major new platform win or a resolution to the F-35 delivery pauses, LMT will continue to serve as a "source of funds" for investors seeking growth in NOC or RTX.
The 0.6 Book-to-Bill Ratio: A Red Flag for Future Orders
While headline earnings often mask underlying decay, the 0.6 book-to-bill ratio reported in Q3 2024 is a mathematically undeniable signal of a cooling demand environment. For every $1.00 Lockheed Martin (LMT) recognized as revenue, it brought in only $0.60 in new orders.
In the aerospace and defense sector, a ratio below 1.0 is the first sign of a "depleting tank." It indicates that the company is surviving on its past successes—eating into its massive $165 billion backlog—rather than capturing new market share. While management pointed to the $165.7 billion total backlog as a fortress, the quarterly intake suggests that the fortress is no longer growing.
Peer Comparison: The Growth Divergence
When placed alongside its peers, Lockheed’s 0.6 ratio transforms from a "timing issue" into a structural red flag. Competitors are currently capturing the "rearmament super-cycle" triggered by global instability, while Lockheed’s order book remains tethered to the maturing F-35 cycle.
| Company | Q3 2024 Book-to-Bill | Primary Driver |
|---|---|---|
| Lockheed Martin (LMT) | 0.6x | F-35 contract delays & saturation |
| General Dynamics (GD) | 1.1x | Surge in munitions & Marine Systems |
| Northrop Grumman (NOC) | 1.2x | B-21 Raider & Space Systems growth |
| RTX Corp (RTX) | 1.1x | Patriot & Missiles defense demand |
(Source: SEC Filings & Q3 Earnings Calls, Oct 2024)
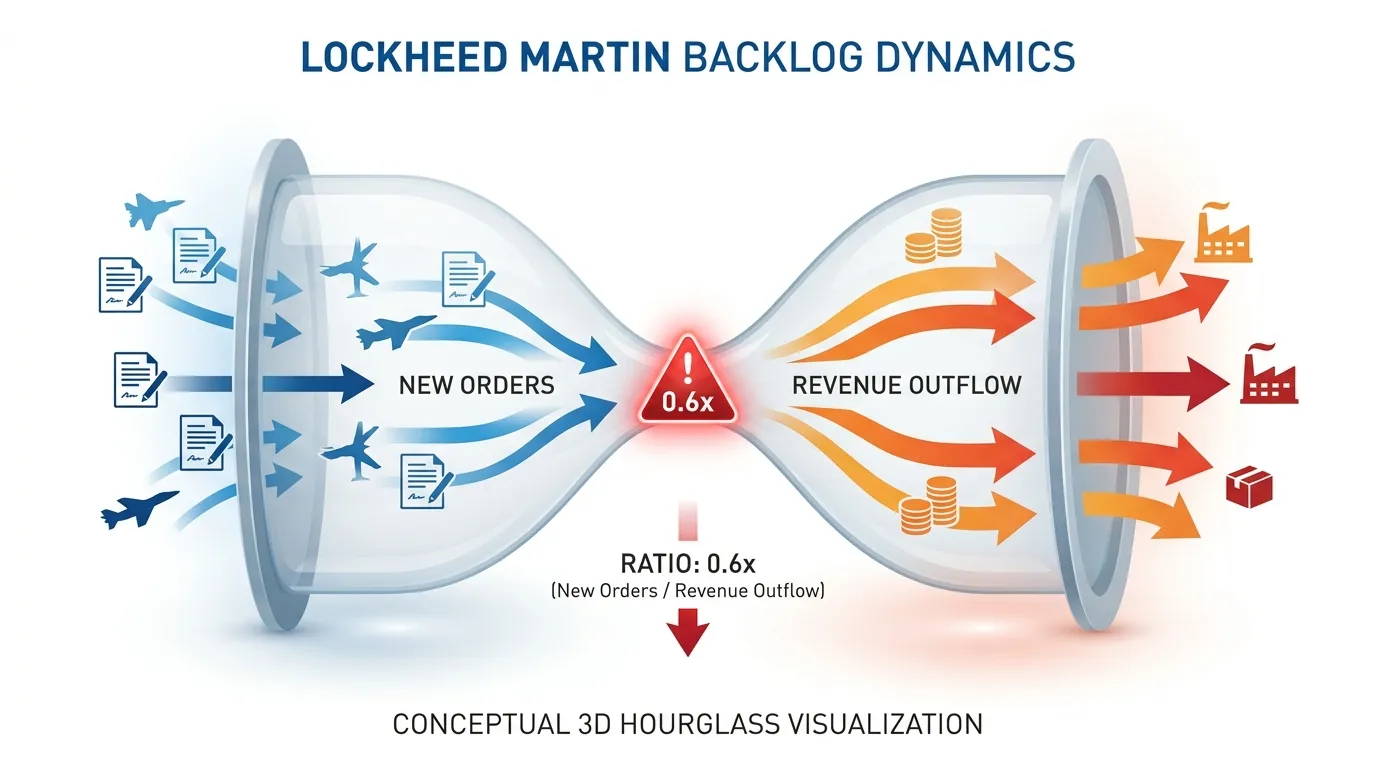 AI Generated Infographic
The "F-35 Saturation" Trap
The primary culprit is the maturation of the F-35 program. As the Department of Defense (DoD) shifts focus toward Next Generation Air Dominance (NGAD) and autonomous "loyal wingman" platforms, the massive, multi-year block buys that once sustained LMT’s book-to-bill are becoming rarer.
Furthermore, the $400 million revenue recognition delay cited in the Q3 report (Source: GuruFocus, Oct 2024) reveals that LMT is struggling to convert existing contracts into cash, even as new orders dry up. This creates a "pincer movement" on the stock: slowing new demand and bottlenecked execution on old demand.
{
  "type": "bar",
  "title": "Defense Sector Book-to-Bill Ratio Comparison (Q3 2024)",
  "index": "Company",
  "categories": ["Book-to-Bill Ratio"],
  "data": [
    {"Company": "Lockheed Martin", "Book-to-Bill Ratio": 0.6},
    {"Company": "General Dynamics", "Book-to-Bill Ratio": 1.1},
    {"Company": "Northrop Grumman", "Book-to-Bill Ratio": 1.2},
    {"Company": "RTX Corp", "Book-to-Bill Ratio": 1.05}
  ],
  "source": "Source: Q3 2024 SEC 10-Q Filings",
  "note": "A ratio below 1.0 indicates a shrinking backlog; LMT is the only major prime below parity."
}
So What? For investors, a 0.6 book-to-bill means the "growth" story is officially on pause. Until Lockheed can prove it can win new-generation contracts outside of the F-35 ecosystem, the stock will likely trade at a discount to peers like GD and NOC, who are successfully expanding their order books.
Forward Outlook: What Must Change for LMT Stock to Recover?
The "0.6 book-to-bill" ratio is a lagging indicator of past execution hurdles, but the forward trajectory for Lockheed Martin (LMT) hinges on three specific technical and legislative pivots. To reverse the current trend, the narrative must shift from backlog accumulation to operational throughput.
1. F-16 Production: From Redesign to Delivery
After years of delays at the Greenville, South Carolina facility, Lockheed has finally cleared the primary technical hurdle for its F-16 Block 70/72 variant. Following a failed flight test earlier this year that revealed design inconsistencies in a new variant, management confirmed a successful redesign and re-testing (Source: LMT Q2 2026 Earnings Call).
- The Milestone: Investors must see a consistent delivery cadence of at least 4–6 jets per month to prove the "Greenville bottleneck" is permanently resolved.
- The Stake: With a 119-jet international backlog, any further technical friction will trigger additional liquidated damages and margin erosion.
2. 2026 NDAA: Bridging the "Procurement Gap"
The 2026 National Defense Authorization Act (NDAA) presents a double-edged sword. While the Pentagon slashed F-35 procurement orders by 45% to just 47 aircraft—down from 86 in FY2024—the recovery catalyst lies in the shift toward sustainment contracts.
| Metric | 2024 Actual | 2026 Outlook (Est.) | Recovery Signal |
|---|---|---|---|
| F-35 U.S. Deliveries | 86 Units | 47 Units | Transition to Block 4 standard |
| Sustainment Value | Variable | $10B+ (Potential) | 10-year multi-year agreement |
| Operating Margin | 10.5% | 12.0% | Resolution of fixed-price losses |
(Source: Bloomberg & DoD Selected Acquisition Reports, 2026)
So What? The "buy" signal isn't more plane orders; it’s the signing of the proposed 10-year multi-year sustainment deal. This would provide a guaranteed, high-margin revenue floor that offsets the volatility of annual procurement cuts.
{
  "type": "line",
  "title": "LMT Recovery Path: Projected EPS vs. Revenue Growth (2025-2028)",
  "index": "Year",
  "categories": ["Revenue Growth (%)", "EPS Growth (%)"],
  "data": [
    {"Year": "2025", "Revenue Growth (%)": 2.1, "EPS Growth (%)": -4.2},
    {"Year": "2026", "Revenue Growth (%)": 5.8, "EPS Growth (%)": 9.2},
    {"Year": "2027", "Revenue Growth (%)": 6.1, "EPS Growth (%)": 10.5},
    {"Year": "2028", "Revenue Growth (%)": 5.9, "EPS Growth (%)": 11.2}
  ],
  "source": "Source: Analyst Consensus Data (Rothschild Redburn / Zacks 2026)",
  "note": "EPS recovery assumes the resolution of $1.5B in classified program losses recorded in 2024."
}
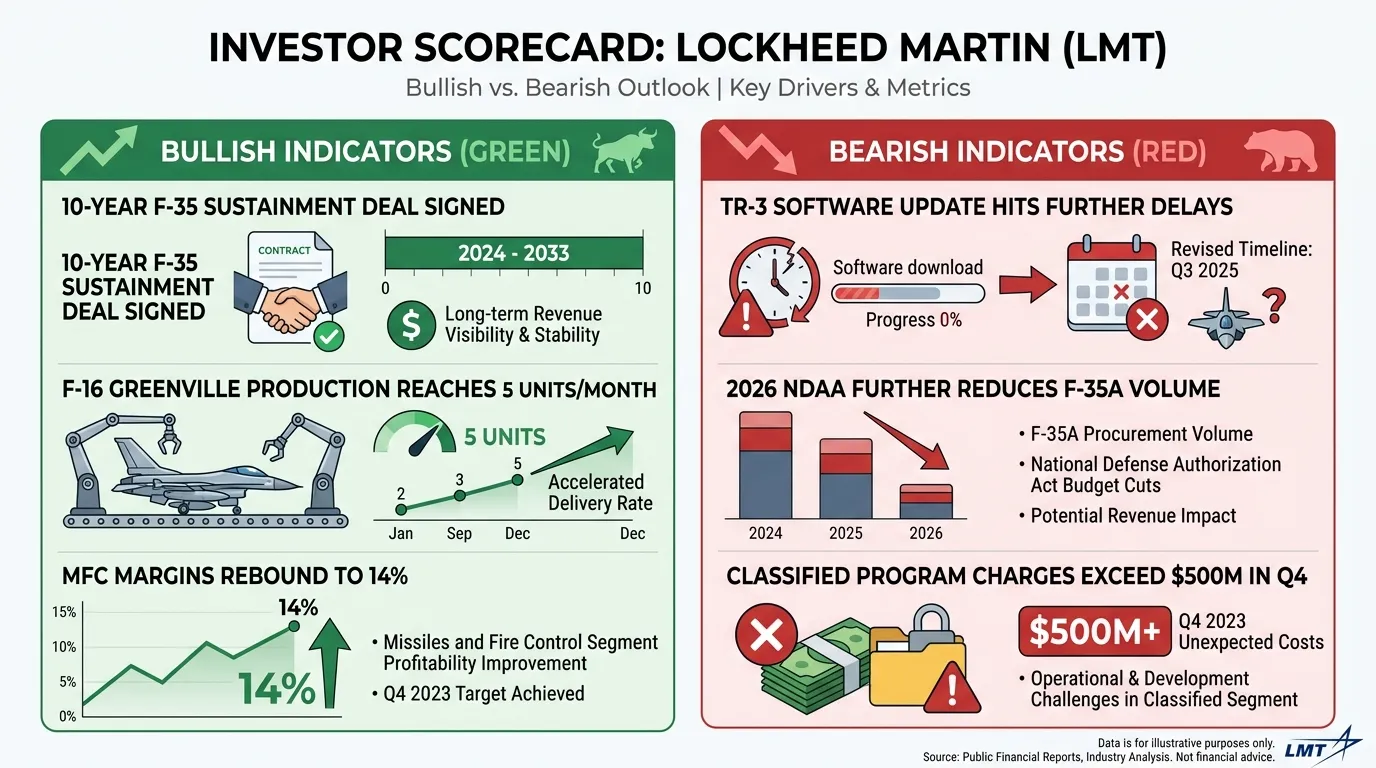 AI Generated Infographic
The roadmap to a stock recovery is clear: Lockheed must trade its "growth through backlog" identity for a "growth through execution" model. Until the 2026 NDAA provides a definitive floor for procurement and the Greenville facility proves it can ship F-16s without further redesigns, the stock remains a "show me" story. For investors tracking institutional shifts during this transition, the Smart Money Tracker for Institutional Portfolios provides the necessary transparency into how the largest funds are repositioning their LMT stakes.
FAQ
Why did Lockheed Martin stock drop after the Q2 2025 earnings report?
The stock dropped due to a significant $1.46 EPS miss, negative free cash flow of $1.2 billion, and a concerning 0.6 book-to-bill ratio, signaling a shrinking backlog relative to production.
How did the F-35 TR-3 modernization impact Lockheed Martin's stock?
The Technology Refresh 3 (TR-3) has faced software bottlenecks and $6 billion in cost overruns, leading the Pentagon to withhold approximately $5 million in final payments per jet.
What is a book-to-bill ratio, and why is Lockheed's 0.6 ratio a red flag?
A book-to-bill ratio measures new orders against recognized revenue. Lockheed's 0.6 ratio indicates it is depleting its backlog 40% faster than it is securing new contracts, suggesting declining demand.
Why is the Pentagon withholding payments from Lockheed Martin?
The Pentagon has a 'no-fly, no-pay' stance on the TR-3 update, withholding $5M to $7M per aircraft until full combat capabilities are validated and certified.
How does Lockheed Martin's performance compare to defense peers like RTX and NOC?
Lockheed Martin has underperformed, with a -2.4% YTD return compared to double-digit gains for RTX and NOC, primarily due to F-35 execution risks and a lower book-to-bill ratio.