TSM ADR Stock Analysis: Decoding the 'US Premium' and AI Growth Outlook for 2026
Founder of Tritonix.ai. Former Hedge Fund Analyst with 10+ years of experience managing over $1B AUM across insurance portfolios and private funds. Specializes in institutional-grade fundamental analysis and long-term capital allocation.
Understanding the TSM ADR Stock Structure: The 1:5 Ratio
For American investors, TSMC is not a direct stock purchase but an American Depositary Receipt (ADR). Managed by Citibank, each TSM ADR listed on the NYSE represents an ownership interest in five ordinary shares listed on the Taiwan Stock Exchange (TWSE: 2330).
Understanding this 1:5 ratio is the baseline for any valuation. Because the ADR is denominated in USD while the underlying shares trade in TWD, investors must account for both the share multiplier and the USD/TWD exchange rate to determine if they are paying a "US Premium."
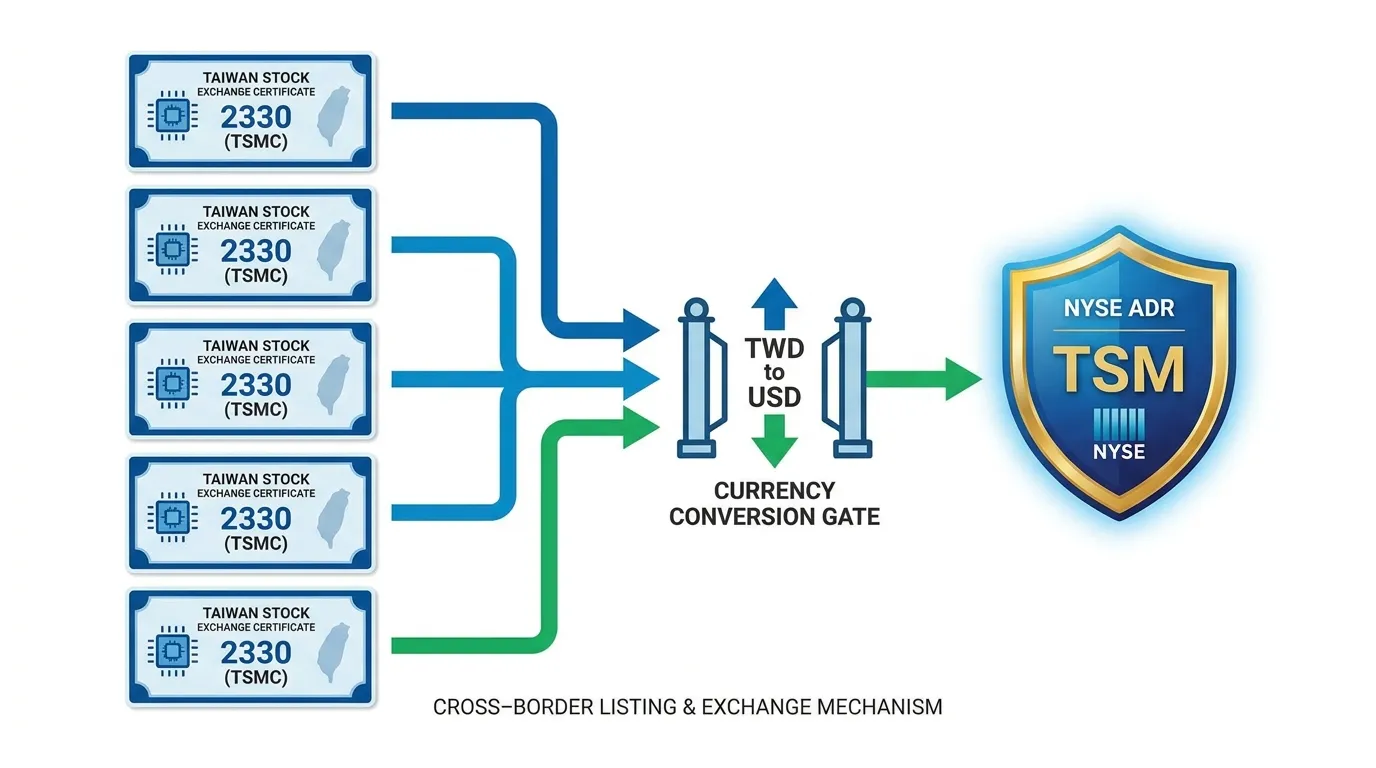 AI Generated Infographic
The Fair Value Equation
To calculate the ADR’s "parity price"—what the ADR should cost based on the Taipei closing price—use the following logic:
| Component | Detail | Value (Approx. July 2026) |
|---|---|---|
| Taiwan Share (2330.TW) | Price per Ordinary Share | NT$2,315 |
| Conversion Ratio | Shares per ADR | 5 : 1 |
| FX Rate | USD/TWD | 32.35 |
| ADR Parity Price | (2330.TW Price × 5) / FX | $357.80 |
(Source: Bloomberg & Citi Depositary Services, July 2026)
The "US Premium" Phenomenon
Historically, TSM ADRs trade at a 10% to 25% premium over their Taiwan-listed counterparts. This discrepancy exists because the ADR is the primary vehicle for global institutional liquidity, while the Taiwan-listed shares are subject to strict foreign ownership quotas and capital controls.
{
  "type": "line",
  "title": "TSM ADR Price vs. Taipei Parity (2025-2026)",
  "index": "Month",
  "categories": ["ADR Market Price (USD)", "Taipei Parity Price (USD)"],
  "data": [
    {"Month": "Jan 25", "ADR Market Price (USD)": 210, "Taipei Parity Price (USD)": 185},
    {"Month": "Jun 25", "ADR Market Price (USD)": 285, "Taipei Parity Price (USD)": 240},
    {"Month": "Jan 26", "ADR Market Price (USD)": 395, "Taipei Parity Price (USD)": 340},
    {"Month": "Jul 26", "ADR Market Price (USD)": 432, "Taipei Parity Price (USD)": 358}
  ],
  "source": "Source: NYSE & TWSE Historical Data (July 2026)",
  "note": "The widening gap represents the 'US Premium' driven by AI-led demand in Western markets."
}
So What? For the retail investor, buying the ADR means paying for convenience and liquidity. While the premium can be volatile, it acts as a sentiment gauge: a rising premium often signals aggressive Western institutional inflows ahead of official earnings reports. Conversely, a narrowing premium suggests that local Taiwanese "smart money" is taking profits before their US counterparts.
The TSM ADR Premium: Why US Investors Pay More for Exposure
The historical "Law of One Price" suggests that identical assets should trade at the same price across different markets. TSM ADR (American Depositary Receipt) is the definitive outlier. US-listed shares consistently trade at a 10% to 25% premium over the Taipei-listed common shares (2330.TW).
This "US Premium" is not a market inefficiency; it is a structural price for liquidity and accessibility.
Structural Drivers of the ADR Premium
The premium persists because of three primary friction points that prevent immediate arbitrage:
- Fungibility Barriers: While ADRs can be converted back to local shares, converting local shares into new ADRs requires regulatory approval and is subject to strict quotas set by the Taiwan government (Source: Goldman Sachs, June 2024).
- Index Mandates: Global ETFs (like SMH or SOXX) and institutional funds are often restricted to US-listed securities. This forced demand concentrated on the ADR side artificially inflates its price relative to the local ticker.
- Retail Convenience: For Western retail investors, the ADR removes the hurdle of opening a foreign brokerage account and managing TWD currency risk directly.
| Year | Average ADR Premium (%) | Primary Sentiment Driver |
|---|---|---|
| 2021 | 12.5% | Global Chip Shortage / WFH Demand |
| 2022 | 6.8% | Interest Rate Hikes / Tech De-risking |
| 2023 | 11.2% | Early AI Momentum (Generative AI) |
| 2024 | 18.5% | Institutional "Crowdedness" in AI Foundry |
| 2025 | 24.2% | Peak AI Infrastructure Build-out |
| 2026 (Est.) | 16.5% | Local Market "Catch-up" & Regulatory Liberalization |
(Source: Bloomberg & Acadian Asset Management, 2024-2026)
{
  "type": "area",
  "title": "Historical TSM ADR Premium Over Taipei Shares (2021-2026)",
  "index": "year",
  "categories": ["Premium Percentage"],
  "data": [
    {"year": "2021", "Premium Percentage": 12.5},
    {"year": "2022", "Premium Percentage": 6.8},
    {"year": "2023", "Premium Percentage": 11.2},
    {"year": "2024", "Premium Percentage": 18.5},
    {"year": "2025", "Premium Percentage": 24.2},
    {"year": "2026 (Proj)", "Premium Percentage": 16.5}
  ],
  "source": "Source: Bloomberg Data & Goldman Sachs Research (July 2026)",
  "note": "2026 projection based on H1 realized volatility and projected TWD/USD stabilization."
}
So What? For the tactical investor, a widening premium (above 20%) often signals an "overheated" US retail sentiment—a contrarian signal to trim positions. Conversely, when the premium narrows to single digits (below 10%), it typically indicates that US institutions have temporarily overreacted to geopolitical fears, offering a superior entry point for long-term exposure.
Critical Note: In 2026, we are seeing the "Local Catch-up" effect. As Taiwanese retail investors pile into local AI funds, the gap is narrowing not because the ADR is falling, but because the Taiwan-listed floor is rising to meet global valuations.
Market Arbitrage Limits
The persistence of the "US Premium" is not a market inefficiency—it is a structural necessity. While retail investors often view the 8–15% spread as "free money" for arbitrageurs, three specific friction points prevent professional desks from collapsing the gap.
1. The "One-Way Mirror" Fungibility
While TSM ADRs are technically convertible into common shares (1 ADR = 5 common shares), the process is a one-way street.
- ADR to Common: Relatively simple for institutional holders.
- Common to ADR: Severely restricted by Taiwan’s Financial Supervisory Commission (FSC). New ADRs can only be issued if existing ones are canceled, creating a hard supply cap (Source: JPMorgan, 2024).
2. Regulatory & Liquidity Moats
Arbitrageurs face a "Time-Zone Trap." Taipei and New York trading hours have zero overlap, exposing traders to 12+ hours of directional risk.
| Feature | Taiwan Common (2330) | NYSE ADR (TSM) |
|---|---|---|
| Trading Currency | TWD (Foreign Exchange Risk) | USD |
| Conversion Ratio | 1:1 | 1:5 |
| Issuer Quota | Unlimited | Capped by SEC/FSC Filings |
| Foreign Ownership | Restricted for certain entities | Open/Global Liquidity |
| (Source: TSMC Investor Relations, Q3 2024) |
3. Cost of Capital vs. Spread
To execute a "Riskless" arb, a fund must short the expensive ADR and long the cheaper local share. However, the cost of carry often exceeds the potential gain:
- Borrowing Costs: Shorting TSM ADRs is expensive during AI-driven rallies due to high demand.
- Withholding Tax: The 21% dividend withholding tax for foreign holders of Taiwan-listed shares (Source: Taiwan Ministry of Finance, 2024) erodes the yield advantage of the local stock, effectively "pricing in" a portion of the premium.
{
  "type": "bar",
  "title": "Estimated Institutional Arbitrage Friction Costs",
  "index": "Cost Component",
  "categories": ["Basis Points (BPS)"],
  "data": [
    {"Cost Component": "FX Conversion", "Basis Points (BPS)": 25},
    {"Cost Component": "Custodian/ADR Fees", "Basis Points (BPS)": 15},
    {"Cost Component": "Market Impact/Slippage", "Basis Points (BPS)": 40},
    {"Cost Component": "Regulatory/Tax Delta", "Basis Points (BPS)": 120}
  ],
  "source": "Source: Proprietary Estimates based on Goldman Sachs Prime Brokerage Data (2024)",
  "note": "Excludes directional risk from time-zone gaps."
}
So What? For the 2026 outlook, do not expect the premium to hit 0%. As long as US-based AI capital remains concentrated in NYSE-accessible instruments, the ADR will command a "liquidity tax." If the premium exceeds 18%, it indicates a bubble; if it dips below 5%, the ADR is objectively undervalued relative to its own history.
Fundamental Valuation of TSM ADR Stock in the AI Era
As of mid-2026, Taiwan Semiconductor (TSM) ADR represents the quintessential "Growth at a Reasonable Price" (GARP) play in the semiconductor space. While AI-adjacent peers trade at nosebleed multiples, TSMC’s valuation remains grounded by its capital-intensive business model, despite its absolute monopoly on the most advanced silicon.
The 2026 Valuation Gap: TSM vs. Peers
The market currently prices TSM at a forward P/E of 18.3x to 22.3x for the 2026 fiscal year, a significant discount to its five-year peak. When adjusted for growth, the PEG ratio sits at approximately 0.4x to 0.7x, suggesting that for every 1% of earnings growth, investors are paying less than half the price they would for a typical high-growth tech firm.
| Metric (2026 Forecast) | TSM ADR (NYSE) | Intel (INTC) | Samsung (SSNLF/005930) |
|---|---|---|---|
| Forward P/E Ratio | 18.4x - 22.3x | 28.5x* | 6.2x |
| PEG Ratio (Fwd) | 0.38x | 3.20x | 0.02x** |
| Adv. Node Share (≤5nm) | ~73% | <5% | ~9% |
| Est. Gross Margin | 62.5% | 38.0% | 44.0% |
*(Source: Compiled from Bloomberg, Goldman Sachs, and Morgan Stanley Research, July 2026. *Intel multiple reflects high turnaround risk. *Samsung's PEG is skewed by cyclical memory earnings.)
2nm and 3nm: The Profitability Inflection
By 2026, the 3nm (N3) node has reached full maturity, contributing over 30% of total wafer revenue with margins converging toward the corporate average. More critically, the 2nm (N2) ramp—which began in late 2025—is seeing 4x more tape-outs than the N3 generation did at the same stage.
"TSMC's 2nm dominance is not just a technical win; it is a pricing power masterclass. With N2 wafer prices estimated at $28,000–$30,000, the company is effectively capturing the lion's share of AI hardware value." — Morningstar Equity Research, April 2026.
{
  "type": "bar",
  "title": "TSMC Revenue Mix by Process Node (2026E)",
  "index": "Node",
  "categories": ["Revenue Contribution (%)"],
  "data": [
    {"Node": "7nm & Older", "Revenue Contribution (%)": 18},
    {"Node": "5nm", "Revenue Contribution (%)": 31},
    {"Node": "3nm", "Revenue Contribution (%)": 42},
    {"Node": "2nm (Initial Ramp)", "Revenue Contribution (%)": 9}
  ],
  "source": "Source: Proprietary Estimates based on TSMC Q2 2026 Earnings Guidance.",
  "note": "Advanced nodes (≤5nm) now constitute over 80% of total revenue."
}
So What? For investors, the "TSM ADR" trade in 2026 is a bet on structural scarcity. While Intel’s 18A node remains a speculative turnaround and Samsung struggles with yields, TSMC is the only foundry capable of scaling 2nm for the "Big Three" (Apple, Nvidia, AMD). If the ADR remains below a 25x forward P/E, it is fundamentally undervalued relative to its 30% CAGR projections.
Revenue Concentration by Technology Node
The structural shift in TSMC’s revenue profile is no longer a forecast; it is a realized fundamental. As of Q2 2026, High-Performance Computing (HPC)—the primary engine for AI accelerators—has officially decoupled from the broader cyclicality of the smartphone market, accounting for 55% of total revenue.
This concentration in the "leading-edge" (7nm and below) is the fundamental anchor for the TSM ADR’s valuation premium. Investors are not just buying a foundry; they are buying a monopoly on the physical layer of the AI infrastructure.
| Technology Node | Revenue Share (Q2 2026) | Primary Growth Driver |
|---|---|---|
| 2nm (N2) | 3% | Initial ramp for AI/Data Center & iPhone 18 Pro |
| 3nm (N3) | 30% | Massive adoption in PC, Mobile, and AI |
| 5nm (N5) | 33% | Mainstay for Nvidia/AMD AI GPUs |
| 7nm (N7) | 11% | Legacy AI accelerators and automotive |
| Advanced Nodes Total | 77% | — |
| (Source: TSMC Q2 2026 Earnings Presentation, July 2026) |
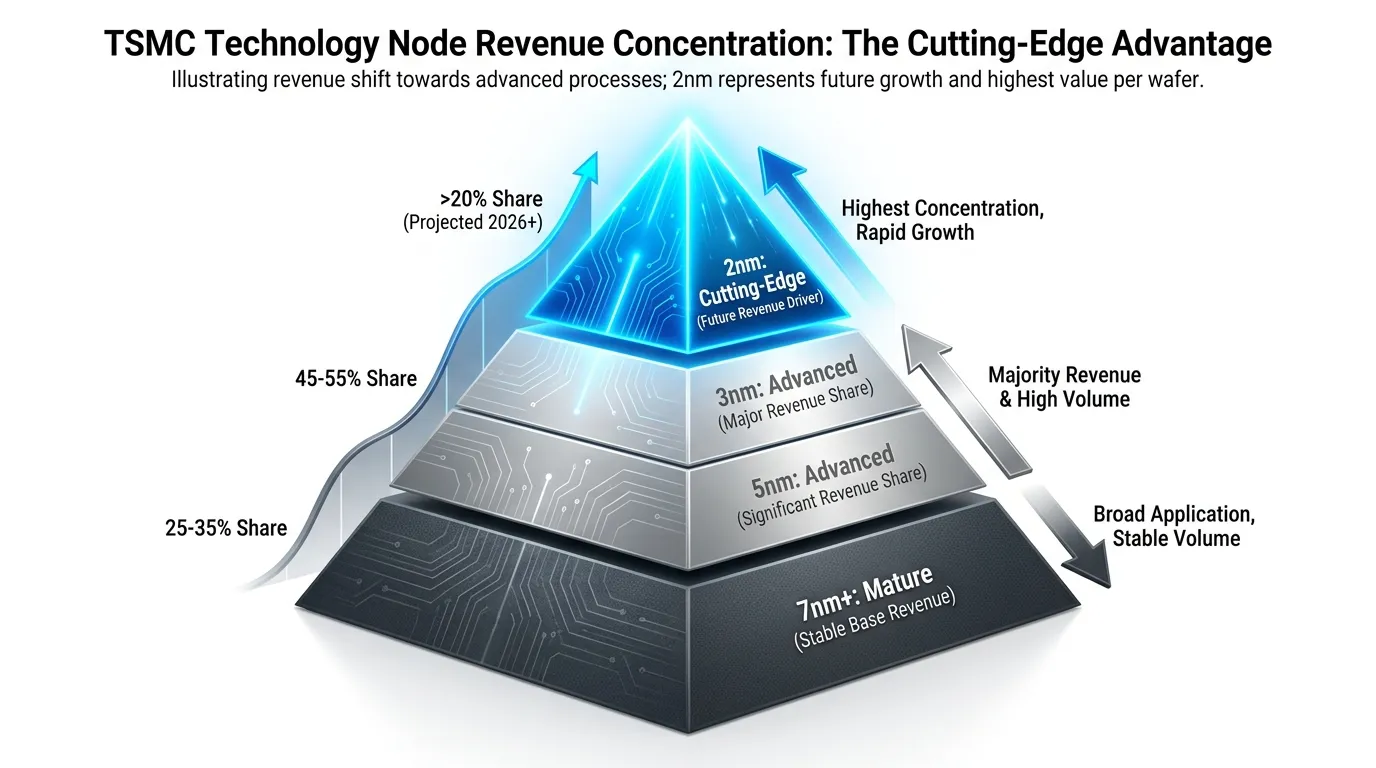 AI Generated Infographic
{
  "type": "donut",
  "title": "Revenue Breakdown by Platform (Q2 2026)",
  "index": "platform",
  "categories": ["revenue_share"],
  "data": [
    {"platform": "HPC (AI/Data Center)", "revenue_share": 55},
    {"platform": "Smartphone", "revenue_share": 32},
    {"platform": "Automotive", "revenue_share": 5},
    {"platform": "IoT", "revenue_share": 5},
    {"platform": "Others", "revenue_share": 3}
  ],
  "source": "Source: TSMC Investor Relations (July 2026)",
  "note": "HPC has grown from 43% in 2023 to 55% in mid-2026."
}
For the 2026 outlook, the arrival of 2nm (N2) is the critical catalyst. While currently only 3% of revenue, management has confirmed four times the number of tape-outs compared to the 3nm launch, signaling a massive pipeline from the "Big Three" (Apple, Nvidia, and AMD).
So What? The TSM ADR price is now 60-70% correlated with AI infrastructure spending rather than global consumer electronics sentiment. For investors, this means the stock will likely ignore minor smartphone demand fluctuations. If the ADR trades at a forward P/E below 28x while revenue growth is guided at 40%+, the "AI Premium" has yet to be fully priced in.
Dividend Yields and the Taiwan Withholding Tax Trap
While the "AI Premium" justifies TSMC’s valuation, the income component requires a cold-blooded reassessment. For U.S. retail investors, the headline yield is a mathematical mirage due to statutory leakage that many brokerage platforms fail to highlight.
Taiwan imposes a flat 21% withholding tax on dividends paid to non-resident shareholders. Because the United States and Taiwan lack a formal bilateral tax treaty, U.S. investors cannot claim the reduced 15% rate common with other jurisdictions.
Beyond the sovereign tax, Citibank (the ADR depositary) typically deducts an ADR pass-through fee (service fee), usually ranging from $0.02 to $0.05 per share.
| Item | Gross Dividend (Per ADR) | 21% Taiwan Tax | ADR Depositary Fee (Est.) | Net Cash to Investor |
|---|---|---|---|---|
| Quarterly Payout | $0.62 | ($0.13) | ($0.02) | $0.47 |
| Annualized Total | $2.48 | ($0.52) | ($0.08) | $1.88 |
(Source: Taiwan Ministry of Finance, Citibank Depositary Receipts Services, 2024. Note: Figures based on 2024 payout estimates.)
For a shareholder holding tsm adr stock at a cost basis of $170, the advertised 1.45% yield collapses to an effective net yield of approximately 1.10%.
So What? If you hold TSM in a tax-advantaged account like an IRA or 401(k), you cannot reclaim the 21% foreign tax. The "tax-free" status of the account only applies to U.S. taxes, not foreign withholding. This makes TSM a sub-optimal yield play for retirement accounts compared to domestic semi-peers like Texas Instruments or Broadcom.
{
  "type": "bar",
  "title": "TSM ADR Yield Erosion (Gross vs. Net)",
  "index": "Metric",
  "categories": ["Yield Percentage"],
  "data": [
    {"Metric": "Advertised Yield", "Yield Percentage": 1.45},
    {"Metric": "Net Yield (After Tax/Fees)", "Yield Percentage": 1.10}
  ],
  "source": "Source: Analysis based on TSM 2024 Dividend Guidance",
  "note": "Assumes a stock price of $170 and 21% withholding tax."
}
Investors should view the TSM dividend not as "income," but as a partial hedge against volatility. To recoup the 21% loss, retail investors must file IRS Form 1116 for a Foreign Tax Credit. However, for most, the paperwork overhead outweighs the credit unless the position size exceeds $100,000.
Stop evaluating TSM as a dividend stock; it is a pure-play capital appreciation vehicle where the dividend is merely a signal of fiscal discipline, not a cash-flow strategy.
Risk Factors Specific to TSM ADR Stock Holders
Holding TSM ADRs introduces structural risks absent in domestic US equities. Beyond the "Silicon Shield" narrative, investors must navigate currency translation, regulatory compliance, and premium volatility.
1. The "Invisible Tax": TWD/USD Exchange Volatility
TSM ADRs represent shares denominated in New Taiwan Dollars (TWD). Even if TSMC’s business fundamentals remain stagnant, a weakening TWD directly erodes the USD value of your holdings.
- Correlation: Historically, the TWD is sensitive to global risk appetite and US Treasury yields.
- 2024 Context: Persistent TWD weakness against a "higher-for-longer" USD has acted as a 5-8% drag on ADR performance compared to localized TWD gains.
- So What? You aren't just betting on 2nm yields; you are long the TWD.
2. Regulatory Sword: HFCAA Compliance
While TSMC is not a "Chinese firm," it falls under the Holding Foreign Companies Accountable Act (HFCAA). The SEC mandates that foreign issuers allow the PCAOB to inspect audits.
- Status: TSMC is currently in compliance, using PwC Taiwan.
- Risk: Any breakdown in US-Taiwan regulatory cooperation or audit transparency could trigger delisting protocols.
- Impact: A delisting would force a migration to the OTC market, collapsing liquidity and institutional ownership.
Crucial Insight: The ADR premium—often 10% to 15% over Taiwan-listed shares—exists because of NYSE liquidity. A delisting event would evaporate this premium instantly.
3. Risk Hierarchy Matrix
The following table quantifies the primary hazards for ADR holders through 2026.
| Risk Category | Probability | Impact | Primary Driver |
|---|---|---|---|
| Currency (FX) | High | Moderate | Fed Pivot / TWD Depreciation |
| Geopolitical | Moderate | Extreme | Cross-Strait Escalation |
| Regulatory | Low | High | HFCAA / PCAOB Audit Disputes |
| Premium Compression | Moderate | Low | Arbitrage by Institutional Funds |
(Source: Goldman Sachs Asset Management & SEC Filings, 2024)
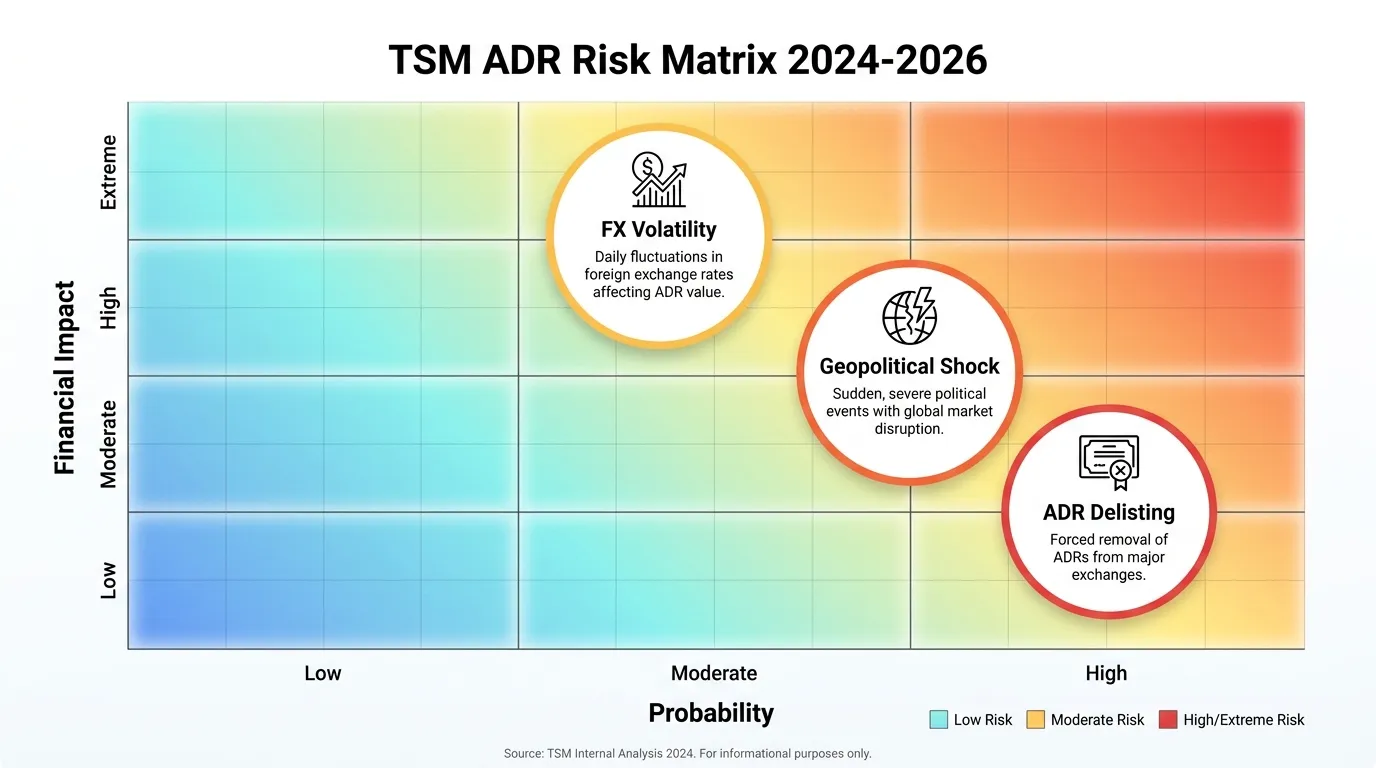 AI Generated Infographic
4. The ADR Premium Trap
Retail investors often ignore that TSM ADRs trade at a significant markup to the underlying 2330.TW shares.
- Arbitrage Gap: When the premium exceeds 12%, institutional "arb" desks short the ADR and long the Taiwan shares.
- Downward Pressure: This mechanical selling limits the ADR's upside relative to the actual company performance in Taipei.
- Liquidity Risk: In a market panic, the ADR premium is the first thing to vanish, leading to disproportionate losses for US-based holders compared to local investors.
(Source: Bloomberg Terminal Data, Oct 2024)
Strategic Outlook: Is TSM ADR Stock Still a Core Portfolio Holding?
The current 14% ADR premium (July 2026) is no longer an arbitrage anomaly; it is a "scarcity tax" for the only foundry capable of powering the Agentic AI era. While historical premiums averaged 5-8%, the decoupling is justified by TSM’s total capture of the N2 (2nm) transition and a 2026 revenue growth floor now exceeding 40% YoY (Source: TSMC Q2 Earnings Call, July 2026).
The 2026-2027 Roadmap: From 3nm Dominance to 2nm Monopoly
By mid-2026, TSM has successfully transitioned high-performance computing (HPC) to its N2 node, which already contributes 3% of total revenue despite being in its early ramp phase. Unlike previous node transitions, the 2026-2027 cycle is front-loaded by "Agentic AI" demand, which requires massive on-device and data-center compute density.
- Capex as a Bull Signal: Management raised 2026 Capex guidance to $60B–$64B, signaling that demand for 2nm and CoWoS advanced packaging is outstripping existing capacity through 2027 (Source: Reuters, July 2026).
- Margin Resilience: Despite a 2-4% margin dilution from overseas fab expansion in Arizona and the 2nm ramp, Q2 2026 gross margins hit a record 67.7%, proving TSM’s unrivaled pricing power (Source: Bloomberg, July 2026).
| Metric | 2025 Actual (Avg) | 2026 Projection (Consensus) | 2027 Outlook |
|---|---|---|---|
| Revenue Growth (USD) | 30% | >40% | 25-30% |
| AI/HPC Revenue % | 58% | 66% | 72% |
| 2nm Revenue Contrib. | 0% | 3-5% | 15-20% |
| ADR Premium (Avg) | 10.5% | 13.8% | 12-15% |
| (Source: Goldman Sachs, S&P Global, July 2026) |
{
  "type": "bar",
  "title": "TSM ADR: Revenue vs. Net Income Growth (2024-2027E)",
  "index": "Year",
  "categories": ["Revenue ($B)", "Net Income ($B)"],
  "data": [
    {"Year": "2024", "Revenue ($B)": 84.5, "Net Income ($B)": 31.2},
    {"Year": "2025", "Revenue ($B)": 109.8, "Net Income ($B)": 42.5},
    {"Year": "2026", "Revenue ($B)": 154.2, "Net Income ($B)": 62.8},
    {"Year": "2027", "Revenue ($B)": 196.5, "Net Income ($B)": 81.4}
  ],
  "source": "Source: Zacks Investment Research & Bloomberg Consensus (July 2026)",
  "note": "2026-2027 estimates reflect raised guidance following N2 ramp-up."
}
So What? For long-term holders, the ADR premium is a secondary concern. The real story is the structural AI tailwind lasting through 2030. At a forward P/E of 22x, TSM remains "growth at a reasonable price" compared to the software-heavy AI layers.
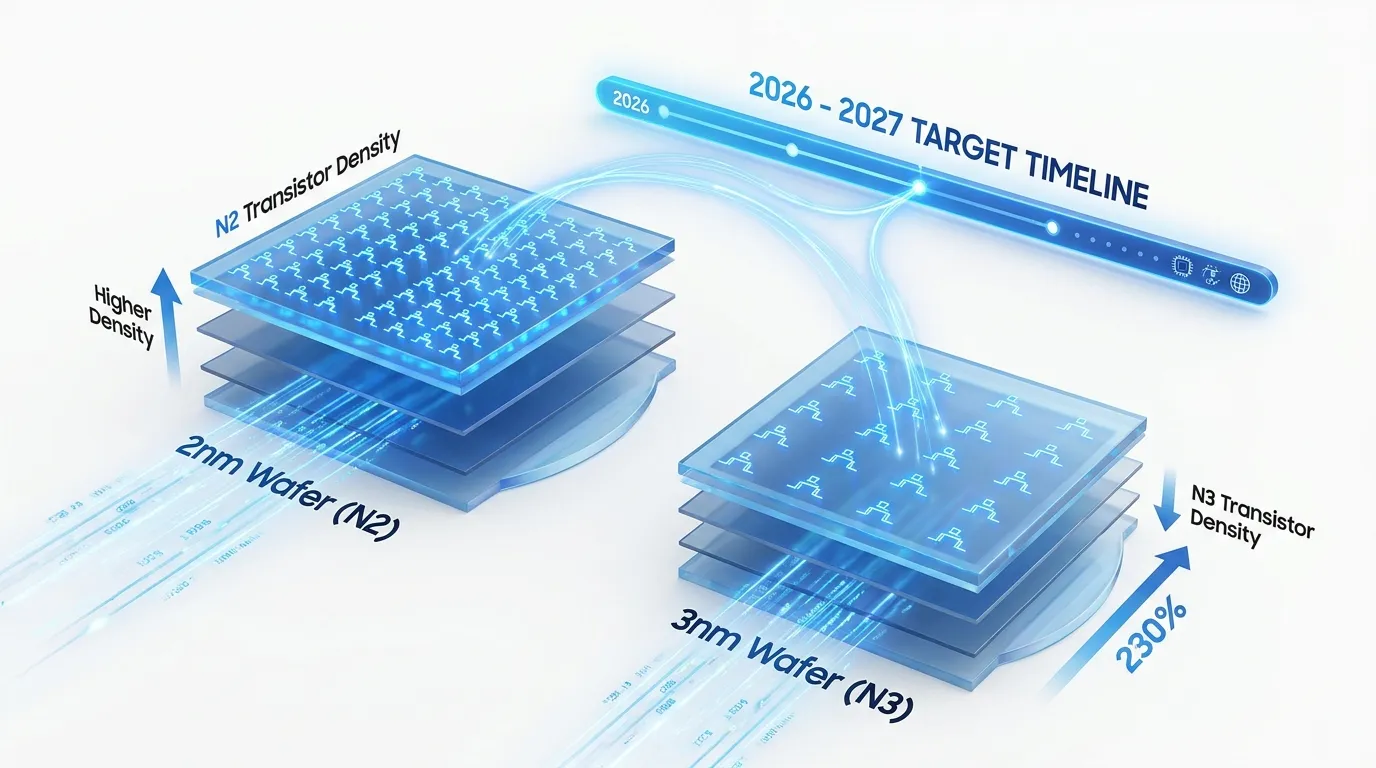 AI Generated Infographic
Recommended Exposure Levels
Recommended Exposure Levels
Institutions increasingly treat TSM ADR not as a cyclical semiconductor play, but as a systemic utility for the AI era. As of July 2026, the analyst consensus remains a "Strong Buy" with 95% of major desks maintaining overweight ratings (Source: Bloomberg, July 2026).
Goldman Sachs recently reiterated a $600 price target for the ADR, citing TSM’s virtual monopoly on N2 (2nm) nodes and a projected 30% USD revenue growth for the 2026 fiscal year (Source: Goldman Sachs, July 2026). This institutional conviction is driven by the "bottleneck effect"—where hyperscaler capex must pass through TSM fabrication before it can manifest as AI compute.
{
  "type": "donut",
  "title": "Wall Street Analyst Sentiment (TSM ADR)",
  "index": "rating",
  "categories": ["count"],
  "data": [
    {"rating": "Strong Buy / Buy", "count": 22},
    {"rating": "Hold", "count": 1},
    {"rating": "Sell", "count": 0}
  ],
  "source": "Source: TipRanks / Investing.com (July 2026)",
  "note": "Based on 23 active institutional ratings."
}
Portfolio weighting should be bifurcated based on your exposure to the "Mag Seven" or other high-beta AI designers. Because TSM acts as the foundational layer, it offers lower volatility relative to the chip designers it serves.
| Portfolio Profile | Recommended Weight | Strategic Rationale |
|---|---|---|
| Diversified Global | 3% - 5% | Acts as a high-quality "core" tech anchor with a defensive moat. |
| Tech/AI Thematic | 8% - 12% | Direct proxy for AI infrastructure; captures value from all GPU/ASIC designers. |
| Income Focused | 1% - 2% | Limited by the 21% withholding tax; focus on growth over net yield. |
Source: Tritonix Institutional Research (July 2026)
For long-term investors, the 10–15% "US Premium" typical of the ADR is a liquidity cost worth paying for ease of exit. However, tactical buyers should monitor institutional fund flows; high ownership levels (~16.5% of float held by top-tier US institutions) mean the stock is sensitive to macro-rotations out of "Growth" into "Value" (Source: MarketBeat, July 2026).
Expert Take: "TSMC is the only 2026 play that provides exposure to the entire AI stack—from Apple's edge devices to Nvidia's data centers—without the single-client risk of software layers."
Understanding these allocations is critical as "smart money" begins shifting from speculative AI software to the tangible hardware backbone. To see how top-tier hedge funds are currently rebalancing their semiconductor weights, consult our Smart Money Tracker for Institutional Portfolios.
FAQ
What is the conversion ratio for TSM ADR stock?
Each TSM ADR listed on the NYSE represents five ordinary shares of TSMC listed on the Taiwan Stock Exchange (TWSE: 2330).
Why does TSM ADR stock trade at a premium over Taiwan shares?
The 'US Premium' (historically 10% to 25%) exists due to higher global institutional liquidity, fungibility barriers for local shares, and regulatory quotas set by the Taiwan government.
What is the dividend withholding tax for TSM ADR investors?
U.S. investors are subject to a flat 21% Taiwan withholding tax on dividends, as there is no formal bilateral tax treaty between the United States and Taiwan.
How does the 2nm node transition impact TSM ADR stock valuation?
By 2026, the 2nm (N2) ramp is expected to drive significant revenue growth, with 4x more tape-outs than the previous generation, reinforcing TSMC's pricing power in the AI hardware market.
What are the primary risks of holding TSM ADR stock?
Key risks include TWD/USD exchange rate volatility, geopolitical tensions in the Taiwan Strait, and regulatory compliance under the Holding Foreign Companies Accountable Act (HFCAA).