Copper Related Stocks 2026: The AI-Driven Supply Crunch Strategy
Specializes in alternative data and valuation models. Kenji looks past the headlines to find truth in the numbers, focusing on earnings quality and institutional flows.
The 2026 Copper Thesis: AI Infrastructure and the Supply Deficit
The copper market has decoupled from traditional industrial cycles. By mid-2026, the pivot is clear: AI infrastructure is no longer a marginal demand driver; it is the primary support for a new structural price floor. While traditional construction in China remains stagnant, the physical buildout of the global AI grid is consuming the world’s refined surplus.
The primary catalyst is copper intensity. AI-ready data centers require high-density power distribution and liquid cooling systems that traditional facilities do not. According to S&P Global (Jan 2026), an AI training facility consumes up to 47 tonnes of copper per megawatt (MW), nearly triple the intensity of legacy cloud centers.
| Metric | Standard Data Center | AI Hyperscale Facility |
|---|---|---|
| Power Density (per rack) | 5 - 10 kW | 130 - 300 kW |
| Copper Intensity (per MW) | 8 - 15 Tonnes | 27 - 47 Tonnes |
| Total Site Copper Usage | 5k - 15k Tonnes | Up to 50k Tonnes |
(Source: S&P Global & Copper Development Association, 2025-2026)
This "step-change" in demand arrives as global mine supply hits a wall. The long-term incentive price—the market price required to justify massive greenfield investments—has reset significantly higher. Due to double-digit AISC (All-In Sustaining Cost) inflation and declining ore grades in Chile, analysts at BMI and Macquarie now peg the minimum incentive floor at $10,200–$13,000 per tonne (Source: BMI, July 2026).
{
  "type": "bar",
  "title": "Projected Copper Demand: Standard vs. AI Data Centers (2024-2030)",
  "index": "Year",
  "categories": ["Standard DC Demand (kt)", "AI-Specific DC Demand (kt)"],
  "data": [
    {"Year": "2024", "Standard DC Demand (kt)": 420, "AI-Specific DC Demand (kt)": 80},
    {"Year": "2026E", "Standard DC Demand (kt)": 485, "AI-Specific DC Demand (kt)": 235},
    {"Year": "2028E", "Standard DC Demand (kt)": 540, "AI-Specific DC Demand (kt)": 560},
    {"Year": "2030E", "Standard DC Demand (kt)": 600, "AI-Specific DC Demand (kt)": 1000}
  ],
  "source": "Source: Goldman Sachs Research & S&P Global (Q1 2026)",
  "note": "AI-specific demand is projected to account for 58% of total data center copper consumption by 2030."
}
So What? For investors, the "incentive price" acts as a valuation floor for copper producers. If the spot price dips below $10,000, new supply stalls, further tightening the deficit. Stocks with low AISC and projects nearing production in 2026/2027 are best positioned to capture the unprecedented premium driven by the "silicon-to-copper" bridge.
Quantifying the AI Multiplier on Copper Demand
The structural shift from traditional cloud computing to Generative AI has fundamentally altered the copper intensity of digital infrastructure. While a legacy data center requires approximately 20 metric tons of copper per megawatt (MW), AI-specific facilities—driven by high-density racks and advanced cooling—demand upwards of 40 to 50 metric tons per MW (Source: S&P Global, Jan 2026).
This "AI Multiplier" is not merely a scaling of existing needs but a leap in physical material density. AI GPUs, such as NVIDIA’s Blackwell architecture, consume significantly more power than standard CPUs, requiring massive upgrades in heavy-gauge busbars and high-voltage power distribution units (PDUs) to prevent voltage drops.
{
  "type": "bar",
  "title": "Copper Intensity by Data Center Archetype (Tons/MW)",
  "index": "Archetype",
  "categories": ["Metric Tons per MW"],
  "data": [
    {"Archetype": "Legacy Enterprise", "Metric Tons per MW": 15},
    {"Archetype": "Hyperscale Cloud", "Metric Tons per MW": 27},
    {"Archetype": "AI Training Facility", "Metric Tons per MW": 47}
  ],
  "source": "Source: S&P Global Market Intelligence (2026)",
  "note": "Intensity includes internal wiring, PDUs, and chip-level cooling."
}
Beyond the server rack, the transformer bottleneck is the primary driver of the 2026 supply crunch. Copper typically accounts for 10-15% of total transformer costs (Source: IEA, 2026). For every ton of copper used inside an AI data center, an additional 3 to 4 tons are required in the surrounding grid infrastructure—substations, step-down transformers, and transmission reinforcements—to support the localized load.
| Component | Copper Usage (Est. per 1GW AI Campus) | Critical Role |
|---|---|---|
| Transformers & Grid | 150,000 - 200,000 Tons | Stepping down 400V/rack power |
| Power Busbars | 12,000 - 15,000 Tons | High-current low-voltage distribution |
| Liquid Cooling | 5,000 - 8,000 Tons | Heat exchangers & chip cold plates |
| Cabling (LV/MV) | 10,000 - 12,000 Tons | Inter-rack & backup power wiring |
Source: Goldman Sachs Commodities Research & J.P. Morgan (2025-2026 Forecasts)
So What? This creates a permanent price floor. Hyperscalers like Microsoft and Meta are "price-inelastic"; they will pay any premium for copper to avoid multi-billion dollar delays in AI deployment. For investors, this means the "AI Premium" is now baked into the 2026-2030 copper demand curve, making $12,000/ton the new structural baseline.
Categorizing Copper Related Stocks: Pure-Plays vs. Diversified Miners
To navigate the 2026 copper market, investors must distinguish between price-leveraged pure-plays and margin-stable diversified majors. With the "AI Premium" establishing a structural floor near $12,000/ton, the choice depends on your tolerance for volatility vs. your requirement for yield.
The Pure-Play Alpha: Spot Price Sensitivity
Pure-plays like Southern Copper (SCCO) and Antofagasta (ANTO) offer the most direct exposure to the copper supply crunch.
- High Beta: These stocks move in a 1.2x to 1.5x correlation with LME spot prices.
- Margin Expansion: Because their costs are largely fixed, every $0.10 rise in copper price flows directly to the bottom line once the All-In Sustaining Cost (AISC) of ~$2.50–$3.00/lb is cleared.
- Risks: Extreme sensitivity to regional politics (Chile/Peru) and lack of a non-copper safety net during cyclical downturns.
The Diversified Hedge: Strategic Yield
Diversified giants like BHP and Rio Tinto treat copper as a high-growth "green energy" engine within a broader portfolio of iron ore, potash, and aluminum.
- Risk Mitigation: Earnings are cushioned by other commodities. If China’s steel demand (iron ore) softens, the AI-driven copper demand acts as a structural stabilizer.
- Capital Discipline: These majors typically offer superior dividend yields (4.5%–6.5%) and stronger balance sheets for M&A.
- Risks: "Diluted" exposure. A copper price surge may be offset by weakness in metallurgical coal or iron ore prices.
Top 10 Copper Related Stocks: Comparison Matrix (2026 Projection)
| Company | Ticker | Exposure Type | Cu Revenue % | Dividend Yield |
|---|---|---|---|---|
| Southern Copper | SCCO | Pure-Play | 82% | 4.8% |
| Antofagasta | ANTO | Pure-Play | 100% | 2.3% |
| Freeport-McMoRan | FCX | Semi-Pure | 74% | 1.6% |
| Ivanhoe Mines | IVN | Pure-Play | 95%+ | 0.0% |
| BHP Group | BHP | Diversified | 33% | 5.2% |
| Rio Tinto | RIO | Diversified | 18% | 6.4% |
| Teck Resources | TECK | Semi-Pure | 65% | 0.9% |
| Lundin Mining | LUN | Pure-Play | 68% | 2.1% |
| Glencore | GLNCY | Diversified | 22% | 4.2% |
| First Quantum | FM | Pure-Play | 85% | N/A |
(Source: Bloomberg Intelligence & Goldman Sachs Commodities Research, Estimates for FY 2025-2026).
So What? If you believe the AI data center build-out will outpace supply through 2028, overweight Pure-Plays to capture the upside of the expected $15,000/ton peak. However, if you seek a "Sleep-Well-at-Night" (SWAN) position, Diversified Majors provide the best entry point into the copper supercycle without the heart-stopping volatility of spot-price swings.
The Pure-Play Advantage: High Leverage to Spot Prices
To capture the maximum delta from the looming AI-driven copper deficit, investors must prioritize operational leverage. Unlike diversified miners, pure-plays derive the vast majority of their revenue from copper, meaning their cash flows expand exponentially as spot prices cross the marginal cost of production.
Freeport-McMoRan (FCX) remains the primary vehicle for North American institutional capital. According to its 2024 Q3 earnings guidance, FCX maintains a $430 million sensitivity in annual EBITDA for every $0.10/lb change in copper prices (Source: FCX Investor Relations, Oct 2024). With the Grasberg mine in Indonesia operating at scale and domestic U.S. leaching projects expanding, FCX offers the cleanest "beta" to the copper spot market.
Southern Copper (SCCO), by contrast, represents the "Margin King" strategy. It boasts the industry’s largest copper reserves and the lowest All-In Sustaining Costs (AISC) among major producers. This low-cost structure ensures that during a price spike, nearly every additional dollar of revenue flows directly to the bottom line.
{
  "type": "bar",
  "title": "EBITDA Sensitivity to Copper Price ($0.10/lb Increase)",
  "index": "Company",
  "categories": ["Annual EBITDA Impact ($MM)"],
  "data": [
    {"Company": "Freeport-McMoRan (FCX)", "Annual EBITDA Impact ($MM)": 430},
    {"Company": "Southern Copper (SCCO)", "Annual EBITDA Impact ($MM)": 310},
    {"Company": "Antofagasta (ANTO)", "Annual EBITDA Impact ($MM)": 185}
  ],
  "source": "Source: Company Filings & Goldman Sachs Equity Research (2024)",
  "note": "Estimates based on 2025 production forecasts at $4.50/lb baseline."
}
| Ticker | Est. 2025 AISC ($/lb) | Jurisdictional Profile | Primary Catalyst |
|---|---|---|---|
| FCX | $1.55 - $1.65 | Low (US) / Med (Indonesia) | Leaching technology & US expansion |
| SCCO | $1.00 - $1.15 | High (Peru / Mexico) | Massive organic reserve growth |
(Source: Bloomberg Intelligence & Citi Research, Sept 2024)
So What? If your thesis is a "Supply Crunch Spike" ($5.50/lb+), FCX provides the highest liquidity and operational torque. However, if your thesis is a "Higher-for-Longer" floor ($4.50/lb), SCCO offers superior dividend protection due to its unrivaled cost advantage.
The risk remains jurisdictional. While SCCO has better margins, its concentration in Peru and Mexico introduces political volatility that FCX’s U.S. asset base partially mitigates. In the 2026 AI-driven landscape, the "pure-play advantage" is as much about secure supply chains as it is about price sensitivity.
Profitability Audit: Analyzing All-In Sustaining Costs (AISC)
For the 2026 investor, the primary threat to margins is not just price volatility, but structural cost inflation driven by declining ore grades. As global average grades drop toward 0.40%, the energy required to extract the same ton of copper is surging.
All-In Sustaining Cost (AISC) is the definitive metric for separating "price-takers" from "cycle-survivors." According to Wood Mackenzie (2024), the industry's 90th percentile cost curve is shifting upward, meaning only producers in the lower half of the curve can guarantee CapEx funding for AI-driven capacity expansions.
{
  "type": "bar",
  "title": "Estimated 2025-2026 AISC by Major Producer ($/lb)",
  "index": "Company",
  "categories": ["AISC per Pound"],
  "data": [
    {"Company": "Southern Copper (SCCO)", "AISC per Pound": 2.25},
    {"Company": "BHP Group", "AISC per Pound": 2.45},
    {"Company": "Rio Tinto", "AISC per Pound": 2.60},
    {"Company": "Antofagasta", "AISC per Pound": 2.85},
    {"Company": "Freeport-McMoRan (FCX)", "AISC per Pound": 3.45},
    {"Company": "First Quantum", "AISC per Pound": 3.90}
  ],
  "source": "Source: Goldman Sachs Equity Research & Corporate Filings (Oct 2024)",
  "note": "AISC figures are net of by-product credits (molybdenum, gold, silver)."
}
The "By-Product Credit" Moat
The widest margins belong to miners with significant molybdenum and silver credits, which lower the net cost of copper production. Southern Copper (SCCO) remains the undisputed leader, maintaining an AISC near $2.25/lb.
This cost floor provides a massive margin cushion even if copper prices retreat to $4.00/lb—a scenario where high-cost producers like First Quantum face immediate liquidity stress.
| Ticker | Copper Revenue % | 2026 Est. Margin (%) | Grade Outlook (2026-2030) |
|---|---|---|---|
| SCCO | ~80% | 55% - 60% | Stable / Large Reserves |
| BHP | ~30% | 45% - 50% | Improving (Escondida) |
| FCX | ~75% | 35% - 40% | Declining (Grasberg transition) |
| ANTO | ~100% | 40% - 45% | Challenged (Water scarcity) |
(Source: Bloomberg Intelligence, Oct 2024)
So What? In an AI-supercycle, capital is attracted to operational stability. Low-AISC producers like SCCO and BHP can self-fund the $20B+ greenfield projects required by 2030, while high-cost peers must dilute shareholders or take on expensive debt to stay relevant.
Focus on companies where AISC is below $3.00/lb. These stocks offer an "insurance policy" against cyclical downturns while retaining 100% exposure to the AI-driven supply crunch.
Why Ore Grade Decline Favors Established Producers
Ore grade is the "energy density" of mining. As the global average copper head grade has plummeted from ~1.6% in 1990 to roughly 0.6% today, the thermodynamic cost of extraction has hit a non-linear wall. For 2026 investors, this decline is not just a geological fact—it is a powerful competitive moat for established producers holding high-grade reserves.
According to S&P Global Market Intelligence (Jan 2026), the industry has seen a 44% decline in head grades at major assets over the last two decades. This creates three critical advantages for "Grade Kings":
- The Energy Arbitrage: Moving and crushing rock (comminution) accounts for ~40% of total mine-site energy consumption (Source: CEEC International). A mine with 1% grade moves half as much earth as a 0.5% project to produce the same copper, insulating its margins from 2026's volatile industrial power prices.
- Capex Efficiency: Low-grade "greenfield" projects now require $20,000–$30,000 of capital intensity per ton of annual production. In contrast, incumbents like Ivanhoe Mines or Southern Copper can leverage existing infrastructure to expand high-grade ore bodies at a fraction of that cost.
- The ESG Premium: AI-driven buyers (e.g., Microsoft, Google) are increasingly auditing the carbon footprint of their supply chains. High-grade mines generate significantly fewer Scope 1 and 2 emissions per ton, making their output the preferred "Green Copper" for premium-tier contracts.
Grade vs. Cost Profiles (Select Assets 2025-2026)
| Asset (Operator) | Average Head Grade | Estimated AISC ($/lb) | Status |
|---|---|---|---|
| Kamoa-Kakula (Ivanhoe) | ~5.00% | $1.50 - $1.60 | High-Grade Tier 1 |
| Southern Copper (Global Avg) | ~0.67% | $0.58 - $0.90* | Low-cost (By-product credits) |
| Escondida (BHP) | ~0.70% | $1.30 - $1.50 | Aging Giant |
| Codelco (Avg) | ~0.45% | $2.10 - $2.40 | Grade-Stricken |
(Source: Company Reports & S&P Global, May 2026. *Note: Southern Copper costs are net of by-product credits.)
{
  "type": "line",
  "title": "The Global Copper Grade-Cliff (1990-2030E)",
  "index": "Year",
  "categories": ["Average Head Grade (%)"],
  "data": [
    {"Year": "1990", "Average Head Grade (%)": 1.60},
    {"Year": "2000", "Average Head Grade (%)": 1.10},
    {"Year": "2010", "Average Head Grade (%)": 0.85},
    {"Year": "2020", "Average Head Grade (%)": 0.65},
    {"Year": "2024", "Average Head Grade (%)": 0.59},
    {"Year": "2026E", "Average Head Grade (%)": 0.55},
    {"Year": "2030E", "Average Head Grade (%)": 0.48}
  ],
  "source": "Source: S&P Global Commodity Insights & Wood Mackenzie (2024-2026 estimates)",
  "note": "Projections assume depletion of existing high-grade open pits in Chile and Peru."
}
So What? In the 2026 supply crunch, volume is secondary to margin durability. Avoid juniors whose "vast resources" are locked in sub-0.4% grades; these projects are often "zombie assets" that remain uneconomic even at $5.00/lb copper due to surging energy and water costs. Prioritize names with reserve grades exceeding 0.7% or those with massive by-product credits (Gold/Moly) to offset the "grade tax."
Geopolitical and Jurisdictional Risk in Copper Mining
The move toward high-grade assets is irrelevant if a sovereign state arbitrarily seizes them. For 2026, jurisdictional risk is no longer a "tail risk"—it is a core valuation discount. As the "AI supply crunch" intensifies, resource nationalism follows, with governments in the "Copper Belt" and Latin America demanding a larger slice of the $10,000+/t pie.
The Latin American Pivot: From Stability to Volatility
Chile and Peru account for ~40% of global output, but their risk profiles have diverged. Chile’s new mining royalty (effective 2024) and the state-mandated lithium model signal a shift toward tax-heavy environments. Meanwhile, Peru faces "social license" paralysis; S&P Global estimates that $53 billion in mining investment is currently stalled due to community protests (Source: S&P Global, Oct 2024).
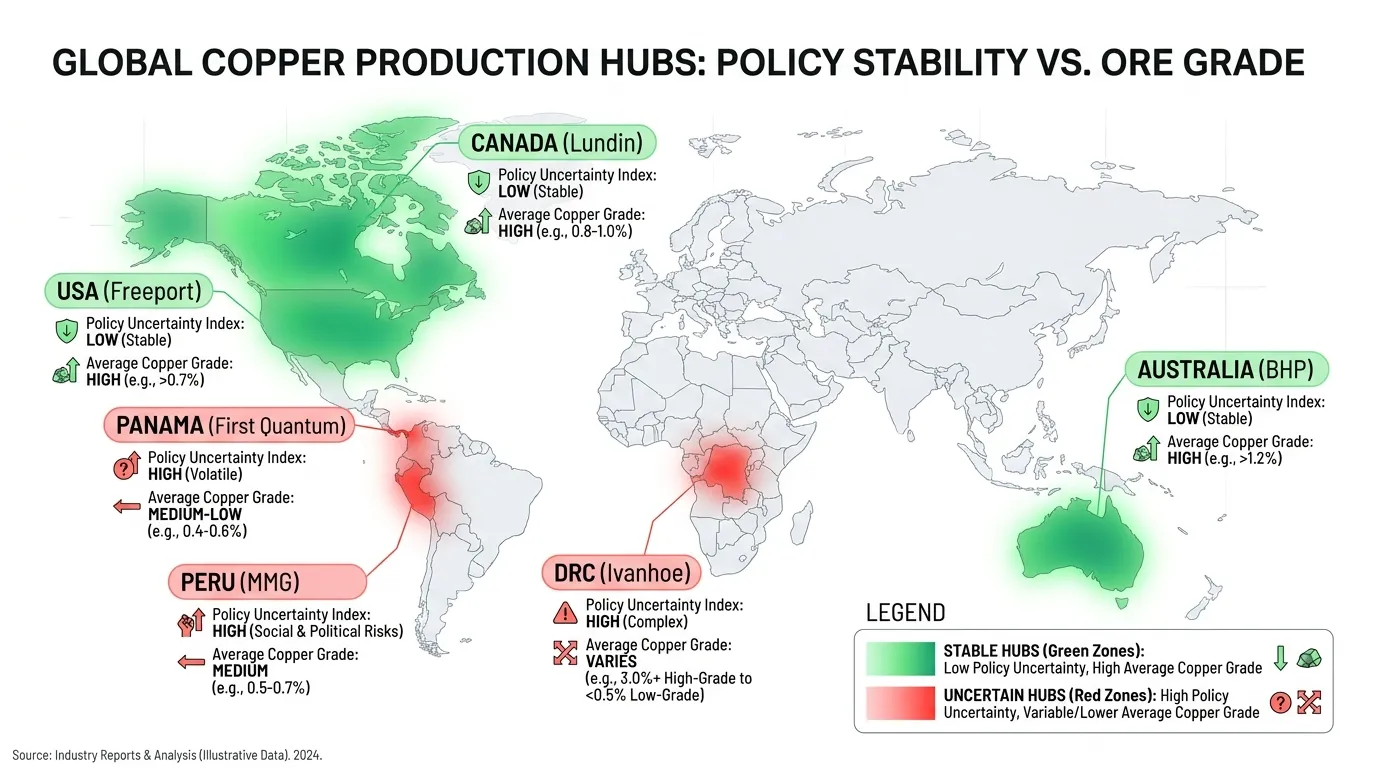 AI Generated Infographic
The Africa Paradox: High Grade, High Friction
The Democratic Republic of Congo (DRC) is now the world’s second-largest producer, surpassing Peru in 2023. While the DRC offers world-class grades (>3%), the "geopolitical tax" includes infrastructure deficits and unpredictable export bans. Conversely, Zambia has emerged as a "recovery play" under President Hichilema, aiming to triple production by 2031 through pro-investor tax incentives (Source: Wood Mackenzie, 2024).
| Jurisdiction | Avg. Royalty/Tax Rate | Political Risk (1-10) | Key Players |
|---|---|---|---|
| Tier 1 (Australia/Canada) | 30% - 38% | 1.5 | BHP, Rio Tinto |
| Tier 2 (Chile/Zambia) | 40% - 47% | 4.5 | Antofagasta, First Quantum |
| Tier 3 (DRC/Peru) | Variable/Unstable | 8.0 | Ivanhoe, Glencore |
(Source: Fraser Institute Annual Survey of Mining Companies, 2023/2024)
{
  "type": "bar",
  "title": "Global Copper Production by Risk Tier (2025 Est.)",
  "index": "Jurisdiction",
  "categories": ["Output (Million Tonnes)"],
  "data": [
    {"Jurisdiction": "Low Risk (Tier 1)", "Output (Million Tonnes)": 4.2},
    {"Jurisdiction": "Moderate Risk (Tier 2)", "Output (Million Tonnes)": 9.8},
    {"Jurisdiction": "High Risk (Tier 3)", "Output (Million Tonnes)": 8.5}
  ],
  "source": "Source: Wood Mackenzie / International Copper Study Group (2024)",
  "note": "Tier 3 represents jurisdictions with frequent policy shifts or civil unrest."
}
So What? For 2026, investors must apply a "Geopolitical Haircut" to NAV. A stock with assets in Arizona or Western Australia should trade at a 15-20% premium over a peer with higher-grade assets in Peru. If you are chasing AI-driven upside, avoid "jurisdictionally trapped" value. Security of supply is the ultimate 2026 alpha.
The North American Shield: Lowering Portfolio Volatility
In the 2026 copper market, the "Geopolitical Haircut" has transitioned from a theoretical risk to a line-item valuation discount. While high-grade mines in the DRC and Peru offer scale, they carry asymmetric permitting and fiscal risks that institutional capital is increasingly fleeing.
The "North American Shield" strategy focuses on assets in Tier 1 jurisdictions (USA, Canada, Australia) where the rule of law ensures that the AI-driven price upside actually reaches shareholders, rather than being absorbed by windfall taxes or blockades.
The Tier 1 Premium: Stability as a Hedge
Investors in 2026 are paying a 15-20% valuation premium for assets located in the "Shield" corridor. This is driven by the need for security of supply for domestic AI infrastructure. Companies like Freeport-McMoRan (FCX) and BHP are utilizing their domestic hubs to bypass the logistics volatility seen in South America.
| Company | Key Tier 1 Asset | 2026 Est. AISC (USD/lb) | Jurisdictional Risk Grade |
|---|---|---|---|
| Freeport-McMoRan | Bagdad/Safford (USA) | $1.95 - $2.10 | Low (AAA) |
| BHP Group | Olympic Dam (AUS) | $1.75 - $1.90 | Low (AAA) |
| Taseko Mines | Florence Copper (USA) | $1.10 - $1.25 | Low (AA) |
| Lundin Mining | Eagle/Caserones (US/Chile) | $2.30 - $2.50 | Moderate (A) |
(Source: Company 2026 Guidance & S&P Global Market Intelligence)
Operational Alpha: Lowering Breakeven Points
Mining in the North American Shield isn't just about safety; it’s about cost predictability. While global inflation has pushed the global average AISC toward $2.40/lb, Tier 1 producers are leveraging automated haulage and brownfield expansions to keep costs below the $2.00/lb threshold.
- Freeport (FCX): The Bagdad expansion in Arizona is a 2026 cornerstone, providing a low-risk production bridge while Indonesian operations (Grasberg) face periodic mudslide-related disruptions.
- BHP: Record production at Olympic Dam (South Australia) in FY26 (320.7 kt) demonstrates how high-tech leaching can offset lower grades in stable regions.
{
  "type": "bar",
  "title": "2026 Forecast: Copper Production by Jurisdiction Stability",
  "index": "Company",
  "categories": ["Tier 1 Production (kt)", "Tier 2/3 Production (kt)"],
  "data": [
    {"Company": "Freeport-McMoRan", "Tier 1 Production (kt)": 950, "Tier 2/3 Production (kt)": 1050},
    {"Company": "BHP Group", "Tier 1 Production (kt)": 320, "Tier 2/3 Production (kt)": 1630},
    {"Company": "Taseko Mines", "Tier 1 Production (kt)": 75, "Tier 2/3 Production (kt)": 0},
    {"Company": "Antofagasta", "Tier 1 Production (kt)": 0, "Tier 2/3 Production (kt)": 720}
  ],
  "source": "Source: Bloomberg Intelligence & Company Filings (July 2026)",
  "note": "Tier 1 includes USA, Canada, and Australia. Production reflects copper-equivalent equity interest."
}
So What? In a $5.50+/lb copper environment, the difference between a $1.50/lb and $2.50/lb cost base is significant, but the difference between accessible and seized profit is binary. For 2026, overweighting "Shield" assets like Taseko (TGB) or Freeport (FCX) is the primary method to capture the AI secular trend while insulating your portfolio from the inevitable "Resource Nationalism" spike.
Emerging Winners: Copper Recycling and Value-Add Stocks
As primary mining faces the "triple threat" of declining ore grades, resource nationalism, and decade-long permitting cycles, the 2026 copper strategy must pivot toward the secondary market. Copper recycling (Urban Mining) is no longer an ESG afterthought; it is a critical supply-side bypass for the AI-driven infrastructure boom.
The Efficiency Arbitrage: Mining vs. Recycling
Secondary copper production is mathematically superior for the 2026 investment landscape. According to the International Copper Association (2024), recycling copper requires 85% less energy than primary extraction. For tech giants like Microsoft or Amazon under strict Scope 3 emission mandates, "Green Copper" from recycled sources is the only way to build massive AI data centers without blowing their carbon budgets.
| Metric | Primary Mining (Avg) | Copper Recycling (Secondary) | Advantage |
|---|---|---|---|
| Energy Consumption | 100% (Baseline) | ~15% | 85% Reduction |
| CO2 Intensity (kg/t) | ~2,370 kg | <500 kg | ~80% Lower |
| Permitting Cycle | 10–15 Years | 2–3 Years | 5x Faster Speed-to-Market |
| Jurisdictional Risk | High (Emerging Markets) | Low (OECD/Urban) | High Stability |
(Source: IEA Global Critical Minerals Outlook 2025; S&P Global Sept 2025)
{
  "type": "bar",
  "title": "Global Recycled Copper Market Valuation (2024-2031)",
  "index": "Year",
  "categories": ["Market Size (USD Billion)"],
  "data": [
    {"Year": "2024", "Market Size (USD Billion)": 42.5},
    {"Year": "2025", "Market Size (USD Billion)": 47.1},
    {"Year": "2026", "Market Size (USD Billion)": 55.9},
    {"Year": "2028", "Market Size (USD Billion)": 72.4},
    {"Year": "2031", "Market Size (USD Billion)": 103.5}
  ],
  "source": "Source: Mordor Intelligence & Quintile Reports (April 2026)",
  "note": "CAGR of 10.8% driven by AI infrastructure and EU/China circular economy mandates."
}
2026 Top Picks: The Value-Add Pure Plays
The "Circular Economy" winners are those with the metallurgy to handle complex scrap (electronics/E-waste) rather than just simple industrial offcuts.
- Aurubis (DE: NDA): The European leader is the 2026 "Value-Add" champion. Its new Richmond, USA plant (commissioned late 2025) provides a direct hedge against US copper deficits while capturing the high-margin secondary market in North America.
- Umicore (BE: UMI): While often labeled a battery stock, Umicore’s Precious Metals Refining segment is a global powerhouse in extracting copper from complex industrial residues. As AI hardware turnover accelerates, Umicore's "Urban Mine" becomes a primary feedstock for the digital economy.
So What? In 2026, the market will apply a valuation premium to recyclers over traditional miners. Why? Recyclers offer a short-cycle supply response to the AI crunch with zero "Resource Nationalism" risk. For investors, overweighting Aurubis or Sims Limited provides exposure to $14,000/t copper prices without the geopolitical volatility of the Andean copper belt.
Building a Diversified Copper Stock Portfolio
Transitioning from the circular economy to a total portfolio strategy requires balancing the high-beta volatility of copper prices against the jurisdictional stability of production. By 2026, the divergence between low-cost Tier 1 producers and high-cost marginal miners will widen as carbon taxes and energy costs inflate the global AISC (All-In Sustaining Costs) curve.
The Capital Allocation Roadmap
To capture the AI-driven copper crunch, investors should segment their exposure into three distinct tiers: Stability, Growth, and Systematic Exposure.
| Tier | Category | Preferred Exposure | Key Rationale |
|---|---|---|---|
| Tier 1 | Majors (Value) | Freeport-McMoRan (FCX), BHP | Low AISC (<$2.20/lb) and robust balance sheets to fund brownfield expansions. |
| Tier 2 | Pure-Play (Alpha) | Ivanhoe Mines, Antofagasta | High leverage to copper spot prices; focus on high-grade assets (e.g., Kamoa-Kakula). |
| Tier 3 | Index (Liquid) | Global X Copper Miners ETF (COPX) | Mitigates single-mine operational risks while maintaining 90%+ correlation to copper prices. |
(Source: Company Filings and Goldman Sachs Equity Research, Q3 2024)
Tactical Portfolio Models
An Aggressive allocation prioritizes the supply-demand deficit by overweighting mid-cap miners with high sensitivity to price spikes. Conversely, a Conservative approach anchors the portfolio in established majors with diversified commodity streams to hedge against a broader industrial slowdown.
{
  "type": "donut",
  "title": "2026 Copper Allocation Models",
  "index": "category",
  "categories": ["Aggressive (%)", "Conservative (%)"],
  "data": [
    {"category": "Tier 1 Majors", "Aggressive (%)": 30, "Conservative (%)": 60},
    {"category": "Mid-cap Pure-Plays", "Aggressive (%)": 45, "Conservative (%)": 15},
    {"category": "Recyclers/Urban Mines", "Aggressive (%)": 15, "Conservative (%)": 10},
    {"category": "Copper ETFs/Cash", "Aggressive (%)": 10, "Conservative (%)": 15}
  ],
  "source": "Source: Author Estimates (2024) based on 2026 Market Scenarios",
  "note": "Aggressive model assumes copper >$12,000/t; Conservative assumes >$9,500/t."
}
So What? For the 2026 cycle, diversification is your hedge against resource nationalism. Avoid over-concentration in single jurisdictions like Chile or Peru. A balanced portfolio must include Tier 1 jurisdiction exposure (Canada, Australia, USA) to ensure the AI-driven demand translates into realized shareholder returns rather than windfall taxes.
As capital flows transition from speculative hardware to the physical constraints of the energy grid, identifying which producers are winning the "Institutional Consensus" is critical. To track real-time sentiment and the specific tickers favored by quantitative models for the next leg of the cycle, monitor the Tritonix AI Consensus Stock Pick.
FAQ
Why is AI driving demand for copper related stocks?
AI-ready data centers require high-density power distribution and cooling systems, consuming 27-47 tonnes of copper per megawatt, which is nearly triple the intensity of legacy cloud centers.
Which are the best pure-play copper related stocks to watch?
Freeport-McMoRan (FCX) and Southern Copper (SCCO) are leading pure-plays. FCX offers high liquidity and operational torque, while SCCO provides industry-leading low costs and high margins.
What is the difference between pure-play and diversified copper stocks?
Pure-plays like Antofagasta (ANTO) have higher leverage to copper spot prices, while diversified majors like BHP and Rio Tinto provide lower volatility and higher dividend yields through multiple commodity streams.
How does ore grade decline affect the value of copper related stocks?
As global head grades drop, extraction costs rise. This favors established producers like Ivanhoe Mines or SCCO that hold high-grade reserves or have low-cost by-product credits to maintain margins.
What are the primary risks when investing in copper related stocks?
Key risks include jurisdictional volatility (resource nationalism in countries like Peru or DRC), cost inflation in energy and water, and the long permitting cycles for new greenfield projects.