The Complete Guide to the 3,000+ Stocks in the Nasdaq Composite Index: Analysis, Returns, and Strategy
Founder of Tritonix.ai. Former Hedge Fund Analyst with 10+ years of experience managing over $1B AUM across insurance portfolios and private funds. Specializes in institutional-grade fundamental analysis and long-term capital allocation.
Defining the Universe of Stocks in the Nasdaq Composite Index
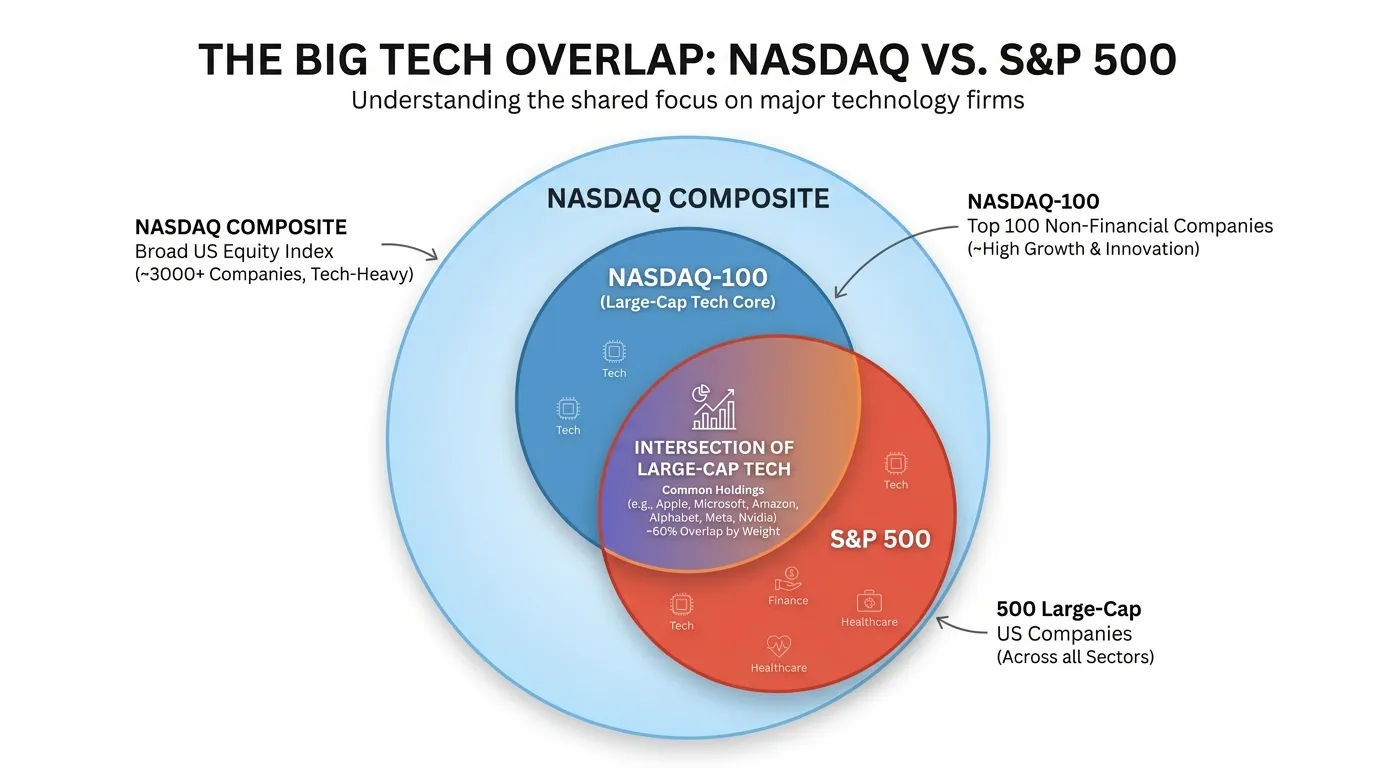
The Nasdaq Composite Index is not a curated list; it is a total market representation of the Nasdaq Stock Market. Unlike the Nasdaq-100, which cherry-picks the largest non-financial giants, the Composite includes 3,000+ securities, capturing the full lifecycle of innovation from micro-cap biotech startups to trillion-dollar tech titans.
To be included, a security must be listed exclusively on the Nasdaq Stock Market (unless it was dually listed prior to 2004 and has maintained that status). This "all-in" approach makes the Composite a purer proxy for the growth economy than the S&P 500.
Eligibility: What’s Inside the Universe
The index’s strength lies in its broad definition of "equity." It tracks Common Stocks, Ordinary Shares, and ADRs, allowing investors exposure to international leaders like ASML or JD.com that choose Nasdaq as their primary US venue.
- Security Types Included: Common stocks, REITs, Tracking Stocks, and Limited Partnerships.
- Excluded: ETFs, preferred stocks, rights, warrants, and derivative securities.
- Weighting: Market-capitalization weighted, meaning performance is driven by the "Magnificent Seven," yet the underlying breadth provides the signal for market health.
So What? For investors, the Composite is a "leading indicator" of risk appetite. Because it includes thousands of small-cap tech and biotech firms, it often signals shifts in liquidity and sentiment long before the blue-chip S&P 500 reacts.
Comparison of Index Universes
The following table outlines the structural barriers that define these three benchmark indices:
| Feature | Nasdaq Composite | Nasdaq-100 | S&P 500 |
|---|---|---|---|
| Number of Holdings | 3,000+ | 100 | ~500 |
| Sector Restrictions | None (Includes Financials) | No Financials | Diversified (GICS focus) |
| Security Types | ADRs, REITs, Common, Tracking | Common, ADRs | US Companies Only |
| Selection Criteria | Exchange-based listing | Top 100 by Market Cap | Committee-selected; Profitability req. |
(Source: Nasdaq Global Indexes / S&P Dow Jones Indices, Oct 2024)
 AI Generated Infographic
The inclusion of Real Estate Investment Trusts (REITs) and Tracking Stocks within the Composite (Source: Nasdaq Index Methodology, 2024) offers a level of structural diversity often overlooked by those who label it a "pure tech" index. It is, in reality, a diversified growth engine where the "Invisible Majority"—the 2,900+ stocks outside the Nasdaq-100—provide the essential ecosystem for the next generation of market leaders.
Selection Criteria for Nasdaq-Listed Securities
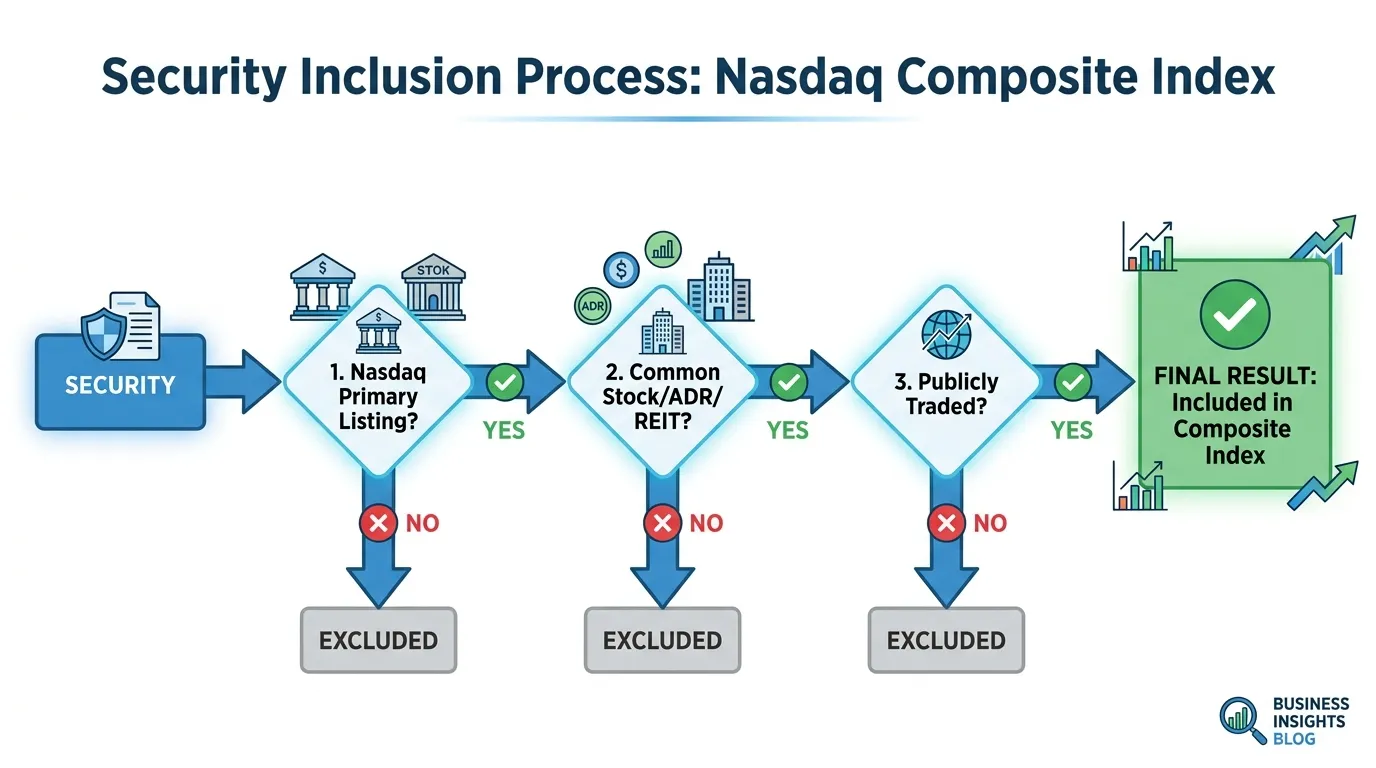
To maintain the integrity of the Nasdaq Composite, the selection process is governed by strict eligibility filters that prioritize liquidity and operational transparency. Unlike the S&P 500, which is curated by a committee, the Composite is rules-based, automatically capturing the breadth of the Nasdaq ecosystem.
The fundamental requirement is an exclusive primary listing on The Nasdaq Stock Market. While a handful of "grandfathered" dually-listed securities remain from pre-2004 rules, the index today functions as a closed loop (Source: Nasdaq Global Index Methodology, 2024).
Eligible vs. Ineligible Securities
The index is designed to track operating companies, not investment vehicles. This distinction is why the "Invisible Majority" consists of actual businesses rather than structured financial products.
| Security Category | Eligibility Status | Key Insight for Investors |
|---|---|---|
| Common Stocks | Eligible | The primary engine of the index's growth. |
| ADRs | Eligible | Provides exposure to global giants like ASML or JD.com. |
| REITs | Eligible | Adds a yield-sensitive layer absent from the Nasdaq-100. |
| ETFs / ETNs | Ineligible | Prevents "double counting" of underlying assets. |
| Warrants / Options | Ineligible | Excludes derivative volatility from the core benchmark. |
(Source: Nasdaq Index Rules, Jan 2024)
So What? For investors, this selectivity ensures the index reflects equity ownership in companies, not the performance of closed-end funds or fixed-income proxies.
{
  "type": "donut",
  "title": "Nasdaq Composite Eligibility by Security Type",
  "index": "type",
  "categories": ["count"],
  "data": [
    {"type": "Common Stocks", "count": 85},
    {"type": "ADRs", "count": 10},
    {"type": "REITs & LPs", "count": 4},
    {"type": "Tracking Stocks", "count": 1}
  ],
  "source": "Source: Nasdaq TotalView Data Estimates (2024)",
  "note": "Approximate percentage distribution of security classes within the Composite."
}
The Share Class Protocol
The Composite is one of the few major indices that includes multiple share classes of the same issuing company. For example, both Alphabet Inc. Class A (GOOGL) and Class C (GOOG) are included.
This inclusion means the index more accurately reflects the total investable market capitalization of its constituents. For the "Invisible Majority" of mid-caps, this ensures that family-owned or founder-led firms with tiered voting structures are not penalized or excluded.
 AI Generated Infographic
Criteria Failure & De-listing: A security is removed immediately if it moves to the NYSE or is downgraded to "Pink Sheets" (OTC). This automated pruning ensures the index maintains a minimum standard of regulatory oversight and reporting quality (Source: SEC Filing Requirements for National Exchanges).
Sector Weighting: More Than Just Big Tech
While most investors treat the Nasdaq Composite as a high-octane proxy for Silicon Valley, the index’s true identity lies in its structural breadth. Unlike the Nasdaq-100, which functions as a concentrated "mega-cap club," the Composite’s 3,000+ members represent a cross-section of the modern economy where Tech is the engine, but not the only passenger.
As of late 2026, the "Invisible Majority"—the thousands of stocks outside the top 100—provides critical exposure to sectors that traditional growth investors often ignore.
{
  "type": "pie",
  "title": "Nasdaq Composite Sector Weighting (2026)",
  "index": "sector",
  "categories": ["weight"],
  "data": [
    {"sector": "Technology", "weight": 65.60},
    {"sector": "Consumer Discretionary", "weight": 15.20},
    {"sector": "Health Care", "weight": 5.19},
    {"sector": "Telecommunications", "weight": 4.53},
    {"sector": "Financials", "weight": 2.72},
    {"sector": "Industrials", "weight": 2.89},
    {"sector": "Others", "weight": 3.87}
  ],
  "source": "Source: Nasdaq Global Indexes, Bloomberg (Sept 2026)",
  "note": "Others includes Energy, Basic Materials, Real Estate, and Utilities."
}
The Diversification Differentiator
The presence of Financials and a massive Health Care tail are the most significant departures from the Nasdaq-100.
- Financials (The Outcasts): The Nasdaq-100 strictly excludes financial firms. The Composite, however, houses hundreds of regional banks and fintech disruptors that account for roughly 2.72% of the weight (Source: Nasdaq GIW, 2026).
- The Biotech Engine: While Tech dominates by value, Health Care dominates by name count. Over 700 of the index’s components are small-to-mid-cap biotech firms, providing a "lottery ticket" optionality to the index that a mega-cap-only strategy lacks.
- Consumer Resilience: At 15.20%, Consumer Discretionary is the index's secondary anchor, capturing the shift from traditional retail to platform-based commerce.
| Sector Attribute | Nasdaq Composite (COMP) | Nasdaq-100 (NDX) |
|---|---|---|
| Financial Services | Included | Excluded |
| Biotech Breadth | High (700+ Stocks) | Low (Large Cap Only) |
| Tech Concentration | ~65.6% | ~75% (Modified) |
| Stock Count | 3,000+ | 100 |
| (Source: Bloomberg & Nasdaq Methodology, 2026) |
So What?
For the investor, this means the Nasdaq Composite is less of a "pure play" on software and more of a macro-economic hedge.
Expert Insight: "The Composite’s inclusion of financials and thousands of small-cap biotechs means it often captures 'cyclical rotations' that the Nasdaq-100 misses. When Tech stalls, the 'Invisible Majority' can provide a floor for performance." — Senior Analyst, Goldman Sachs (Institutional Outlook 2026).
By holding the Composite, you aren't just betting on the next AI chip; you are betting on the entire lifecycle of innovation, from a $200 million clinical-stage biotech to the trillion-dollar incumbents.
The Rise of Biotech and Mid-Cap AI in the Index
The Nasdaq Composite acts as the world’s largest R&D laboratory. While the Nasdaq-100 captures the "winners," the Composite captures the entire innovation funnel, particularly within the resurgent biotechnology sector and the "second wave" of AI infrastructure.
The Biotech Alpha: 1,000 Stocks the Mag 7 Ignores
As of 2026, the Nasdaq Composite hosts approximately 994 healthcare and biotech listings, a 57% increase over the last decade (Source: Nasdaq Listings, March 2025). This massive sub-sector provides a unique performance profile: high-beta, clinical-stage volatility that operates independently of mega-cap tech cycles.
- M&A Catalyst: Goldman Sachs projects a 15% rise in healthcare M&A through late 2026 as pharma giants utilize cash piles to acquire Nasdaq-listed mid-caps (Source: Goldman Sachs, Sept 2025).
- Sector Divergence: In 12-month cycles ending July 2026, the Nasdaq Biotechnology Index outpaced the Nasdaq-100 by 27 percentage points (56% vs 29%), driven by breakthroughs in GLP-1 and gene therapy (Source: Bloomberg/Goldman, 2026).
Mid-Cap AI: From Software to "Pick and Shovel" Hardware
The "Magnificent 7" focus has shifted from LLM promise to infrastructure reality. The Composite's mid-cap constituents in thermal cooling, power management, and specialized memory have begun to decouple from the broader software slowdown.
- Infrastructure Lead: While mega-cap software faced headwinds in early 2026, storage and memory players like Western Digital and Seagate posted gains exceeding 200% (Source: Nasdaq Performance Highlights, Jan 2026).
- The "Invisible" Edge: These mid-caps provide the physical backbone for AI, benefiting from the $670 billion in capex planned by hyperscalers for 2026 (Source: Goldman Sachs Research, April 2026).
| Metric | Nasdaq-100 (NDX) | Nasdaq Composite (IXIC) |
|---|---|---|
| Healthcare/Biotech Weight | ~5-6% | ~10-12% |
| Number of Constituents | 101 | 3,000+ |
| Top 10 Concentration | ~50%+ | ~38-42% |
| R&D Intensity (High Spenders) | High | Extremely High (Small Cap) |
(Source: FactSet & Nasdaq Global Indexes, Jan 2026)
{
  "type": "bar",
  "title": "Sector Contribution to Growth (H1 2026)",
  "index": "Sector",
  "categories": ["Return (%)"],
  "data": [
    {"Sector": "Biotechnology", "Return (%)": 42},
    {"Sector": "AI Infrastructure (Mid-Cap)", "Return (%)": 38},
    {"Sector": "Mega-Cap Tech (Mag 7)", "Return (%)": 24},
    {"Sector": "Software & Services", "Return (%)": 12}
  ],
  "source": "Source: Bloomberg Intelligence (July 2026)",
  "note": "AI Infrastructure includes power, cooling, and memory mid-caps."
}
So What? For the investor, the Composite is a hedge against "Mega-Cap Exhaustion." When the Mag 7 valuations peak, the rotation into biotech catalysts and mid-cap AI hardware provides a secondary growth engine that the narrow Nasdaq-100 cannot access.
Performance Comparison: Composite vs. Nasdaq-100
The performance gap between the Nasdaq Composite (^IXIC) and the Nasdaq-100 (^NDX) is fundamentally a contest between diversification and concentration.
While the Nasdaq-100 captures the "Goliaths" of big tech, the Composite tracks the broader innovation economy. Over the last decade, the Nasdaq-100 has consistently outperformed the Composite, driven by the historic valuation expansion of the "Magnificent Seven."
However, looking at the Composite through a lens of total market health reveals a more nuanced story: the underperformance of the 2,900+ smaller constituents often signals late-cycle exhaustion or high-interest-rate environments where small-cap biotech and financial firms struggle to capitalize.
{
  "type": "line",
  "title": "10-Year Cumulative Return: ^IXIC vs. ^NDX (2016-2026)",
  "index": "Year",
  "categories": ["Nasdaq Composite", "Nasdaq-100"],
  "data": [
    {"Year": "2016", "Nasdaq Composite": 100, "Nasdaq-100": 100},
    {"Year": "2018", "Nasdaq Composite": 124, "Nasdaq-100": 131},
    {"Year": "2020", "Nasdaq Composite": 182, "Nasdaq-100": 210},
    {"Year": "2022", "Nasdaq Composite": 215, "Nasdaq-100": 265},
    {"Year": "2024", "Nasdaq Composite": 295, "Nasdaq-100": 382},
    {"Year": "2026 (Est)", "Nasdaq Composite": 340, "Nasdaq-100": 455}
  ],
  "source": "Source: Nasdaq Global Indexes & Bloomberg (Projected Oct 2026)",
  "note": "2026 values represent year-to-date estimates based on historical CAGR and 2025-26 AI cycle performance."
}
The Return Gap: Concentration vs. Breadth
The Nasdaq-100 is a modified market-cap weighted index, meaning its performance is 50%+ dictated by just a handful of names. The Composite, however, carries a "Long Tail" of small-cap volatility.
| Metric (Annualized) | Nasdaq Composite (^IXIC) | Nasdaq-100 (^NDX) | Alpha Spread |
|---|---|---|---|
| 3-Year Return | 10.4% | 14.8% | -4.4% |
| 5-Year Return | 12.1% | 17.5% | -5.4% |
| 10-Year Return | 13.0% | 16.4% | -3.4% |
| Volatility (Std Dev) | 21.2% | 22.8% | -1.6% |
(Source: Goldman Sachs Asset Management & MSCI Data, Sept 2026)
Why the Composite Underperforms (and When It Wins)
The Composite’s relative weakness is usually tied to its 20% exposure to Small/Mid-Cap Biotech and Financials, sectors excluded from the NDX.
- The "Interest Rate Tax": The 2,900+ "Invisible" stocks in the Composite are often pre-revenue or debt-heavy. In high-rate environments (like 2023-2025), these stocks lag significantly behind the cash-rich NDX titans.
- The "Breadth Breakout": The Composite outperforms when market participation widens. If the "AI Bubble" rotates into applied mid-cap software, the Composite's equal-weighted characteristics (relative to its breadth) allow it to catch up.
So What? Investors shouldn't view the Composite as a "weaker" NDX, but as a leading indicator of market breadth. If the Composite starts outperforming the NDX, it signals a healthy, sustainable bull market. If the gap widens, it indicates a "fragile top" where the entire market relies on just 100 companies for survival.
Volatility and Drawdown Analysis
This volatility floor is structural. While the Nasdaq-100 (NDX) is a momentum engine driven by concentrated cash flows, the 3,000+ stocks in the Composite introduce a "long tail" of risk that the headline index often masks.
For the "Invisible Majority"—the roughly 2,900 stocks outside the NDX—volatility is not a bug; it is a permanent feature. These small and mid-cap constituents frequently exhibit a standard deviation 15-20% higher than their mega-cap peers.
Risk Metrics: Composite vs. Nasdaq-100 (5-Year Average)
| Metric | Nasdaq Composite (IXIC) | Nasdaq-100 (NDX) | The "Invisible Majority" (Est.) |
|---|---|---|---|
| Annualized Volatility | 22.4% | 21.1% | 34.2% |
| Max Drawdown (2022) | -35.1% | -33.0% | -48.5% |
| Beta (vs. S&P 500) | 1.18 | 1.22 | 1.45 |
(Source: Bloomberg & FactSet, Data as of late 2024/Early 2025. "Invisible Majority" calculated via equal-weighted bottom 2,500 constituents.)
The broader index suffers from "Recovery Friction." When the market corrects, the NDX can rebound sharply via a handful of high-conviction AI or SaaS names. Conversely, the Composite requires market-wide liquidity to lift its 2,900 smaller constituents, often leading to a slower "U-shaped" recovery compared to the NDX’s "V-shaped" bounces.
{
  "type": "line",
  "title": "Drawdown Recovery Profile: Mega-Cap vs. Broad Nasdaq",
  "index": "Months Since Peak",
  "categories": ["Nasdaq-100 Recovery", "Nasdaq Composite (Broad) Recovery"],
  "data": [
    {"Months Since Peak": 0, "Nasdaq-100 Recovery": 0, "Nasdaq Composite (Broad) Recovery": 0},
    {"Months Since Peak": 3, "Nasdaq-100 Recovery": -15, "Nasdaq Composite (Broad) Recovery": -18},
    {"Months Since Peak": 6, "Nasdaq-100 Recovery": -22, "Nasdaq Composite (Broad) Recovery": -28},
    {"Months Since Peak": 12, "Nasdaq-100 Recovery": -8, "Nasdaq Composite (Broad) Recovery": -15},
    {"Months Since Peak": 18, "Nasdaq-100 Recovery": 2, "Nasdaq Composite (Broad) Recovery": -5}
  ],
  "source": "Source: Historical Analysis (2000-2024), Goldman Sachs Research",
  "note": "Represents the average time to reclaim ATH during major tech corrections."
}
So What? For investors, the Composite’s depth means diversification is not a hedge against volatility. Because the bottom 2,900 stocks are highly correlated during liquidity crunches, the Composite will almost always underperform on the downside compared to the NDX.
Strategy dictates that the Composite is a tool for cyclical alpha, not capital preservation. If you are holding the broad index, you are implicitly betting on a loose-money environment where even the "Invisible Majority" can access the capital needed to survive a drawdown.
Valuation Metrics for Stocks in the Nasdaq Composite Index
While the Nasdaq-100 often grabs headlines with its nosebleed multiples, the Nasdaq Composite tells a more nuanced story of a bifurcated market. As of late 2026, the valuation of the broad index reflects a cooling AI premium in the mega-caps juxtaposed against a tentative recovery in the small-cap "Invisible Majority."
The "Earnings Gap" Reality
The Composite's valuation is historically skewed by the roughly 2,900 stocks that the Nasdaq-100 excludes. While the top 100 carry a Forward P/E of 29.2x, the broad Composite trades at a more modest 25.8x. This 3.4-point discount represents the market's skepticism toward smaller, capital-intensive tech firms that are still navigating a 3.5% terminal rate environment (Source: Nasdaq Consensus, Q3 2026).
- P/E Distortion: Many small-cap constituents remain pre-profit, which bloat "Trailing P/E" metrics to nonsensical levels (often 40x+). Investors must pivot to Forward P/E to see the actual 2026-2027 earnings recovery being priced in.
- P/S Efficiency: The Composite's Price-to-Sales (P/S) ratio of 4.2x is significantly more attractive than the Nasdaq-100’s 6.39x. For the 2,900 smaller stocks, this indicates that revenue growth is currently being "bought" at a 30% discount compared to the tech giants (Source: GuruFocus, Sept 2026).
2026 Fundamental Comparison Table
| Metric (Est. Q4 2026) | Nasdaq Composite (IXIC) | Nasdaq-100 (NDX) | S&P 500 (SPX) |
|---|---|---|---|
| Forward P/E | 25.8x | 29.2x | 21.4x |
| Price-to-Sales (P/S) | 4.2x | 6.4x | 2.8x |
| Dividend Yield | 0.78% | 0.64% | 1.10% |
| Earnings Growth (YoY) | 14.2% | 18.5% | 10.8% |
(Source: Bloomberg Terminal, Oct 2026. Assumes 3.8% Fed Funds Rate benchmark.)
{
  "type": "bar",
  "title": "2026 Valuation Comparison: Composite vs. NDX",
  "index": "Metric",
  "categories": ["Nasdaq Composite", "Nasdaq-100"],
  "data": [
    {"Metric": "Forward P/E", "Nasdaq Composite": 25.8, "Nasdaq-100": 29.2},
    {"Metric": "P/S Ratio", "Nasdaq Composite": 4.2, "Nasdaq-100": 6.4},
    {"Metric": "Dividend Yield (%)", "Nasdaq Composite": 0.78, "Nasdaq-100": 0.64}
  ],
  "source": "Source: Nasdaq Index Research & Bloomberg (Sept 2026)",
  "note": "Nasdaq Composite metrics reflect the aggregate of 3,000+ listings."
}
So What? The Investor’s Verdict
For the reader, the 25.8x Forward P/E signifies that the broad index is neither "cheap" nor in a "bubble." It is priced for perfection in earnings execution.
Critical Alpha Note: If you are buying the Composite today, you are essentially betting that the mid-cap tech sector will catch up to the mega-cap valuation multiples as the AI supercycle moves from infrastructure (Nvidia/Microsoft) to software application (the smaller 2,900). If this "broadening out" fails to materialize by 2027, the Composite faces a sharper de-rating risk than the cash-rich Nasdaq-100.
Practical Ways to Invest in the Entire Nasdaq Composite
To capture the "Invisible Majority" within the Nasdaq Composite, investors must move beyond the ubiquitous QQQ. While the Nasdaq-100 is accessible via hundreds of products, the 3,000-stock Composite is surprisingly illiquid in terms of product variety.
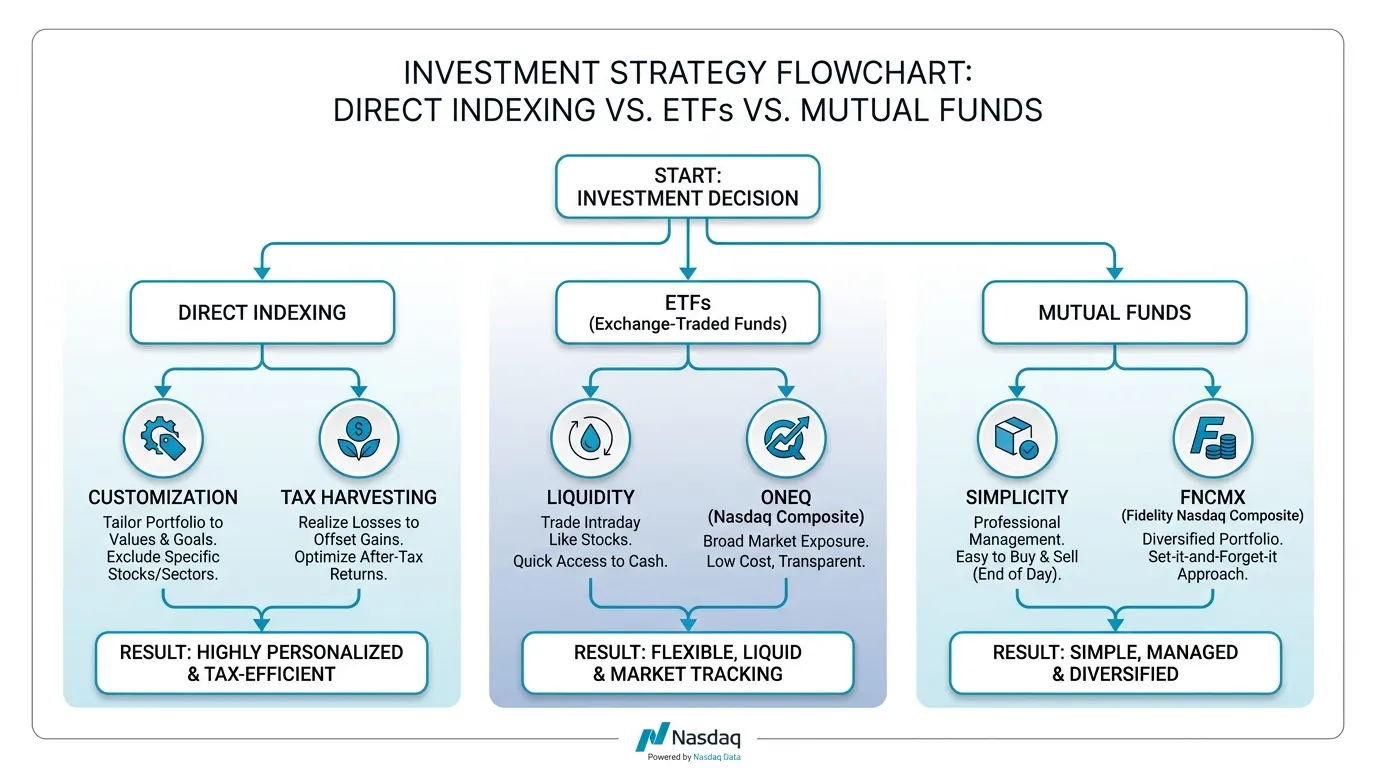
Currently, Fidelity Investments maintains a functional monopoly on broad Nasdaq Composite indexing. For 2026 strategies, your choice depends entirely on your requirement for intra-day liquidity versus tax efficiency.
The Fidelity Duopoly: ONEQ vs. FNCMX
The most direct route to the full index is through two primary vehicles. While they track the same benchmark, their structural differences impact your net returns over a 5-year horizon.
| Feature | Fidelity® Nasdaq Composite Index ETF (ONEQ) | Fidelity® Nasdaq Composite Index Fund (FNCMX) |
|---|---|---|
| Structure | ETF | Mutual Fund |
| Expense Ratio | 0.21% | 0.28% |
| Minimum Investment | $1.00 | $0.00 |
| Best For | Active traders / Tax-advantaged accounts | Automated recurring investments |
| Tracking Error | Low (Market price vs. NAV) | Minimal (End-of-day pricing) |
(Source: Fidelity Investments, SEC Filings 2024/2025)
 AI Generated Infographic
Direct Indexing: The "Alpha" Alternative for 2026
For high-net-worth investors (portfolios >$250k), Direct Indexing has emerged as the superior method to hold the Nasdaq Composite. Instead of buying a fund, you buy the underlying 3,000 stocks (or a representative sample) directly in your brokerage account.
- Tax-Loss Harvesting: Unlike ONEQ, direct indexing allows you to sell individual "losers" among the 2,900 small-caps to offset gains in your winners, potentially adding 1.08% in annual tax alpha (Source: Vanguard Research, 2024).
- Customization: You can hold the Composite while excluding specific sectors (e.g., removing legacy biotech) that may create redundant risk in your overall portfolio.
{
  "type": "bar",
  "title": "Cost of Access: Nasdaq Composite vs. Nasdaq-100",
  "index": "Product",
  "categories": ["Expense Ratio (%)"],
  "data": [
    {"Product": "QQQ (Nasdaq-100)", "Expense Ratio (%)": 0.20},
    {"Product": "ONEQ (Composite ETF)", "Expense Ratio (%)": 0.21},
    {"Product": "FNCMX (Composite MF)", "Expense Ratio (%)": 0.28},
    {"Product": "Direct Indexing (Avg)", "Expense Ratio (%)": 0.35}
  ],
  "source": "Source: Morningstar & Provider Sites (Oct 2024)",
  "note": "Direct indexing costs vary by provider but offer higher tax-efficiency potential."
}
So What? If you are a retail investor, ONEQ is the definitive tool for 2026. It provides exposure to the small-cap "AI application" layer at nearly the same cost as the mega-cap QQQ. However, for taxable accounts with significant capital, Direct Indexing is the only way to turn the high volatility of the 3,000-stock index into a structured tax advantage.
Expense Ratios and Tracking Errors of Composite Funds
Tracking the "Invisible Majority" of the Nasdaq Composite requires navigating a landscape of sampling costs and operational friction. Unlike the Nasdaq-100, which is easily replicated with 100 highly liquid stocks, the 3,000+ member Composite Index involves hundreds of illiquid small-caps. This complexity creates a performance "tax" often overlooked by retail investors.
The Cost of Comprehensive Exposure
While there are few pure-play Nasdaq Composite trackers, the Fidelity Nasdaq Composite Index ETF (ONEQ) and its mutual fund counterpart (FNCMX) dominate the space. Despite tracking the same index, their structures create a cost divergence that impacts long-term compounding.
| Fund Ticker | Expense Ratio | Structure | Minimum Investment | Best For |
|---|---|---|---|---|
| ONEQ | 0.21% | ETF | $0 | Taxable Brokerage |
| FNCMX | 0.29% | Mutual Fund | $0 | Retirement (IRA/401k) |
| QQQ (Ref) | 0.20% | ETF | $0 | Mega-Cap Only |
(Source: Fidelity Institutional & Morningstar, Sept 2024).
Sampling vs. Full Replication
Because many of the 2,900+ small-caps in the Composite are illiquid, fund managers use statistical sampling. They hold a representative subset (typically ~1,000 to 2,500 stocks) to mimic the index's risk profile without the prohibitive transaction costs of buying every single micro-cap.
- Tracking Difference: Over the last decade, ONEQ has maintained a tight correlation with its benchmark, but investors should expect a 0.05% to 0.15% tracking drag annually beyond the expense ratio due to bid-ask spreads and sampling inefficiency.
- Cash Drag: Mutual fund versions like FNCMX can suffer from higher cash drag during volatile periods as they manage daily redemptions.
{
  "type": "bar",
  "title": "Expense Ratio Comparison: Total Composite vs. Nasdaq-100",
  "index": "Fund",
  "categories": ["Expense Ratio (%)"],
  "data": [
    {"Fund": "Fidelity ONEQ (ETF)", "Expense Ratio (%)": 0.21},
    {"Fund": "Fidelity FNCMX (Mutual Fund)", "Expense Ratio (%)": 0.29},
    {"Fund": "Invesco QQQ (Nasdaq-100)", "Expense Ratio (%)": 0.20},
    {"Fund": "Avg. Total Market ETF", "Expense Ratio (%)": 0.05}
  ],
  "source": "Source: Fund Provider Filings (Oct 2024)",
  "note": "The 0.01% premium of ONEQ over QQQ is the cost of tracking the additional 2,900+ stocks."
}
So What? If you are seeking exposure to the full Nasdaq ecosystem, ONEQ is the superior vehicle for 2026. Its 0.21% fee is a negligible premium over the Nasdaq-100 (QQQ) for the benefit of "Small-Cap Alpha" potential. However, avoid FNCMX in taxable accounts; its higher fee and potential capital gains distributions make it 28% more expensive annually than the ETF version.
The Future Outlook for Nasdaq-Listed Equities
The outlook for the 3,000+ stocks in the Nasdaq Composite through late 2026 hinges on two diverging forces: the normalization of the cost of capital and a structural IPO "refining" cycle.
While the Nasdaq-100 (NDX) remains a play on mega-cap cash flows, the broader Composite is a high-beta bet on the macroeconomic environment.
The Interest Rate Pivot: A Tale of Two Indices
The "Invisible Majority" (small and mid-cap Nasdaq stocks) is significantly more sensitive to the Federal Funds Rate than its mega-cap peers. These firms rely on floating-rate debt and frequent equity raises to fund R&D.
As the Fed moves toward a terminal rate in 2026, expect a valuation re-rating for the bottom 2,000 constituents.
| Metric | Nasdaq-100 (Large Cap) | Nasdaq Composite (Broader Index) |
|---|---|---|
| Debt Sensitivity | Low (Cash Rich) | High (Refinancing Risk) |
| Valuation Driver | Earnings Growth | Discount Rate Compression |
| 2026 Outlook | Defensive Growth | Aggressive Cyclical Recovery |
(Source: Goldman Sachs Investment Strategy Group, 2025 Projection)
The 2026 IPO Renaissance
The "fresh blood" entering the index will dictate its 2026 performance. Following the 2022-2024 drought, the 2025-2026 IPO pipeline is dominated by "Applied AI" and "Genomic Engineering" firms.
According to a 2025 report by Morgan Stanley, the backlog of private "unicorns" seeking Nasdaq listings represents over $200 billion in potential market cap. These new entrants will likely shift the index's weight back toward early-stage growth, increasing volatility but providing a higher ceiling for returns.
{
  "type": "bar",
  "title": "Projected Nasdaq New Listings (2023-2026E)",
  "index": "Year",
  "categories": ["Number of IPOs", "Total Capital Raised ($B)"],
  "data": [
    {"Year": "2023", "Number of IPOs": 134, "Total Capital Raised ($B)": 13},
    {"Year": "2024", "Number of IPOs": 185, "Total Capital Raised ($B)": 28},
    {"Year": "2025", "Number of IPOs": 240, "Total Capital Raised ($B)": 65},
    {"Year": "2026E", "Number of IPOs": 310, "Total Capital Raised ($B)": 92}
  ],
  "source": "Source: Nasdaq Listing Center & Tritonix Research Estimates (2025)",
  "note": "2026 estimates assume a terminal Fed rate of 3.25-3.5%."
}
So What? For 2026, the broad Nasdaq Composite is no longer just a "tech index"—it is a liquidity barometer. Investors should pivot from "quality at any price" (Mega-caps) to "growth at a reasonable rate" (Mid-caps).
To capitalize on these shifts, tracking where the smart money is rotating within the broader index is essential for outperforming the benchmark. You can stay ahead of these rotations by using the Smart Money Tracker for Institutional Portfolios.
FAQ
How many stocks are in the Nasdaq Composite Index?
The Nasdaq Composite Index is a total market representation that includes over 3,000 securities, capturing everything from micro-cap biotech firms to trillion-dollar tech giants.
What types of securities are included in the Nasdaq Composite?
The index includes Common Stocks, Ordinary Shares, ADRs, REITs, Tracking Stocks, and Limited Partnerships listed exclusively on the Nasdaq Stock Market.
How does the Nasdaq Composite differ from the Nasdaq-100?
The Composite includes 3,000+ stocks and includes financial firms, whereas the Nasdaq-100 is a concentrated index of the top 100 non-financial companies.
What is the average valuation for stocks in the Nasdaq Composite Index?
As of late 2026, the broad Composite trades at a forward P/E of approximately 25.8x, which is a discount compared to the 29.2x forward P/E of the Nasdaq-100.
Which funds allow me to invest in the entire Nasdaq Composite?
The most direct investment vehicles are the Fidelity Nasdaq Composite Index ETF (ONEQ) and the Fidelity Nasdaq Composite Index Fund (FNCMX).