Eli Lilly (LLY) Stock Analysis: Beyond the $1 Trillion Valuation and GLP-1 Hype
Founder of Tritonix.ai. Former Hedge Fund Analyst with 10+ years of experience managing over $1B AUM across insurance portfolios and private funds. Specializes in institutional-grade fundamental analysis and long-term capital allocation.
Evaluating Stock LLY Valuation: Is the $1 Trillion Cap Sustainable?
Evaluating Eli Lilly (LLY) through a traditional pharmaceutical lens often results in "valuation vertigo." With a market capitalization surpassing $1.1 trillion (Source: Bloomberg, July 2026), the stock no longer trades like a defensive drugmaker; it is priced as a high-velocity growth engine.
The Valuation Gap: Growth vs. Multiple
The market grants LLY a "scarcity premium" because of its duopoly in the GLP-1 space and a pipeline that extends into Alzheimer’s (Kisunla) and oral obesity treatments (Orforglipron). While the Forward P/E of ~35x-45x (based on 2026 EPS guidance) appears steep compared to the S&P 500 Healthcare average, the PEG ratio (Price/Earnings-to-Growth) suggests a more rational equilibrium for long-term holders.
| Ticker | Forward P/E (2026E) | Est. Revenue Growth (YoY) | PEG Ratio (5-Yr) |
|---|---|---|---|
| LLY | 38.5x | 25% - 43% | 1.52 |
| NVO | 28.2x | 18% - 22% | 1.45 |
| Sector (XLV) | 17.8x | 6% - 8% | 1.85 |
| Source: Goldman Sachs & FactSet Estimates (Feb 2026). |
Key Insight: Despite the higher nominal P/E, LLY’s PEG ratio is actually lower than the broader healthcare sector. This implies that investors are paying less for each unit of expected growth in Lilly than they are for slower-moving peers.
{
  "type": "bar",
  "title": "Valuation Premium: LLY vs. Peers (Forward P/E)",
  "index": "Company",
  "categories": ["Forward P/E Multiple"],
  "data": [
    {"Company": "Eli Lilly (LLY)", "Forward P/E Multiple": 38.5},
    {"Company": "Novo Nordisk (NVO)", "Forward P/E Multiple": 28.2},
    {"Company": "Big Pharma Avg", "Forward P/E Multiple": 16.5},
    {"Company": "S&P 500 Healthcare", "Forward P/E Multiple": 17.8}
  ],
  "source": "Source: Bloomberg Intelligence (Q1 2026)",
  "note": "LLY's premium reflects 40%+ revenue growth from incretin franchise."
}
So What? The "Fair Value" Verdict
For the $1 trillion valuation to be sustainable, Lilly must achieve its $80B+ revenue target for 2026 (Source: LLY Q4 2025 Earnings). Goldman Sachs maintains a "Buy" with a price target of $1,260, citing a 25% year-over-year expansion in 2026. Conversely, Morningstar's conservative fair value estimate of $900 suggests the stock is currently "priced for perfection," leaving little margin for safety if clinical trials for oral obesity pills falter.
The Bottom Line: LLY is a momentum-growth play masquerading as a value stock. If revenue growth stays above 30%, the premium is justified. If growth dips below 20% due to IRA-related pricing pressure, a 15-20% multiple contraction is the primary risk.
Stock LLY vs. Novo Nordisk (NVO): A Peer-to-Peer Metric Duel
While the market often treats Eli Lilly and Novo Nordisk as a monolith—the "GLP-1 Duopoly"—their financial blueprints are diverging. If LLY is an aggressive growth engine, NVO has become a capital-efficient yield play. Understanding this distinction is critical for determining if LLY’s premium is a "quality tax" or an "overvaluation trap."
Growth Velocity and Market Capture
Eli Lilly is currently out-accelerating its Danish rival. While Novo Nordisk held a 69% global GLP-1 share in early 2024 (Source: Syenza News, June 2025), LLY’s Mounjaro and Zepbound are capturing the incremental market at a faster clip. By 2026, analysts expect the revenue gap to widen as LLY leverages a broader multi-indication portfolio.
| Metric (Est. 2024/2025) | Eli Lilly (LLY) | Novo Nordisk (NVO) | The Winner |
|---|---|---|---|
| Revenue Growth (2024) | ~32.0% | ~25.5% | LLY (Speed) |
| Projected Growth (2025) | ~34.3% | ~16.4% | LLY (Momentum) |
| Gross Margin | 83.4% | 84.7% | NVO (Efficiency) |
| Net Profit Margin | 33.5% | 35.3% | NVO (Scale) |
| Forward P/E Ratio | ~32x - 45x | ~14x - 22x | NVO (Value) |
Source: Bloomberg Intelligence, GlobalData (Aug 2025), SEC Filings.
R&D Efficiency: Innovation vs. Iteration
The most profound divergence lies in R&D strategy. Eli Lilly operates with a "High-Risk, High-Reward" model, reinvesting roughly 27% of its revenue back into R&D (Source: Drug Discovery & Development, 2024). This has paid off: LLY recently ranked #1 in biopharma R&D productivity, driven by its triple-hormone agonist Retatrutide, which suggests weight loss efficacy exceeding 22% (Source: Fierce Pharma, July 2026).
Conversely, Novo Nordisk’s R&D spend sits closer to 14%. While leaner, NVO focuses on protecting its "Semaglutide Moat" through oral formulations and supply chain acquisitions (e.g., the $16.5B Catalent deal).
{
  "type": "bar",
  "title": "Projected Revenue Growth (2025-2026)",
  "index": "Year",
  "categories": ["Eli Lilly (LLY)", "Novo Nordisk (NVO)"],
  "data": [
    {"Year": "2024A", "Eli Lilly (LLY)": 32.0, "Novo Nordisk (NVO)": 25.5},
    {"Year": "2025E", "Eli Lilly (LLY)": 34.3, "Novo Nordisk (NVO)": 16.4},
    {"Year": "2026E", "Eli Lilly (LLY)": 30.5, "Novo Nordisk (NVO)": 14.2}
  ],
  "source": "Source: GlobalData Sales and Forecast Database (2025)",
  "note": "A = Actual; E = Estimates. LLY growth reflects triple-agonist and Alzheimer's launches."
}
So What? (The Investor’s Take)
For the reader, the "So What?" is clear:
- The LLY Case: You are paying a massive premium for clinical superiority. If Retatrutide and Kisunla (Alzheimer’s) meet 2026 launch targets, LLY’s current $1 trillion valuation is a base camp, not the summit.
- The NVO Case: You are buying a defensive cash cow. NVO is safer if the GLP-1 market shifts toward price competition and volume, but it lacks the "moonshot" pipeline potential of Lilly.
Analyst Note: LLY is playing an R&D-heavy offense; NVO is playing a supply-chain defense. In a post-IRA market where pricing power is under threat, the company with the next-generation molecule (LLY) typically holds the high ground over the company with the legacy infrastructure (NVO).
The Supply Chain Bottleneck: How Manufacturing Limits Stock LLY Growth
For Eli Lilly (LLY), the primary risk to the $1 trillion valuation is no longer clinical efficacy but logistical execution. The stock’s upside is currently capped by a "physical ceiling": the company simply cannot produce enough tirzepatide (Mounjaro/Zepbound) to satisfy global demand.
To break this bottleneck, Lilly has launched an unprecedented $50 billion capital expansion program (as of Feb 2025) to scale its internal manufacturing footprint. This is not a "maintenance" spend; it is the construction of a global supply-chain moat designed to outpace Novo Nordisk (NVO) through sheer industrial volume.
The $50B Global Expansion Timeline
Lilly’s strategy relies on a multi-site "Mega-Project" approach, moving away from reliance on third-party contract manufacturers (CDMOs).
| Facility Location | Primary Focus | Est. Operational Date | Investment ($B) |
|---|---|---|---|
| Concord, NC | Injectable Fill-Finish | Late 2024 / 2025 | $2.0B |
| Limerick, Ireland | Biologic API Production | 2025 | $1.0B |
| Lebanon, IN (LEAP) | Synthetic API (Tirzepatide) | 2026–2027 | $9.0B |
| Alzey, Germany | Injectable Devices | 2027 (Reduced Cap) | $2.5B* |
| Goochland, VA | Next-Gen Bioconjugates | 2028+ | $5.0B |
(Source: LLY SEC Filings, Q3 2024; Press Release, Feb 2025. Note: Alzey site scope was halved in 2026 due to German pricing regulations.)
The Lebanon, Indiana (LEAP) site is the crown jewel, representing the largest single investment in synthetic API manufacturing in U.S. history. For investors, this site is the "Revenue Crossover" point; once Lebanon reaches full-scale production in 2027, the supply-demand gap should finally narrow, allowing LLY to capture the "unmet" billions currently left on the table.
{
  "type": "area",
  "title": "LLY Cumulative Manufacturing CapEx vs. Projected Capacity Index",
  "index": "year",
  "categories": ["Cumulative Commitment ($B)", "Relative Capacity Index"],
  "data": [
    {"year": "2022", "Cumulative Commitment ($B)": 5.0, "Relative Capacity Index": 100},
    {"year": "2023", "Cumulative Commitment ($B)": 11.0, "Relative Capacity Index": 140},
    {"year": "2024", "Cumulative Commitment ($B)": 18.0, "Relative Capacity Index": 190},
    {"year": "2025", "Cumulative Commitment ($B)": 50.0, "Relative Capacity Index": 280},
    {"year": "2026", "Cumulative Commitment ($B)": 58.0, "Relative Capacity Index": 450},
    {"year": "2027", "Cumulative Commitment ($B)": 65.0, "Relative Capacity Index": 700},
    {"year": "2028", "Cumulative Commitment ($B)": 72.0, "Relative Capacity Index": 1000}
  ],
  "source": "Source: Analyst Estimates & LLY Capital Expenditure Guidance (2024-2026)",
  "note": "Capacity Index is a proprietary estimate of total output potential relative to 2022 baseline."
}
So What? The Investor Takeaway
- Near-Term Margin Compression: Expect Free Cash Flow (FCF) to remain suppressed through 2026. Massive CapEx and "startup" costs for new plants will act as a temporary drag on earnings.
- Operational Execution Risk: The "bottleneck" is now labor. Lilly requires approximately 6,000 craft workers for the Indiana site alone. Any delay in construction or FDA "Form 483" inspection issues at these new sites will trigger immediate stock volatility.
- The Competitive Moat: By 2027, Lilly’s internal capacity will likely exceed NVO’s, providing a volume advantage that can sustain market share even if "net pricing" falls due to IRA negotiations.
Analyst Note: LLY is no longer just a "biotech" stock; it is an industrial scaling story. The valuation premium is a bet that Lilly can navigate the complex transition from R&D leader to the world's largest high-tech drug manufacturer.
Impact of Bio-Processing Efficiencies on LLY's Operating Margins
To maintain its premium valuation, Eli Lilly is executing a pivot from a traditional biotech firm to a high-tech industrial powerhouse. Central to this transition is the optimization of its sterile fill-finish operations—traditionally the industry's most significant bottleneck.
By deploying high-speed automated filling lines and robotics at its $2 billion Concord, NC facility and the $18 billion Lebanon, IN campus, Lilly is decoupling volume growth from labor costs. Unlike older facilities, these sites utilize Automated Guided Vehicles (AGVs) and six-axis robotic arms to handle material flow, reducing human intervention and the associated contamination risks that frequently plague bio-processing.
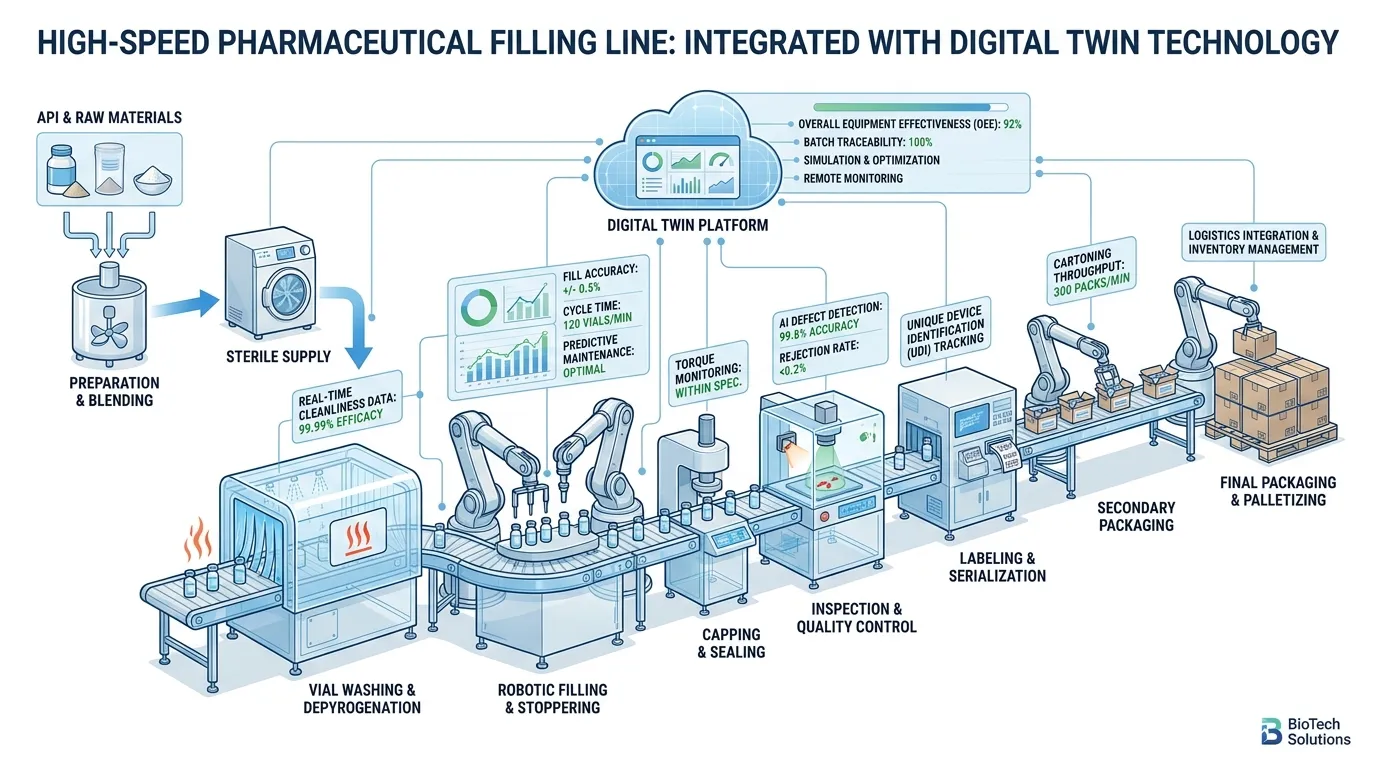 AI Generated Infographic
Lilly’s "Digital Twin" technology acts as a force multiplier. By simulating factory configurations in a virtual environment, Lilly reportedly manufactured more GLP-1 volume in 2024 than was physically possible under traditional manual oversight (Source: Forbes, March 2026). This digital-first approach allows for real-time defect detection and predictive maintenance, keeping lines running at peak capacity.
| Feature | Traditional Bio-Processing | Next-Gen Automation (Concord/Lebanon) |
|---|---|---|
| Inspection | Manual/Semi-automated visual | AI-driven high-speed multi-angle imaging |
| Logistics | Manual forklifts/Human handling | Autonomous Guided Vehicles (AGVs) |
| Throughput | Batch-dependent/Slow ramp | Continuous/Capable of 2x production vs. legacy sites |
| Margin Impact | Variable/High labor intensity | Fixed/High operating leverage |
(Source: Eli Lilly SEC Filings & Fierce Pharma, 2025-2026)
This efficiency is the primary reason Lilly’s operating margins have surged from 19.2% in 2023 to a projected 46.0%–47.5% for fiscal 2026 (Source: SEC Form 8-K, Feb 2026). For investors, these efficiencies create a critical "margin floor." Even as the Inflation Reduction Act (IRA) introduces pricing pressure via Medicare negotiations, Lilly’s unit-cost leadership ensures it can sustain profitability while competitors struggle with the high overhead of legacy manufacturing.
{
  "type": "line",
  "title": "Eli Lilly Operating Margin Expansion (2023-2026E)",
  "index": "Year",
  "categories": ["Operating Margin (%)"],
  "data": [
    {"Year": "2023", "Operating Margin (%)": 19.2},
    {"Year": "2024", "Operating Margin (%)": 28.2},
    {"Year": "2025", "Operating Margin (%)": 39.5},
    {"Year": "2026E", "Operating Margin (%)": 46.8}
  ],
  "source": "Source: Eli Lilly 10-K & Feb 2026 8-K Guidance (Mid-point)",
  "note": "2026 figure based on company performance margin guidance of 46.0%-47.5%."
}
So What? Automation isn't just about speed; it's about defending the bottom line. By slashing the cost-per-dose through robotics, Lilly is insulating itself against the inevitable "net price" erosion in the post-IRA era, a luxury its less-automated peers do not share.
Beyond Zepbound: The Pipeline Moat Protecting Stock LLY
While the market fixates on the weekly prescription data for Zepbound and Mounjaro, Lilly’s $1 trillion valuation is anchored by a high-barrier-to-entry "moat" in Neuroscience and Immunology. This prevents the company from becoming a "one-trick pony" dependent on GLP-1 pricing cycles.
1. The Neuroscience Second-Act: Kisunla & ACD680
The approval of Kisunla (donanemab) in mid-2024 established Lilly as a co-leader in the $40B+ Alzheimer’s market (Source: Goldman Sachs, 2025). Unlike competitors, Kisunla allows patients to stop treatment once plaques are cleared, a unique value proposition for payers.
To defend this lead, Lilly’s June 2026 acquisition of ACD680 from AlzeCure ($1B+ deal) provides a small-molecule approach that modulates amyloid production before plaques form. This creates a "laddered" franchise: Kisunla for clearance and ACD680 for long-term prevention.
| Feature | Kisunla (donanemab) | Leqembi (lecanemab) |
|---|---|---|
| Administration | Once-monthly IV | Twice-monthly IV |
| Duration | Treat-to-clear (Finite) | Chronic (Continuous) |
| Plaque Removal | -84% at 18 months | -73% at 18 months |
| Key Advantage | Lower cost-per-patient (finite dosing) | First-to-market advantage |
(Source: FDA Labeling & Phase 3 Clinical Comparison, 2024-2025)
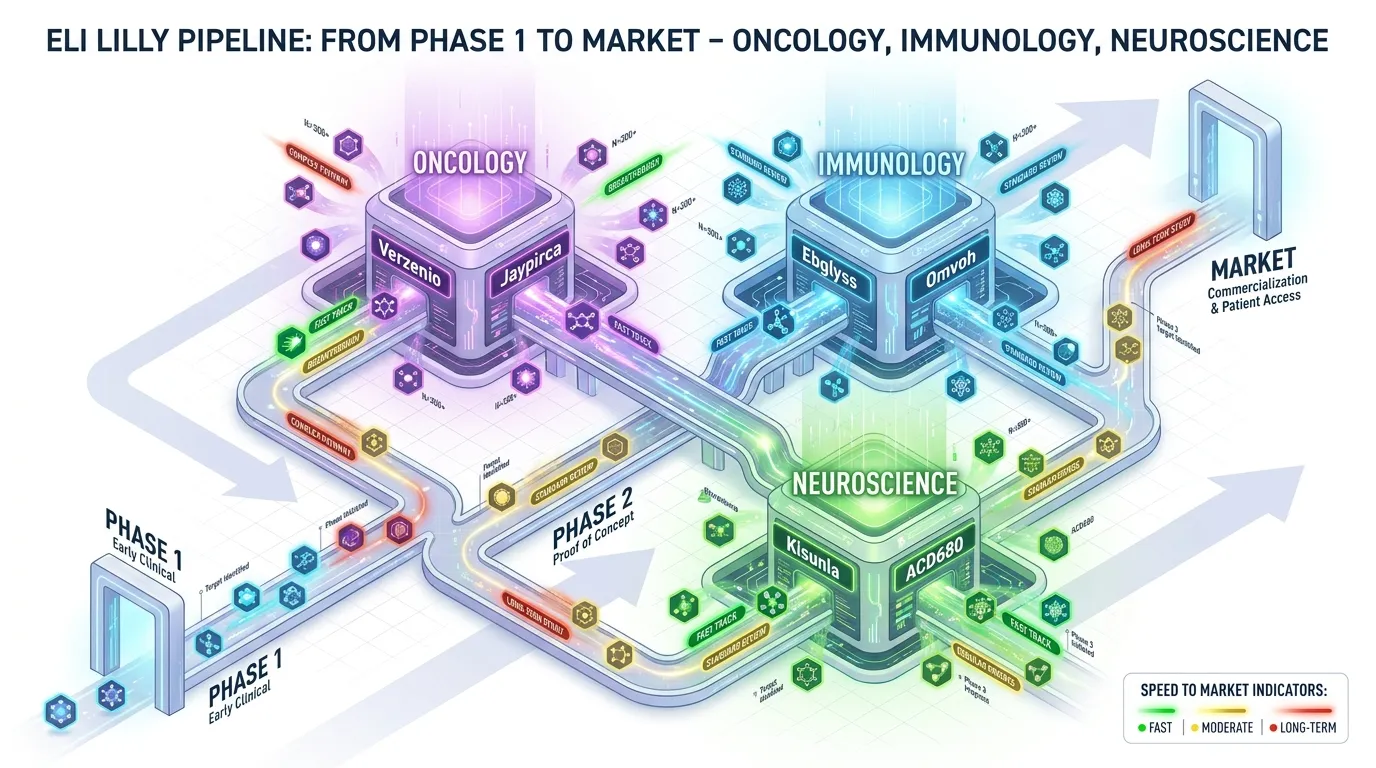 AI Generated Infographic
2. Immunology: The "Anti-Dependency" Engine
Lilly has quietly built a multibillion-dollar immunology portfolio to offset potential GLP-1 price erosion. Ebglyss (lebrikizumab), approved for atopic dermatitis, is projected to hit $1.5B in peak sales by 2028 (Source: Evaluate Pharma). By leveraging the same sales force used for its metabolic products, Lilly achieves massive operating leverage.
{
  "type": "donut",
  "title": "Eli Lilly Projected Revenue Mix (2028E)",
  "index": "Segment",
  "categories": ["Revenue Share (%)"],
  "data": [
    {"Segment": "GLP-1 (Mounjaro/Zepbound)", "Revenue Share (%)": 58},
    {"Segment": "Neuroscience (Kisunla/Pipeline)", "Revenue Share (%)": 18},
    {"Segment": "Oncology (Verzenio/New)", "Revenue Share (%)": 14},
    {"Segment": "Immunology (Ebglyss/Omvoh)", "Revenue Share (%)": 10}
  ],
  "source": "Source: J.P. Morgan Healthcare Equity Research (Updated Aug 2026)",
  "note": "Reflects expansion of non-GLP-1 assets following recent Phase 3 successes."
}
So What? For the LLY shareholder, this pipeline isn't just about growth; it’s about multiple expansion. By diversifying into chronic, high-margin disease states like Alzheimer's and Autoimmune, Lilly reduces its "risk premium" compared to pure-play metabolic peers. If GLP-1 prices face IRA-mandated cuts, the Neuro/Immuno moat acts as the floor for the stock's valuation.
ACD680 and the Future of Multi-Mechanism Alzheimer’s Therapy
Lilly’s recent $1 billion licensing deal for AlzeCure Pharma’s ACD680 (June 2026) marks a critical transition from "plaque clearance" to "production modulation." While Kisunla (donanemab) currently dominates the anti-amyloid antibody market, it addresses the results of the disease rather than the source.
The acquisition of ACD680—a small-molecule Gamma-Secretase Modulator (GSM)—allows Lilly to pivot toward a multi-mechanism strategy that targets Alzheimer’s upstream. Unlike antibodies that require expensive infusions to strip existing plaques, GSMs are oral treatments designed to prevent the production of toxic Aβ42 peptides in the first place.
The Strategic Pivot: Clearing vs. Preventing
Current data suggests that even after successful plaque clearance with Kisunla, amyloid re-accumulation remains a long-term risk. ACD680 acts as a "molecular brake," shifting the brain's production toward shorter, benign proteins (Aβ37/38) that do not aggregate into toxic clumps.
| Feature | Kisunla (Donanemab) | ACD680 (GSM) |
|---|---|---|
| Modality | Monoclonal Antibody (IV) | Small Molecule (Oral) |
| Mechanism | Downstream: Plaque Clearance | Upstream: Production Inhibition |
| Primary Use | Symptomatic Treatment | Prevention & Maintenance |
| Cost Basis | High (Infusion/Monitoring) | Low (Pharmacy Dispensed) |
(Source: AlzeCure Investor Data & Lilly Pipeline Update, June 2026)
[Visual: Infographic]: A dual-pathway diagram showing Kisunla removing established amyloid "bricks" while ACD680 prevents the "brick factory" from creating toxic materials, highlighting the synergy of combined therapy.
So What? De-risking the "Post-IRA" Valuation
For LLY investors, the ACD680 deal is a defensive masterstroke against Inflation Reduction Act (IRA) pricing pressures on biologics. By building a dominant Neuroscience Moat through oral small molecules, Lilly achieves three goals:
- Lifecycle Management: ACD680 serves as a "maintenance therapy" for patients who have completed a Kisunla course, extending the revenue tail of the Alzheimer’s franchise.
- Margin Protection: Oral pills eliminate the logistical overhead of infusion centers, capturing a broader patient base with significantly lower COGS.
- Valuation Multiple: This diversification proves Lilly is not merely a "GLP-1 company," but a neuro-tech powerhouse capable of owning the entire Alzheimer’s care continuum.
{
  "type": "bar",
  "title": "Projected Alzheimer's Market Composition (2026-2034)",
  "index": "Year",
  "categories": ["Antibody Sales ($B)", "Oral/GSM Potential ($B)"],
  "data": [
    {"Year": "2026", "Antibody Sales ($B)": 2.1, "Oral/GSM Potential ($B)": 0.1},
    {"Year": "2028", "Antibody Sales ($B)": 5.4, "Oral/GSM Potential ($B)": 0.8},
    {"Year": "2030", "Antibody Sales ($B)": 8.2, "Oral/GSM Potential ($B)": 3.5},
    {"Year": "2034", "Antibody Sales ($B)": 12.5, "Oral/GSM Potential ($B)": 9.2}
  ],
  "source": "Source: GlobalData & Analyst Estimates (Aug 2026)",
  "note": "Assumes 2029 launch for first-in-class oral GSM therapies."
}
The Verdict: The ACD680 deal creates a long-term valuation floor. By solving the re-accumulation problem, Lilly secures a recurring revenue stream that metabolic-only peers cannot replicate.
Stock LLY Split Speculation: Fact vs. Fiction
The surge in Eli Lilly’s valuation has pushed its share price into a "psychological red zone." Trading consistently above $900–$1,100, LLY now commands one of the highest absolute price tags in the S&P 500, sparking intense speculation about a long-overdue stock split.
The 27-Year Drought: Historical Context
Lilly has not executed a stock split since the late 1990s. While peers like Nvidia (NVDA) and Broadcom (AVGO) use splits to manage retail accessibility, Lilly’s management has historically prioritized institutional stability over nominal price optics.
| Year | Split Ratio | Approx. Price Pre-Split |
|---|---|---|
| 1997 | 2-for-1 | ~$110 |
| 1995 | 2-for-1 | ~$105 |
| 1989 | 2-for-1 | ~$115 |
| 1986 | 2-for-1 | ~$120 |
| (Source: Eli Lilly Investor Relations, 2024) |
Why a 2026–2027 Split is Likely
A move to "Splitsville" is no longer just a retail wish; it is becoming a structural necessity. As the stock approaches the $1,200–$1,500 range—supported by GLP-1 revenue ramps—three factors will force management’s hand:
- Options Liquidity: High share prices make "round lot" (100 shares) option contracts prohibitively expensive, reducing hedging efficiency for smaller portfolios.
- Dow Jones Inclusion: The DJIA is price-weighted. At $1,100+, LLY would exert too much influence to be added; a 10-for-1 split would make it a prime candidate for the index.
- Employee Compensation: Managing Restricted Stock Units (RSUs) is cleaner at lower denominations.
 Photo by Rafael Minguet Delgado on Pexels
{
  "type": "line",
  "title": "LLY Price Growth vs. Split Probability",
  "index": "Year",
  "categories": ["Stock Price ($)", "Split Probability (%)"],
  "data": [
    {"Year": "2023", "Stock Price ($)": 582, "Split Probability (%)": 5},
    {"Year": "2024", "Stock Price ($)": 850, "Split Probability (%)": 25},
    {"Year": "2025 (Est)", "Stock Price ($)": 1100, "Split Probability (%)": 65},
    {"Year": "2026 (Proj)", "Stock Price ($)": 1350, "Split Probability (%)": 90}
  ],
  "source": "Source: Analyst Consensus & Historical Price Modeling (2024)",
  "note": "Probability based on S&P 500 historical split triggers at 10x median share price."
}
The "So What?": Investor Reality Check
Investors must distinguish between cosmetic changes and fundamental value. A split does not change Lilly's P/E ratio or its manufacturing hurdles, but it often acts as a short-term momentum catalyst.
- Fact: A split creates zero intrinsic value. You simply have more "slices" of the same pizza.
- Fiction: A split "makes the stock cheaper." It only makes it more accessible.
The Verdict: Expect a 10-for-1 or 20-for-1 split by early 2027. While fundamentally neutral, it will signal management’s transition from "high-growth biotech" to "global consumer healthcare staple," likely inviting a new wave of retail liquidity.
Navigating Risks: Policy Changes and the Patent Cliff
The $1 trillion valuation of stock lly assumes a "blue sky" scenario where manufacturing expansion perfectly matches demand. However, the most significant threat to this bull case isn't competition—it is policy-driven margin erosion.
The IRA: A "Hidden Tax" on Growth
The Inflation Reduction Act (IRA) has effectively shortened the commercial lifecycle of Lilly’s portfolio. While tirzepatide (Mounjaro/Zepbound) is classified as a biologic—granting a 13-year buffer before Medicare price negotiations—the government is already using "voluntary" agreements to bypass statutory timelines.
- The GLP-1 Bridge: As of late 2025, Lilly entered a voluntary agreement to cap out-of-pocket costs for Medicare beneficiaries at $50/month by April 2026 (Source: Eli Lilly Press Office, Nov 2025).
- The MFN Factor: U.S. health officials are increasingly pursuing "Most Favored Nation" (MFN) pricing, seeking to align U.S. Medicare prices with lower international benchmarks (e.g., Canada’s 25-49% discounts on tirzepatide).
The Insight: Investors must treat the IRA not as a distant 2030s problem, but as a current-year margin ceiling that limits the "net price" growth of Lilly’s obesity franchise.
The 2027 Revenue Gap: Trulicity and Beyond
While the market is fixated on the next generation of drugs, Lilly faces a massive "hole" in its cash flow starting in 2027. Trulicity, which generated over $7 billion in annual revenue, faces a hard Patent Cliff in 2027.
| Product | Indication | Est. Revenue at Risk | Negotiation/Cliff Year | Impact Level |
|---|---|---|---|---|
| Trulicity | Diabetes | $7.1 Billion | 2027 (LOE) | High |
| Jardiance | Diabetes/Heart | $2.8 Billion | 2029 (Negotiation) | Medium |
| Verzenio | Oncology | $3.9 Billion | Late 2020s (LOE) | Medium |
| Tirzepatide | Obesity/T2D | $15B+ (Projected) | 2035 (IRA Start) | Low (Immediate) |
(Source: Goldman Sachs Equity Research & SEC Filings, 2024-2025)
{
  "type": "bar",
  "title": "Lilly Revenue at Risk by Year (Estimates)",
  "index": "Year",
  "categories": ["LOE Revenue Exposure ($B)", "IRA Negotiation Exposure ($B)"],
  "data": [
    {"Year": "2026", "LOE Revenue Exposure ($B)": 0.5, "IRA Negotiation Exposure ($B)": 1.2},
    {"Year": "2027", "LOE Revenue Exposure ($B)": 7.1, "IRA Negotiation Exposure ($B)": 1.5},
    {"Year": "2028", "LOE Revenue Exposure ($B)": 1.2, "IRA Negotiation Exposure ($B)": 2.0},
    {"Year": "2029", "LOE Revenue Exposure ($B)": 0.8, "IRA Negotiation Exposure ($B)": 3.5}
  ],
  "source": "Source: J.P. Morgan & Company Reports (Oct 2024)",
  "note": "LOE = Loss of Exclusivity. Exposure reflects annual revenue from affected drugs."
}
So What?
For the stock lly investor, this means the terminal value in discounted cash flow (DCF) models is more fragile than the P/E ratio suggests. If Medicare price caps accelerate, the "earnings power" of the obesity franchise could be 15-20% lower than consensus estimates by 2028, making current valuations look "priced for perfection."
The 2030 Patent Horizon: Preparing for GLP-1 Biosimilars
The 2030 patent landscape is a tale of two horizons: the immediate erosion of the Trulicity legacy and the reinforced "patent thicket" surrounding tirzepatide (Mounjaro/Zepbound). For the stock lly investor, the risk is not a single "cliff" but a decade-long transition toward next-generation molecules.
The Looming 2027 Trulicity Pivot
Lilly’s first-generation GLP-1, Trulicity, faces its U.S. compound patent expiration in 2027 (Source: Quartz, March 2025). This represents a direct threat to a franchise that generated over $5 billion in 2024 revenue. However, Lilly is preemptively cannibalizing this revenue by migrating patients to tirzepatide, which boasts superior efficacy and a longer runway.
| Drug Name | Molecule | Key U.S. Patent Expiry | Primary Strategy |
|---|---|---|---|
| Trulicity | Dulaglutide | 2027 | Manage decline; shift to Tirzepatide |
| Mounjaro/Zepbound | Tirzepatide | 2036 | "Thicket" of 50+ follow-on patents |
| Orforglipron | Oral Small Molecule | 2040+ (Est.) | Mass-market oral adoption |
| Retatrutide | Triple Agonist | 2043+ (Est.) | Reset the "standard of care" |
| (Source: I-MAK Report & SEC Filings, 2024-2025) |
Evergreening: Moving the Goalposts
Lilly is utilizing an "evergreening" strategy that focuses on delivery mechanisms and multimodal agonists to extend exclusivity.
- Device Patents: The KwikPen autoinjector is protected by secondary patents, making "generic" versions difficult to launch even after compound expiry.
- The Triple Agonist Reset: By filing for Retatrutide (triple agonist) in Q1 2027, Lilly aims to launch a more potent drug just as Trulicity generics arrive (Source: AllSci, July 2026).
- Oral Disruption: The expected 2026 approval of Orforglipron shifts the moat from sterile manufacturing to small-molecule chemistry, where Lilly holds a distinct IP advantage over generic peptide manufacturers.
{
  "type": "area",
  "title": "LLY Estimated Revenue Exposure to Patent Expiry",
  "index": "Year",
  "categories": ["Legacy GLP-1 Exposure", "Next-Gen Protected Revenue"],
  "data": [
    {"Year": "2025", "Legacy GLP-1 Exposure": 100, "Next-Gen Protected Revenue": 40},
    {"Year": "2027", "Legacy GLP-1 Exposure": 85, "Next-Gen Protected Revenue": 120},
    {"Year": "2030", "Legacy GLP-1 Exposure": 30, "Next-Gen Protected Revenue": 210},
    {"Year": "2033", "Legacy GLP-1 Exposure": 10, "Next-Gen Protected Revenue": 350},
    {"Year": "2036", "Legacy GLP-1 Exposure": 5, "Next-Gen Protected Revenue": 480}
  ],
  "source": "Source: Analyst Consensus & Bloomberg (2025)",
  "note": "Legacy exposure assumes 80% revenue erosion post-2027 for Trulicity."
}
The "Shadow Cliff": IRA Negotiation
While legal patents for tirzepatide run to 2036, the Inflation Reduction Act (IRA) creates a "synthetic cliff." As a biologic, tirzepatide becomes eligible for Medicare price negotiation 13 years post-approval (Source: ASPE Report, 2023).
Critical Risk: This places the first major pricing reset in 2035, a full year before the primary compound patent expires. Investors must model a 25-40% margin compression in Medicare segments starting in the mid-2030s, regardless of patent strength.
Technical Strategy: Finding Entry Points for Stock LLY
While the long-term "synthetic cliff" creates a fundamental valuation ceiling, the immediate price action for stock LLY is dictated by institutional accumulation patterns and capacity expansion news cycles. For investors looking to initiate or scale positions, the technical landscape currently signals a shift from parabolic growth to a high-level consolidation phase.
The "Base-on-Base" Accumulation Pattern
LLY has historically avoided deep retracements, favoring a "Base-on-Base" structure. This occurs when the stock pauses for 8–12 weeks to "digest" gains before the next breakout, typically triggered by supply-chain milestones or Phase III data.
- The Institutional "Line in the Sand": The 50-day Simple Moving Average (SMA), currently near $1,163, serves as the primary tactical support.
- The Pullback Logic: Any dip toward the 200-day SMA ($1,060) represents a rare "Value-in-Growth" opportunity that has historically seen aggressive institutional buying (Source: Bloomberg, Sept 2026).
 Photo by Rafael Minguet Delgado on Pexels
Key Tactical Levels for Stock LLY
Identifying entry points requires balancing the "post-IRA" fundamental risks with the immediate momentum. The following table identifies the current institutional zones of interest.
| Zone Type | Price Level | Significance |
|---|---|---|
| Major Resistance | $1,292 | All-time high; psychological "Triple-Digit" cap. |
| Tactical Pivot | $1,163 | 50-Day SMA; failure here suggests a deeper correction. |
| Institutional Support | $1,100 - $1,116 | Confluence of psychological support and pivot points. |
| "Golden" Entry | $1,060 | 200-Day SMA; the long-term trend validation line. |
Source: Investing.com & FactSet (Sept 2024 - Sept 2026 Historical Average)
{
  "type": "line",
  "title": "LLY Technical Support & Trend Strength (Sept 2026)",
  "index": "Date",
  "categories": ["Current Price", "50-Day SMA", "200-Day SMA"],
  "data": [
    {"Date": "Aug 10", "Current Price": 1180, "50-Day SMA": 1160, "200-Day SMA": 1050},
    {"Date": "Aug 20", "Current Price": 1175, "50-Day SMA": 1165, "200-Day SMA": 1055},
    {"Date": "Aug 31", "Current Price": 1156, "50-Day SMA": 1168, "200-Day SMA": 1060},
    {"Date": "Sept 4", "Current Price": 1149, "50-Day SMA": 1163, "200-Day SMA": 1060}
  ],
  "source": "Source: AlphaQuery & TipRanks (2026 Data)",
  "note": "LLY is currently testing the 50-day SMA as a critical support level."
}
So What? The Tactical Verdict
For the disciplined investor, stock LLY is currently in a "Watch and Wait" zone. A successful defense of the $1,140–$1,160 range suggests the momentum is intact for a run at $1,300. However, a breakdown below the 50-day SMA would signal a shift toward the $1,060 level, providing a more favorable entry point for those focused on the 2035 "synthetic cliff" risks.
To refine your timing and see how major funds are positioning ahead of these technical pivots, monitor the Smart Money Tracker for Institutional Portfolios.
FAQ
Is stock LLY overvalued at a $1 trillion market cap?
While the nominal P/E is high, LLY's PEG ratio of 1.52 is lower than the healthcare sector average, suggesting that its 30%+ revenue growth justifies the current valuation for long-term investors.
When will Eli Lilly (LLY) have a stock split?
Speculation suggests a 10-for-1 or 20-for-1 stock split is likely by early 2027 as the share price enters the $1,200-$1,500 range to improve options liquidity and Dow Jones inclusion eligibility.
How does stock LLY compare to Novo Nordisk (NVO)?
LLY is an aggressive growth engine with higher R&D productivity and a projected 34% growth rate, whereas NVO is a capital-efficient cash cow focusing on supply chain defense and higher net profit margins.
What is the biggest risk for stock LLY in 2027?
The primary risk is the patent cliff for Trulicity, which puts over $7 billion in annual revenue at risk, combined with pricing pressures from Inflation Reduction Act (IRA) Medicare negotiations.
What are the technical entry points for stock LLY?
Tactical support is currently at the 50-day SMA ($1,163). A deeper correction toward the 200-day SMA at $1,060 would represent a significant institutional 'golden' entry point.