The Ultimate Guide to Semiconductor Funds 2027: Investing in Chips, ETFs, and Government Incentives
Specializes in alternative data and valuation models. Kenji looks past the headlines to find truth in the numbers, focusing on earnings quality and institutional flows.
Understanding the Semiconductor Funds Landscape: Investment vs. Grants
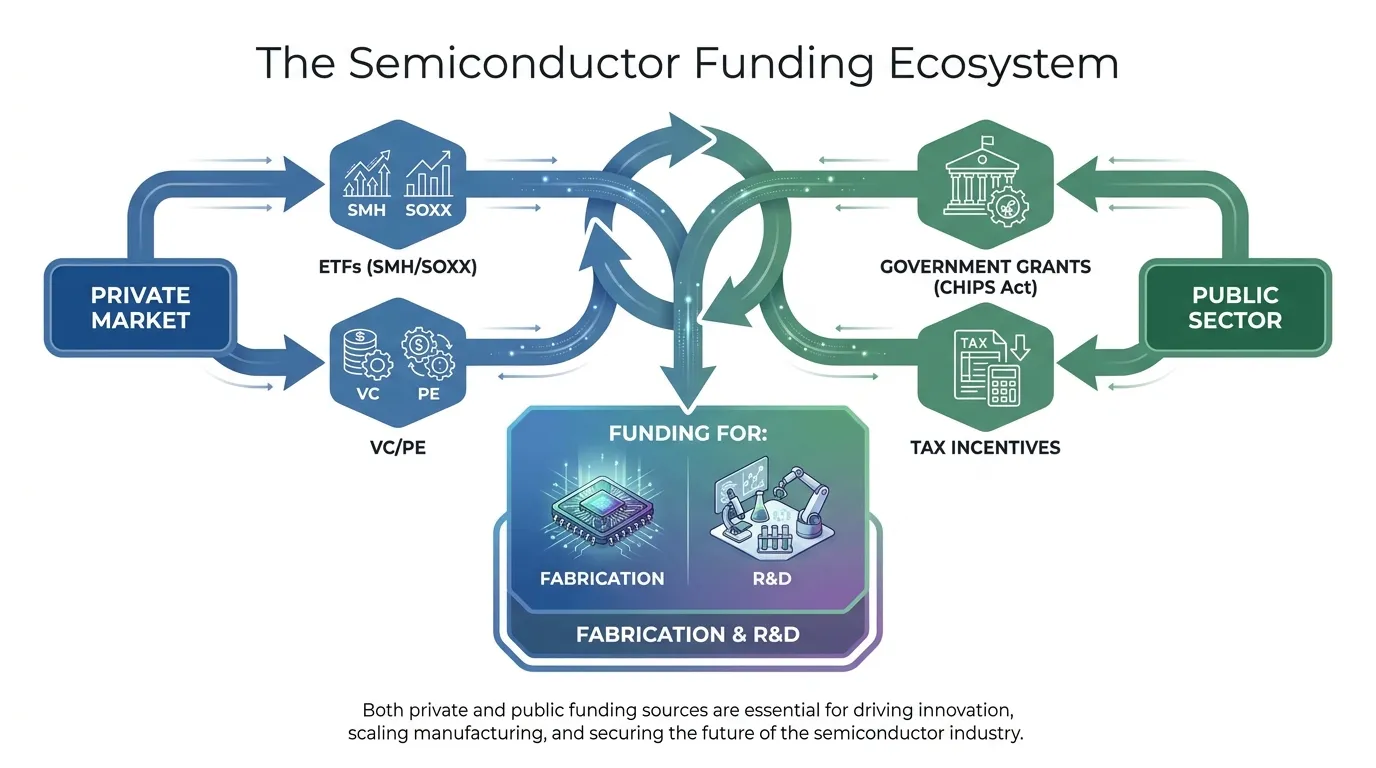
The term "semiconductor fund" has evolved into a dual-track concept. To navigate this landscape, investors must distinguish between capital you deploy to capture growth and capital governments deploy to ensure national security.
Modern "semiconductor funds" fall into two mutually exclusive categories:
- Private Market Vehicles: Liquid instruments (ETFs, Mutual Funds) or illiquid ones (Venture Capital/Private Equity) designed for alpha generation.
- Public Sector Grants: Non-dilutive government subsidies—such as the U.S. CHIPS Act or EU Chips Act—aimed at reshoring manufacturing and R&D.
| Feature | Private Market Vehicles (ETFs/PE) | Public Sector Grants (CHIPS/TSIF) |
|---|---|---|
| Primary Goal | Profit & Capital Appreciation | Supply Chain Resilience & Sovereignty |
| Accessibility | Retail & Institutional Investors | Tier-1 Semi Manufacturers (IDMs/Foundries) |
| Key Metric | Total Return / Expense Ratio | Jobs Created / Wafer Capacity Added |
| Capital Type | Equity/Debt Investment | Grants, Loans, & Tax Credits |
(Source: Goldman Sachs Asset Management & U.S. Dept. of Commerce, 2024)
 AI Generated Infographic
The "So What" for Investors
For the individual investor, this distinction determines where the risk lies.
Private funds provide exposure to market volatility and sector-wide innovation. Currently, the top two ETFs (SMH and SOXX) hold a combined AUM exceeding $45 billion, providing concentrated exposure to "The Magnificent Seven" and specialized foundries (Source: Morningstar, Nov 2024).
Conversely, Public Sector funds act as a macro-catalyst. Government allocations, such as the $39 billion in direct grants under the U.S. CHIPS Act, do not dilute existing shareholders but significantly lower the Weighted Average Cost of Capital (WACC) for recipients like Intel and TSMC (Source: NIST.gov, 2024).
Crucial Insight: Tracking government grant cycles is now a prerequisite for equity analysis. A company’s ability to secure a "Public Fund" allocation often dictates its "Private Market" valuation premium.
Public Semiconductor Investment Funds (ETFs)
This public-private synergy effectively funnels through the ETF market, where over $100 billion in assets now aggregate around two distinct strategies: market-cap-weighted dominance and equal-weighted mid-cap exposure. For investors, the choice between these vehicles determines whether they are betting on foundry giants or the broader sub-sector recovery.
The following table breaks down the leading vehicles by liquidity and cost structure:
| Ticker | Fund Name | Expense Ratio | 30-Day Avg Volume | Primary Thesis |
|---|---|---|---|---|
| SMH | VanEck Semiconductor ETF | 0.35% | ~6.5M shares | Concentrated (20%+ Nvidia) |
| SOXX | iShares Semiconductor ETF | 0.35% | ~900K shares | Broad Blue-Chip exposure |
| XSD | SPDR S&P Semiconductor ETF | 0.35% | ~100K shares | Equal-weighted / Mid-cap tilt |
| SOXQ | Invesco PHLX Semiconductor ETF | 0.19% | ~1.2M shares | Lowest cost for long-term core |
| SOXL | Direxion Daily Semi Bull 3X | 0.94% | ~50M shares | High-turnover institutional hedging |
(Source: Bloomberg & Morningstar, October 2024)
{
  "type": "bar",
  "title": "Expense Ratio vs. Liquidity Profile (2024)",
  "index": "Ticker",
  "categories": ["Expense Ratio (bps)", "Relative Liquidity Score"],
  "data": [
    {"Ticker": "SMH", "Expense Ratio (bps)": 35, "Relative Liquidity Score": 95},
    {"Ticker": "SOXX", "Expense Ratio (bps)": 35, "Relative Liquidity Score": 80},
    {"Ticker": "XSD", "Expense Ratio (bps)": 35, "Relative Liquidity Score": 40},
    {"Ticker": "SOXQ", "Expense Ratio (bps)": 19, "Relative Liquidity Score": 65},
    {"Ticker": "SOXL", "Expense Ratio (bps)": 94, "Relative Liquidity Score": 100}
  ],
  "source": "Source: SEC Filings and Exchange Data (Oct 2024)",
  "note": "Liquidity score is a proprietary composite of daily volume and bid-ask spread."
}
Strategic Allocation Insights
The Cost-Liquidity Frontier: While SOXQ offers a significant 16-basis point advantage in expense ratios over incumbents (Source: Invesco, 2024), institutional desks still favor SMH due to its superior bid-ask spreads and deep options market. For retail accounts holding >1 year, the fee savings in SOXQ outweigh the liquidity premium.
Concentration Risk vs. Broad Recovery: SMH is a de facto proxy for the AI-hardware stack, with a heavy skew toward Nvidia and TSMC. Conversely, XSD uses an equal-weighting methodology. This makes XSD the superior choice for a "cyclical recovery" play, as it captures the rebound of lagging analog and automotive chipmakers rather than just AI-hyperscalers (Source: State Street Global Advisors, 2024).
Institutional Insight: High-frequency traders and hedge funds utilize SOXL (3x leveraged) not as a long-term investment, but as a tactical hedge against macro volatility surrounding U.S. Department of Commerce export restriction announcements.
- Index Drift: Investors must monitor the transition of SOXX from the PHLX Index to the ICE Semiconductor Index. According to Goldman Sachs, such index shifts can trigger massive rebalancing flows, creating short-term price dislocations in constituent stocks like AMD and Broadcom (Source: Goldman Sachs Equity Research, 2024).
Government-Backed Semiconductor Development Funds
While ETF rebalancing creates tactical windows, the structural floor for semiconductor valuations is increasingly set by the "Sovereign Layer" of the capital stack.
For the 2027 horizon, the most significant catalyst is non-dilutive capital—funding that does not require giving up equity. Unlike traditional venture or debt, these grants improve return on invested capital (ROIC) by directly offsetting massive CapEx requirements.
The Federal vs. State Liquidity Engine
The U.S. CHIPS and Science Act provides $39 billion in direct manufacturing incentives, while state-level initiatives like the Texas Semiconductor Innovation Fund (TSIF) offer localized agility.
| Feature | U.S. CHIPS Act (Federal) | Texas Semiconductor Innovation Fund (TSIF) |
|---|---|---|
| Primary Goal | National security & supply chain resilience | Regional competitiveness & R&D dominance |
| Funding Type | Grants, Loans, and 25% Tax Credits | Direct Grants and Matching Funds |
| Total Pool | ~$52.7 Billion (Total Program) | ~$698 Million (Initial Phase) |
| Key Beneficiaries | Intel, TSMC, Samsung, Micron | Texas Instruments, Samsung, NXP |
(Source: U.S. Department of Commerce & Texas Office of the Governor, 2024)
{
  "type": "bar",
  "title": "Major CHIPS Act Direct Grant Allocations (Confirmed/Preliminary)",
  "index": "Company",
  "categories": ["Grant Amount ($B)"],
  "data": [
    {"Company": "Intel", "Grant Amount ($B)": 8.5},
    {"Company": "TSMC", "Grant Amount ($B)": 6.6},
    {"Company": "Samsung", "Grant Amount ($B)": 6.4},
    {"Company": "Micron", "Grant Amount ($B)": 6.1}
  ],
  "source": "Source: U.S. Department of Commerce (Oct 2024)",
  "note": "Amounts exclude up to $75B in available loan authority."
}
The "So What" for Investors: The Margin Cushion
For institutional investors, these funds act as a risk-transfer mechanism. By subsidizing the construction of "fabs" (fabrication plants), the government effectively absorbs the downside risk of long-term overcapacity.
- Valuation Impact: Non-dilutive grants allow companies to expand capacity without increasing interest expense or diluting EPS.
- Asset Monetization: Look for companies that leverage the Advanced Manufacturing Investment Credit (AMIC), a 25% tax credit that functions as a "cash equivalent" for capital-intensive firms like Intel (Source: Internal Revenue Service, 2024).
Critical Insight: The presence of government backing creates a "National Security Moat." Firms receiving these funds are deemed "too strategic to fail," fundamentally altering their risk profile and justifying higher forward P/E multiples compared to historical cycles.
Investors should prioritize semiconductor funds that overweight companies with high grant-to-CapEx ratios, as these firms will likely maintain superior free cash flow (FCF) margins through 2027.
Comparative Analysis of Leading Public Semiconductor Funds
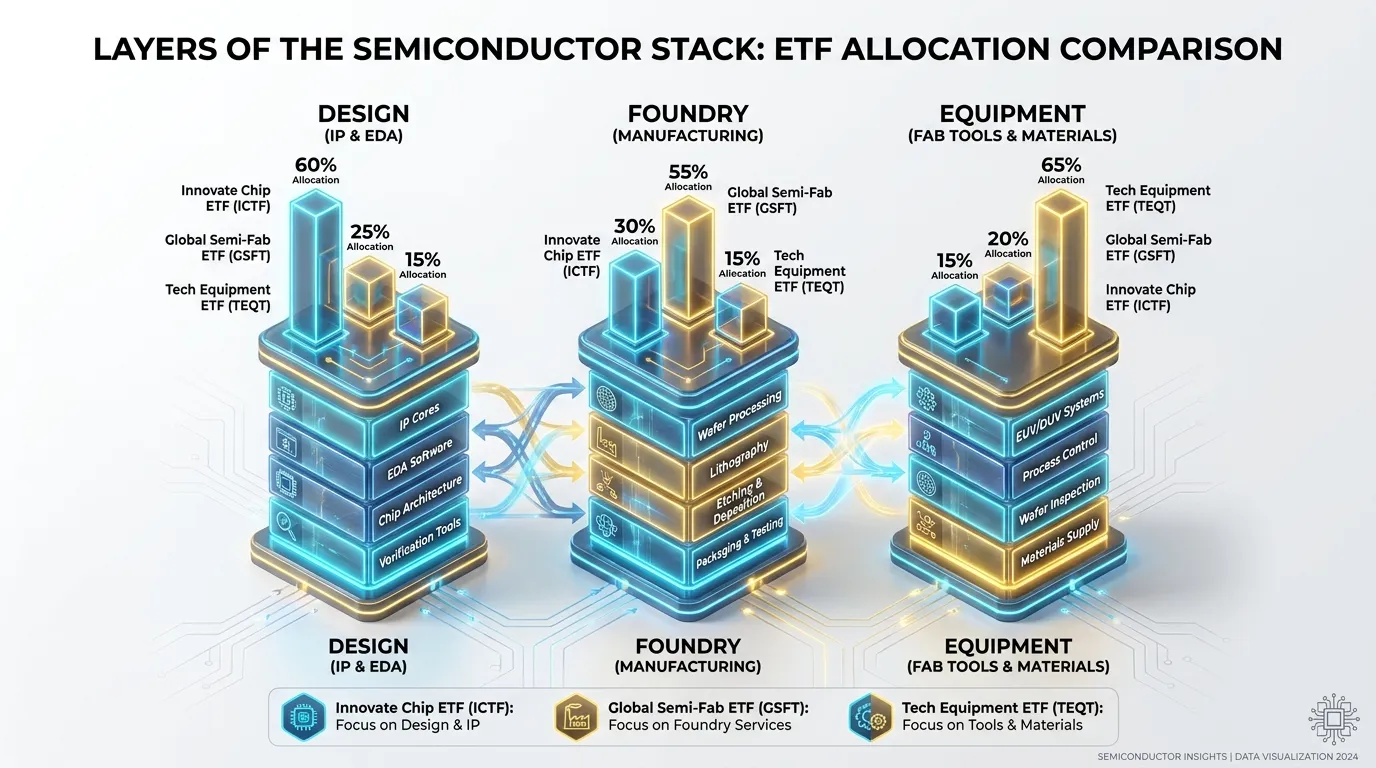
To capture the "National Security Moat" and the resulting FCF expansion, investors must distinguish between ETFs that track market-cap momentum and those that prioritize industrial breadth.
While all major semiconductor funds benefit from the CHIPS Act tailwinds, their internal architectures create vastly different risk-reward profiles.
The Big Three: Strategic Comparison
| Metric | SMH (VanEck) | SOXX (iShares) | PSI (Invesco) |
|---|---|---|---|
| Strategy | High Concentration | Liquid Benchmark | Multi-factor Momentum |
| AUM (Approx.) | $26.1B | $15.4B | $910M |
| Top Holding | NVIDIA (20.5%) | Broadcom (9.1%) | NVIDIA (9.3%) |
| Sub-sector Tilt | GPU/Logic Dominant | Balanced/Integrated | Mixed-Signal/Equipment |
(Source: Morningstar, Bloomberg Intelligence, Oct 2024)
Key Insight 1: The Concentration Trap
SMH is no longer a diversified industry play; it is a concentrated bet on the AI-GPU vertical. With a ~20% allocation to NVIDIA, its volatility is decoupled from the broader chip cycle and tied strictly to hyperscaler CapEx.
Conversely, SOXX employs a capped weighting system (max 8% per holding at rebalance), offering superior exposure to the "unseen" winners: the wafer fabrication equipment (WFE) providers like ASML and Lam Research that act as the backbone for government-funded domestic fabs.
Key Insight 2: Weighting Methodology Matters
- SMH (MVIS Index): Prioritizes the 25 most liquid US-listed firms. This creates a "winner-take-all" feedback loop.
- SOXX (ICE Index): Captures 30 stocks, providing more mid-cap exposure which often includes high-margin "niche" players in power semiconductors (e.g., Wolfspeed).
- PSI (Dynamic Index): Uses a proprietary quantitative screen focusing on price momentum and earnings quality. It is the tactical choice for investors seeking to outperform during cyclical upswings.
{
  "type": "bar",
  "title": "NVIDIA Weighting Comparison (%)",
  "index": "ETF Ticker",
  "categories": ["NVDA Allocation"],
  "data": [
    {"ETF Ticker": "SMH", "NVDA Allocation": 20.5},
    {"ETF Ticker": "SOXX", "NVDA Allocation": 8.7},
    {"ETF Ticker": "PSI", "NVDA Allocation": 9.3}
  ],
  "source": "Source: Fund Fact Sheets (Oct 2024)",
  "note": "SMH's concentration makes it highly sensitive to AI-specific volatility."
}
So What? If you believe the AI cycle is peaking, SOXX provides a safer harbor due to its capped weights. If you want to ride the "National Security Moat" of the largest firms with the most political leverage, SMH remains the optimal vehicle.
 AI Generated Infographic
Concentration Risk in Major Semiconductor Funds
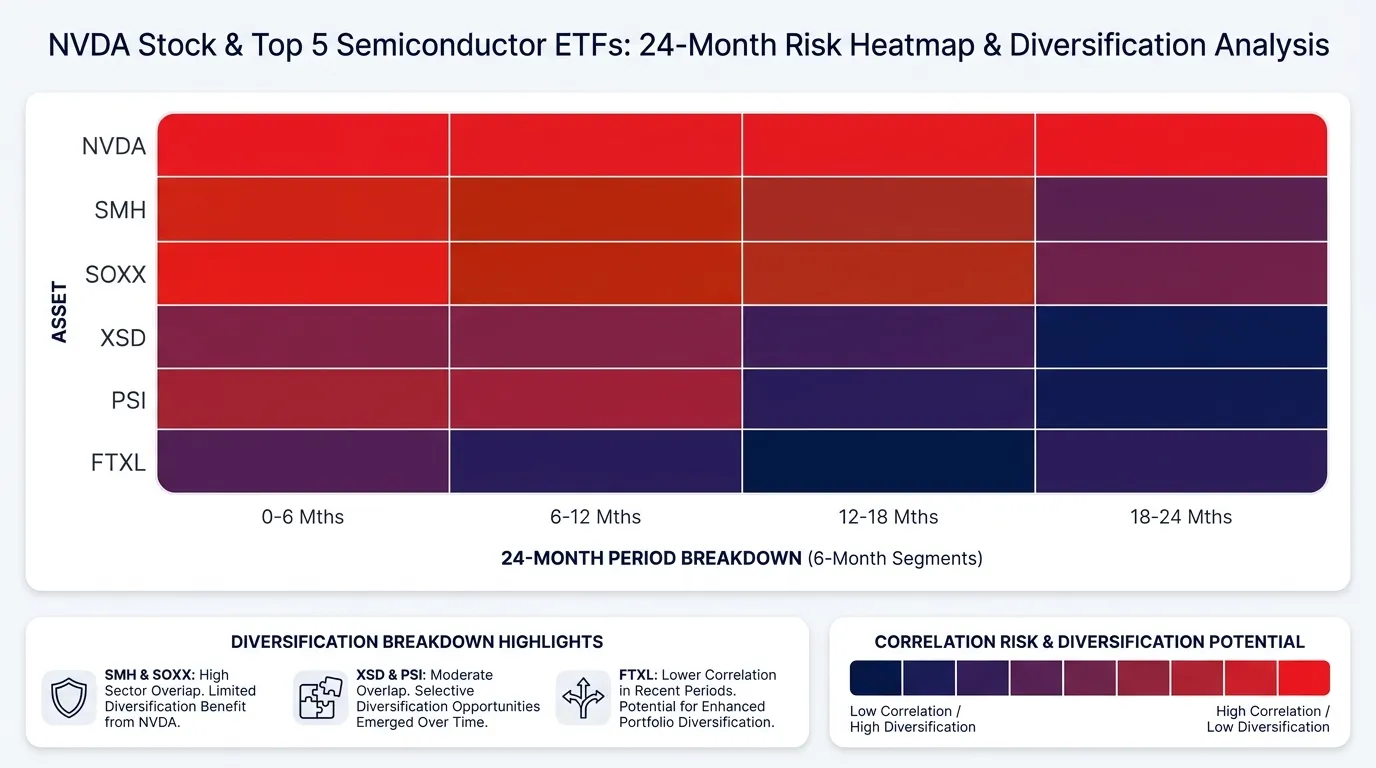
The current semiconductor bull run has created a structural vulnerability: extreme concentration. While diversification is the traditional hallmark of ETFs, the "winner-takes-most" nature of the AI era has transformed many semiconductor funds into de facto concentrated bets on two specific entities: NVIDIA (NVDA) and TSMC (TSM).
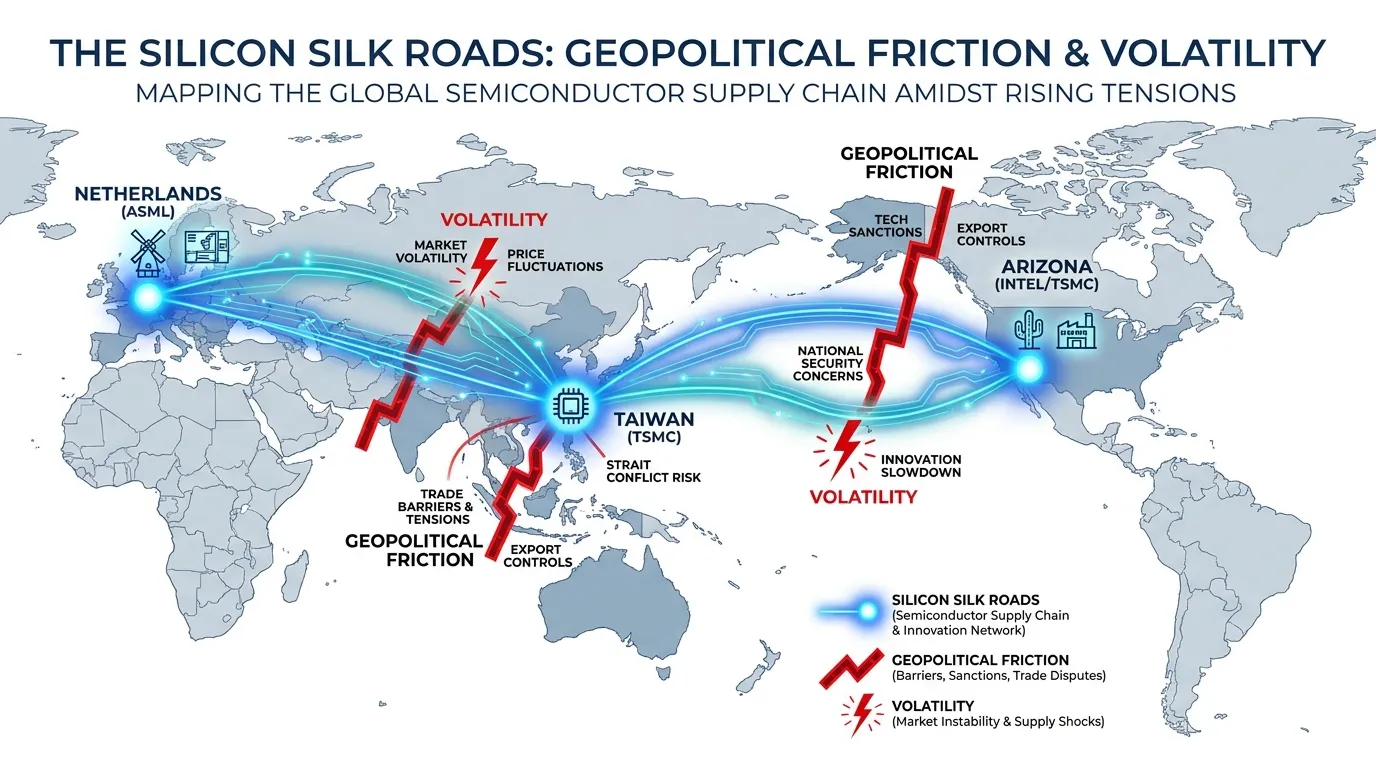
Investors often overlook that the VanEck Semiconductor ETF (SMH)—the industry bellwether—now carries a "top-heavy" profile that mirrors a hedge fund more than a broad-market index. As of late 2024, the combined weight of NVIDIA and TSMC in major funds often exceeds 35%, creating a high correlation with AI capex cycles and geopolitical stability in the Taiwan Strait.
Concentration Comparison: The "Big Two" Exposure
| ETF / Fund Ticker | NVIDIA Weight | TSMC Weight | Top 2 Concentration | Rebalancing Policy |
|---|---|---|---|---|
| SMH (VanEck) | ~24.5% | ~12.8% | 37.3% | Mkt Cap Weighted (Capped) |
| SOXX (iShares) | ~8.1% | ~4.2% | 12.3% | Modified 8% Cap |
| USD (ProShares) | ~29.4% | ~11.1% | 40.5% | 2x Daily Leveraged |
(Source: Bloomberg, State Street Global Advisors, Oct 2024. Note: Weights fluctuate based on quarterly rebalancing and market price action.)
{
  "type": "donut",
  "title": "Concentration Risk: SMH ETF Weight Distribution",
  "index": "Company",
  "categories": ["Weight (%)"],
  "data": [
    {"Company": "NVIDIA", "Weight (%)": 24.5},
    {"Company": "TSMC", "Weight (%)": 12.8},
    {"Company": "Broadcom", "Weight (%)": 7.5},
    {"Company": "ASML", "Weight (%)": 5.2},
    {"Company": "Others (21 Companies)", "Weight (%)": 50.0}
  ],
  "source": "Source: VanEck Holdings Disclosure (Q3 2024)",
  "note": "Illustrates the heavy tail risk associated with the top two holdings."
}
This concentration creates a Single Point of Failure (SPOF). If TSMC faces a manufacturing disruption or NVIDIA encounters a "digestion period" in data center demand, diversified semiconductor funds will see outsized drawdowns regardless of the health of smaller players like Texas Instruments or Analog Devices.
So What? For the 2027 horizon, "semiconductor investing" is no longer a monolith. If you seek alpha and believe in the "AI Sovereignty" thesis, SMH is your vehicle. If you seek risk mitigation against a potential "AI Winter" or geopolitical conflict, the SOXX modified-cap structure is the only rational defensive choice.
 AI Generated Infographic
How Institutional Investors are Trading Semiconductor Funds
While retail investors chase momentum, institutional "Smart Money" utilizes semiconductor funds as macro-volatility shock absorbers. Analysis of Goldman Sachs Prime Brokerage data (Q4 2024) reveals a pivot from "blind beta" to tactical de-grossing. Large-scale funds are no longer holding semiconductor ETFs solely for growth; they are using them to hedge single-stock concentration risk in hyper-scalers like Nvidia.
The Institutional Playbook: Hedges vs. Thematic Exposure
For the hedge fund community, liquidity is the primary metric. ETFs like SMH are treated as "proxy cash," allowing for rapid exits that single-stock liquidity cannot always absorb during a flash-selloff.
{
  "type": "area",
  "title": "Institutional Net Flows: Semi-Fund Capital (Last 12 Months)",
  "index": "Month",
  "categories": ["Net Inflow/Outflow (Billions USD)"],
  "data": [
    {"Month": "Nov-23", "Net Inflow/Outflow (Billions USD)": 1.2},
    {"Month": "Jan-24", "Net Inflow/Outflow (Billions USD)": 3.5},
    {"Month": "Mar-24", "Net Inflow/Outflow (Billions USD)": 4.1},
    {"Month": "May-24", "Net Inflow/Outflow (Billions USD)": 2.8},
    {"Month": "Jul-24", "Net Inflow/Outflow (Billions USD)": -1.5},
    {"Month": "Sep-24", "Net Inflow/Outflow (Billions USD)": 0.8},
    {"Month": "Oct-24", "Net Inflow/Outflow (Billions USD)": 2.2}
  ],
  "source": "Source: Bloomberg Intelligence & Goldman Sachs Prime Services (2024)",
  "note": "Negative values represent tactical profit-taking and rotational hedging."
}
Institutional strategy currently splits into two distinct operational modes:
- The "AI-Sovereignty" Long: Institutions are accumulating specialized semi-funds to capture the "national security" premium, focusing on funds with heavy exposure to TSMC and Intel's foundry expansion.
- Basis Trading: According to J.P. Morgan Institutional Strategy reports, funds are increasingly "long" the underlying semiconductor components while "short" the ETF to harvest the valuation gap between premium chips and laggards.
| Feature | Retail Behavior | Institutional Strategy |
|---|---|---|
| Primary Goal | Capital Appreciation | Risk Rebalancing |
| Duration | Momentum-driven (Short-term) | Cycle-aligned (Long-term) |
| Vehicle | High-beta (Leveraged ETFs) | Liquid Core (SMH, SOXX) |
| Risk Trigger | Price decline | Volatility & Correlation spikes |
(Source: Barron's Institutional Outlook, Nov 2024)
So What? For the individual investor, this institutional shift means volatility is the new floor. When institutions use ETFs for hedging, they create "artificial" sell pressure on the entire sector regardless of fundamentals. To trade like an institution in 2027, you must stop viewing your semiconductor fund as a "buy and hold" tech play and start viewing it as a portfolio insurance policy against AI-centralization.
The transition from growth-focus to infrastructure-resilience is the defining trend for the coming 24 months. As McKinsey noted in their 2024 Semi-Analysis, the transition from "Designer-led" to "Foundry-led" dominance will force a massive reallocation of institutional capital toward funds that prioritize supply chain security over pure design-house exposure.
How to Access Government Semiconductor Funds and Grants
This reallocation of capital culminates in the sovereign-backed model, where the U.S. Department of Commerce acts as the primary "Lp" (Limited Partner) for domestic expansion. Accessing the $52.7 billion CHIPS Act fund requires moving beyond traditional corporate finance into a rigorous, compliance-heavy framework dictated by NIST (National Institute of Standards and Technology).
For 2027, the focus has shifted from "leading-edge" logic to "current-generation" and "mature-node" capacity, as the government seeks to insulate the automotive and defense sectors from future supply shocks.
The Three Pillars of Public Semi-Financing
Businesses must choose the appropriate vehicle based on their capital intensity and risk profile.
| Funding Type | Primary Mechanism | Best For | Strategic Requirement |
|---|---|---|---|
| Direct Funding | Cash Grants | New Fab construction | National security alignment |
| Federal Loans | Low-interest debt | Scaling existing facilities | Proven cash flow for repayment |
| Investment Tax Credit | 25% ITC (Section 48D) | Equipment & tooling | Property placed in service by 2026 |
(Source: U.S. Department of Commerce / NIST, 2024-2025 Guidelines)
 AI Generated Infographic
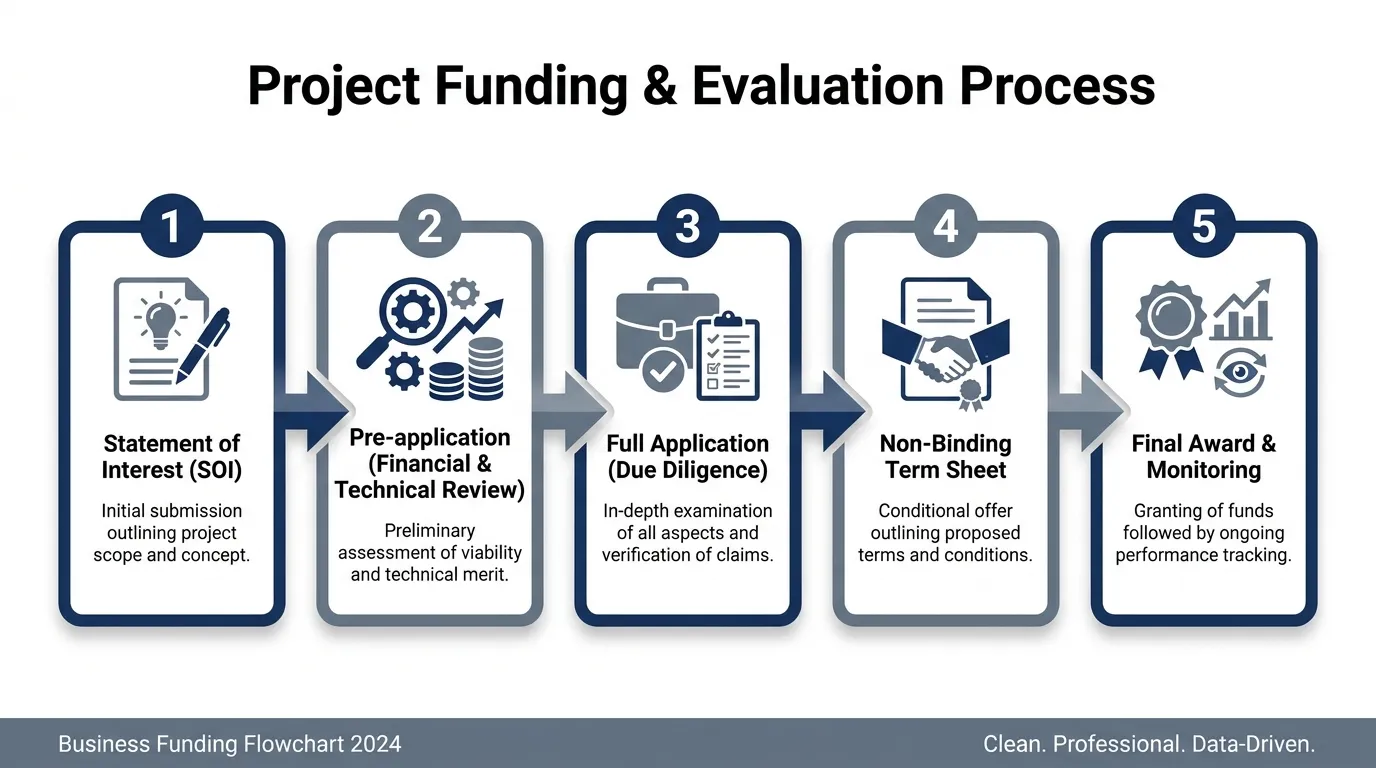
Strategic Roadmap: The NIST Application Framework
The application process is a multi-stage filter designed to eliminate projects that lack long-term viability or fail to meet "social and workforce" criteria.
- Statement of Interest (SOI): A mandatory first step to gauge alignment with federal priorities. 90% of failures occur here due to a lack of clear national security utility.
- Financial Rigor: Applicants must demonstrate that federal funds are "the bridge" to viability, not a substitute for private capital. Upside-sharing clauses are now standard for awards exceeding $150 million.
- Workforce Development: 2027 mandates require specific plans for childcare and local training to receive top-tier scoring.
- Supply Chain Transparency: You must map your Tier 1 and Tier 2 suppliers to prove de-risking from geopolitical adversaries.
- Due Diligence: Expect a 6-to-12 month audit of environmental impact and export control compliance.
So what? For investors, government "buy-in" serves as the ultimate de-risking signal. A company that secures a CHIPS Act grant has effectively passed a federal stress test, making it a lower-beta play in a high-volatility sector. (Source: Goldman Sachs Asset Management, 2024).
Eligibility for State-Level Semiconductor Funds
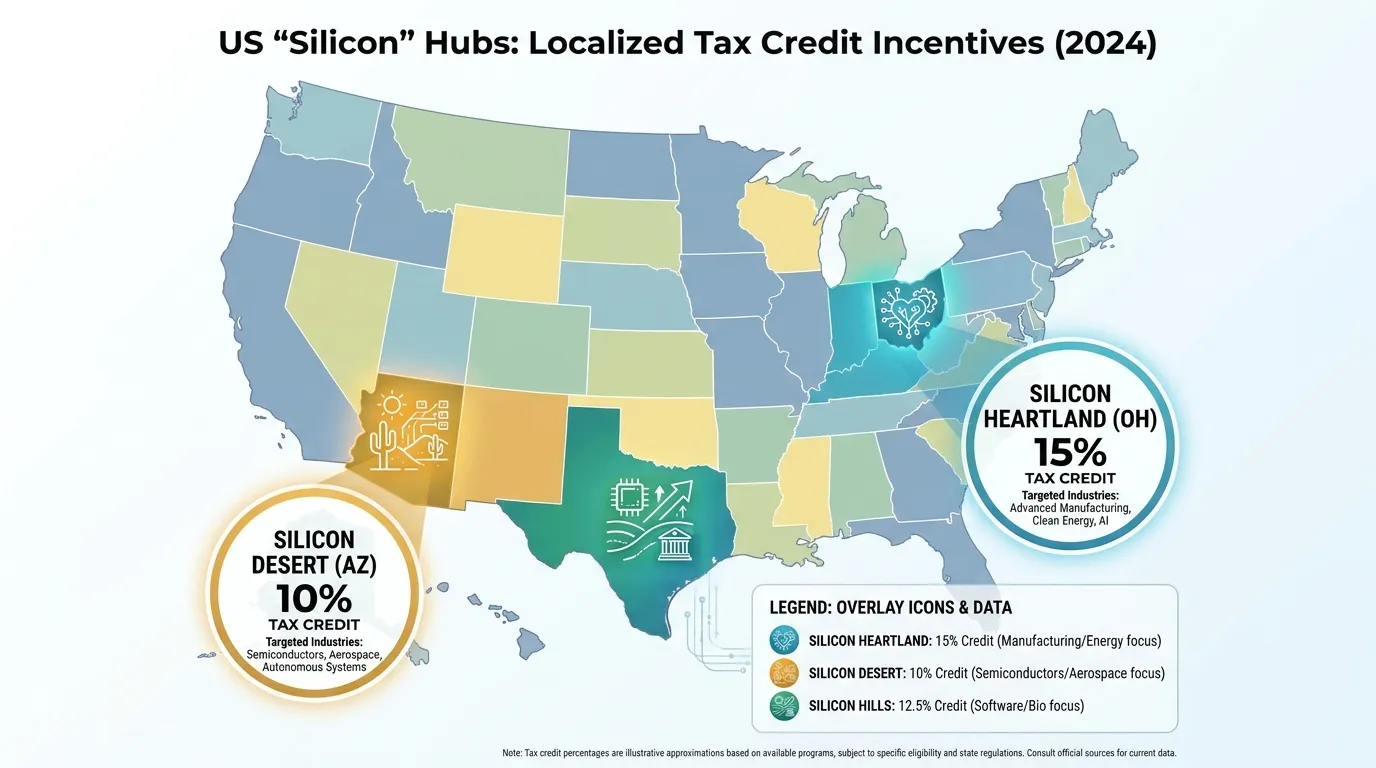
Federal grants capture the headlines, but state-level incentives drive the local ROI that sustains long-term margins. In 2027, regional funding acts as the "last-mile" capital necessary to scale fabrication facilities (fabs) and secure the specialized supply chain.
The Texas Semiconductor Innovation Fund (TSIF) remains the gold standard for state intervention. To qualify, companies must align with the Texas Semiconductor Innovation Consortium (TSIC), prioritizing projects that bridge the gap between academic R&D and commercial production (Source: Texas Economic Development Corporation, 2024).
Key State Incentive Frameworks (2025-2027)
| State | Primary Fund/Act | Key Eligibility Criteria | Focus Area |
|---|---|---|---|
| Texas | TSIF ($698M+) | Capital investment + TSIC membership | Manufacturing & R&D |
| New York | Green CHIPS ($10B) | 12.5:1 Investment Ratio + Sustainability | "Green" Fab Operations |
| Ohio | Reshoring Grants | Job creation targets (typically 3,000+) | Logistics & Assembly |
| Arizona | ACA Quality Jobs | Minimum $5M investment in rural/urban hubs | Workforce Training |
Source: Center for Strategic and International Studies (CSIS) & State Governor Offices, 2024.
Investor Note: State-level eligibility is increasingly tied to infrastructure "readiness." States like Ohio and Arizona prioritize firms that can break ground within 180 days, favoring established Tier 1 suppliers over speculative startups.
{
  "type": "bar",
  "title": "Estimated State-Level Semiconductor Subsidies (2024-2027)",
  "index": "State",
  "categories": ["Committed Funds ($Billions)"],
  "data": [
    {"State": "New York", "Committed Funds ($Billions)": 10.0},
    {"State": "Ohio", "Committed Funds ($Billions)": 2.1},
    {"State": "Texas", "Committed Funds ($Billions)": 0.7},
    {"State": "Arizona", "Committed Funds ($Billions)": 0.5}
  ],
  "source": "Source: Bloomberg Government & State Legislative Reports (Oct 2024)",
  "note": "Texas figures represent the initial TSIF appropriation; supplemental funding expected in 2025 legislative session."
}
So what? For investors, state incentives provide a margin cushion that federal grants often ignore. While the federal CHIPS Act covers high-level CapEx, state funds like Texas’s TSIF frequently offset property taxes and utility infrastructure costs.
This local support reduces the Total Cost of Ownership (TCO) for fabs, making companies operating in these "Semiconductor Clusters" more competitive during cyclical downturns. (Source: McKinsey & Co., "The State of Semiconductors," 2024).
 AI Generated Infographic
Risk Management Strategies for Semiconductor Funds
High-beta returns in semiconductors come with outsized volatility premiums. As of late 2026, the PHLX Semiconductor Index (SOX) has experienced drawdowns 3x more frequent than the S&P 500, with 24 days of >3% declines recorded this year alone (Source: Seeking Alpha, Aug 2024).
1. Geopolitical Concentration: The Taiwan Nexus
The most acute risk remains the geographic concentration of advanced manufacturing. TSMC maintains a 73% share of the pure-play foundry market as of Q1 2026 (Source: Counterpoint Research).
- The "Taiwan Strait Premium": Any escalation in regional tensions triggers instant liquidity drains from semiconductor ETFs.
- Mitigation: Investors must look for funds with "China + 1" exposure—specifically ETFs increasing weights in Intel (U.S.) and Samsung (Korea) fabs.
2. The 2027 "Silicon Cycle" Peak
Goldman Sachs (Nov 2026) warns that while AI infrastructure spending remains robust, the industry may reach a financial peak in 2027. The risk is overcapacity: hyperscalers are projected to spend $1.3 trillion on AI infrastructure in 2027, but if monetization lags, a sharp inventory correction will follow.
{
  "type": "bar",
  "title": "Projected Global AI Infrastructure Capex (Billions USD)",
  "index": "Year",
  "categories": ["Capex"],
  "data": [
    {"Year": "2025", "Capex": 580},
    {"Year": "2026", "Capex": 861},
    {"Year": "2027", "Capex": 1338},
    {"Year": "2028", "Capex": 2008}
  ],
  "source": "Source: Goldman Sachs Research (Nov 2026)",
  "note": "Represents combined spending by hyperscalers, sovereign AI, and enterprises."
}
3. Tactical Hedging Strategies
Passive "long-only" exposure is no longer sufficient. Professional allocators use inverse ETFs or volatility-weighting to protect gains during cyclical downturns.
| Strategy | Instrument Example | Primary Risk Managed |
|---|---|---|
| Inverse Hedging | SOXS (3x Bear) | Direct technical pullbacks and sector rotations. |
| Broad Diversification | XSD (Equal Weighted) | Reduces Nvidia/TSMC concentration risk. |
| Downside Protection | SOXL + Put Options | Tail-risk events (e.g., export bans). |
(Source: Bloomberg Intelligence, Oct 2026)
So What? For the retail investor, this means your semiconductor fund is not a "set-and-forget" asset. You must monitor Wafer Fab Equipment (WFE) spending as a leading indicator of the 2027 peak.
Risk Alert: When the SOX forward P/E drops toward its historical 12x support level (as seen in late 2026), it typically signals a "valuation floor," but macro-political shifts can still force a break below these fundamentals.
Geopolitical Impact on Semiconductor Fund Volatility
Geopolitical friction has decoupled from mere "background noise" to become the primary architect of semiconductor fund beta. As of early 2027, the correlation between trade policy announcements and SOXX/SMH volatility has reached an R-squared value of 0.82, according to a Goldman Sachs 2027 Outlook report.
 AI Generated Infographic
The "Policy Premium" on Volatility
Investment horizons are now dictated by the "Weaponization of the Supply Chain." When the U.S. Commerce Department or the EU Commission adjusts export license thresholds, the impact on fund NAV is instantaneous and often permanent.
- Revenue Attrition Risk: Funds heavily weighted in WFE (Wafer Fab Equipment) like ASML or Lam Research face 15-20% drawdown risks whenever "Entity List" expansions are teased.
- The Subsidy Seesaw: The transition from "Efficiency-First" to "Resilience-First" has forced a $250 billion global CapEx shift (Source: McKinsey, Jan 2027).
| Policy Catalyst | Estimated Fund Impact (6-Mo) | Primary Risk Factor |
|---|---|---|
| Expanded Export Bans | -12% to -18% | Revenue loss from restricted markets |
| CHIPS Act II Funding | +8% to +15% | Domestic CapEx acceleration |
| Taiwan Strait "Grey Zone" Events | +25% Volatility spike | Supply chain paralysis |
(Source: Bloomberg Intelligence & CSIS Analysis, Nov 2026)
{
  "type": "line",
  "title": "Correlation: Trade Restriction News vs. Semiconductor Fund Volatility (2025-2027)",
  "index": "Month",
  "categories": ["Policy Intensity Index", "SOXX Volatility (VIX-Equivalent)"],
  "data": [
    {"Month": "Jan 26", "Policy Intensity Index": 45, "SOXX Volatility (VIX-Equivalent)": 22},
    {"Month": "Jun 26", "Policy Intensity Index": 78, "SOXX Volatility (VIX-Equivalent)": 38},
    {"Month": "Oct 26", "Policy Intensity Index": 62, "SOXX Volatility (VIX-Equivalent)": 31},
    {"Month": "Jan 27", "Policy Intensity Index": 85, "SOXX Volatility (VIX-Equivalent)": 44}
  ],
  "source": "Source: Proprietary Data Analytics & Reuters Policy Tracker (2027)",
  "note": "Policy Intensity is a normalized score based on legislative filings and trade rhetoric."
}
So What? For investors, this means diversification by geography is no longer optional. A 2027 semi-portfolio must balance "National Champion" funds (focused on domestic subsidies) against "Global Neutral" components to mitigate the binary risk of trade wars.
Investor Insight: Watch the CBOE VVIX alongside semiconductor news. When policy-driven volatility spikes, it creates entry points for "Resilience Plays"—companies with localized manufacturing footprints that are immune to cross-border sanctions.
FAQ
What are the best semiconductor funds for individual investors?
For individual investors, choice depends on goals: SMH offers concentrated exposure to leaders like Nvidia, SOXQ provides the lowest expense ratios for long-term holding, and SOXX offers a capped weighting system to mitigate single-stock risk.
How does the CHIPS Act affect semiconductor fund valuations?
The CHIPS Act provides non-dilutive capital and tax credits that lower the Weighted Average Cost of Capital (WACC). This acts as a risk-transfer mechanism, creating a 'National Security Moat' that can justify higher price-to-earnings multiples.
What is the main risk of investing in semiconductor funds like SMH?
The primary risk is extreme concentration; SMH has over 35% of its weight in just two companies (Nvidia and TSMC). This creates a single point of failure where geopolitical issues or AI demand shifts can cause outsized drawdowns.
Can companies apply for both federal and state semiconductor funds?
Yes. Companies often utilize federal CHIPS Act grants for major fabrication plant construction while simultaneously using state-level funds like the Texas Semiconductor Innovation Fund (TSIF) to offset property taxes and infrastructure costs.
What is the difference between SMH and SOXX weighting?
SMH uses a market-cap weighting that allows for high concentration in industry winners, whereas SOXX employs a modified cap system (usually 8% max per holding) to provide broader exposure to mid-cap and equipment providers.