PG Stock at a 52-Week High: How to Read the Quote, the Dividend, and Valuation
Founder of Tritonix.ai. Former Hedge Fund Analyst with 10+ years of experience managing over $1B AUM across insurance portfolios and private funds. Specializes in institutional-grade fundamental analysis and long-term capital allocation.
How to read the latest PG stock quote
U.S. cash markets were closed on Saturday, November 14, 2026. The latest official reading on PG stock is therefore Friday's New York close, not a weekend print or an after-hours flicker.
Yahoo Finance and StockAnalysis both show The Procter & Gamble Company (NYSE: PG) closing at $169.80 on November 13, 2026, up $1.77, or 1.05%, from the prior close of $168.03. The session opened at $168.97, traded between $167.20 and $170.73, and finished just below that high.
CNBC timestamps the $170.73 print as the 52-week high, set on November 13 itself. Yahoo Finance and CNBC both show after-hours trade near $169.95, a few cents above the cash close; those quotes should not replace the official session.
Volume was quieter than recently. StockAnalysis records about 6.94 million shares, versus a 20-day average of roughly 10.07 million. A light Friday at a new high is not a breakout confirmation; it only tells you that the $170 handle was accepted without a scramble for liquidity.
| Quote field | Reading at the Nov. 13, 2026 close |
|---|---|
| Official cash close | $169.80 |
| Day range | $167.20–$170.73 |
| 52-week range | $137.62–$170.73 |
| Market cap | $393.56 billion |
| Shares outstanding | 2.32 billion |
| 50-day / 200-day moving averages | $154.26 / $149.88 |
| Trailing dividend / yield | $4.35 / 2.56% |
| Beta (5-year) | 0.36 |
Source: StockAnalysis quote and statistics pages, close of November 13, 2026; 52-week high and low dates from CNBC.
Friday's $169.80 close sits just 93 cents, or 0.5%, below the new 52-week high of $170.73, and 10.1% above the 50-day average of $154.26.
The 52-week span matters more than the daily bar. CNBC dates the 52-week low at $137.62 on January 7, 2026. Friday's close is 23.4% above that low and only 0.5% under the high. StockAnalysis puts the 52-week price change at +14.72%. From the November 13, 2025 close of $147.96, the unadjusted quote is up 14.8% over 12 months, according to Yahoo Finance historical prices.
Market cap is simply price times shares. At $169.80 and 2.32 billion shares outstanding, StockAnalysis's $393.56 billion figure follows directly. Enterprise value is $417.12 billion after net debt of $23.56 billion.
The 2026 price path: a January low, a midyear fade, and an earnings repair
PG stock did not drift to a 52-week high. It was rebuilt. Yahoo Finance shows a December 31, 2025 close of $143.31. From that starting point, the unadjusted quote is up 18.5% year to date.
{
  "type": "line",
  "title": "PG Stock Closing Price Through the 2026 Recovery",
  "index": "Date",
  "categories": ["Close"],
  "data": [
    {"Date": "2025-11-13", "Close": 147.96},
    {"Date": "2025-12-31", "Close": 143.31},
    {"Date": "2026-01-07", "Close": 138.04},
    {"Date": "2026-01-30", "Close": 151.77},
    {"Date": "2026-02-13", "Close": 160.07},
    {"Date": "2026-05-29", "Close": 143.56},
    {"Date": "2026-06-30", "Close": 146.64},
    {"Date": "2026-09-30", "Close": 145.28},
    {"Date": "2026-10-21", "Close": 156.84},
    {"Date": "2026-10-22", "Close": 165.59},
    {"Date": "2026-11-13", "Close": 169.80}
  ],
  "source": "Yahoo Finance historical prices, unadjusted session closes through November 13, 2026",
  "note": "January 7's $137.62 low and November 13's $170.73 high were intraday prints; the chart uses official closes."
}
The year began with a flush. On January 7, 2026, the shares printed the 52-week low of $137.62 and closed at $138.04. They then recovered into mid-February, closing February 13 at $160.07, before that bounce faded. By May 29 the close was back at $143.56, and the June 30 fiscal year-end close was $146.64.
The summer did not resolve the debate. After P&G reported fiscal 2026 results on July 29, the stock closed at $146.10, still stuck in the mid-$140s. The September 30 close was $145.28. The real move started in October. The shares closed October 1 at $143.95 and had already reached $156.84 by October 21, the session before the first-quarter report.
October 22 is the day that still defines the current quote. Before the open, P&G posted a volume-led beat and reaffirmed its organic-sales and earnings guidance. The stock closed at $165.59, up 5.58% from the prior close, on about 22.0 million shares — more than twice the later 20-day average. From that close, the shares have added another 2.5% into Friday's $169.80 finish.
The $169.80 quote is less a slow grind than a six-week re-rating: unadjusted, PG stock is up 18.0% from the October 1 close of $143.95.
A 0.36 beta and short interest of only 0.97% of shares outstanding, or 2.28 days to cover, help explain why the repair has been orderly rather than violent. There is not a large short book to squeeze, and the stock does not usually move with high-beta risk-on tapes.
Q1 results: volume-led growth meets a $1.4 billion cost squeeze
The fundamental case for this PG stock rally is the first quarter of fiscal 2027, which covers July through September and was released on October 22. In its official results, P&G reported net sales of $23.3 billion, up 4% from $22.4 billion a year earlier. Organic sales, which strip out foreign exchange and acquisitions and divestitures, also rose 4%.
Management said that gain was driven by a 2% increase in volume and a 1% lift from favorable mix, with pricing a minor positive. Morningstar's Erin Lash, writing on October 22, put a finer point on the split: a 2.4% volume increase and a 1.6% aggregate benefit from higher prices and a favorable mix.
All five segments grew on an organic basis, according to P&G's commentary:
| Segment | Organic sales vs. year ago |
|---|---|
| Beauty | +5% |
| Grooming | +5% |
| Fabric & Home Care | +5% |
| Health Care | +3% |
| Baby, Feminine & Family Care | +3% |
| Total company | +4% |
Source: P&G FY2027 first-quarter results, October 22, 2026. Segment figures are the company's rounded commentary.
{
  "type": "bar",
  "title": "P&G Q1 FY2027 Organic Sales Growth by Segment",
  "index": "Segment",
  "categories": ["Organic Sales Growth %"],
  "data": [
    {"Segment": "Beauty", "Organic Sales Growth %": 5},
    {"Segment": "Grooming", "Organic Sales Growth %": 5},
    {"Segment": "Fabric & Home Care", "Organic Sales Growth %": 5},
    {"Segment": "Health Care", "Organic Sales Growth %": 3},
    {"Segment": "Baby, Feminine & Family Care", "Organic Sales Growth %": 3}
  ],
  "source": "P&G FY2027 first-quarter results, October 22, 2026",
  "note": "Company-level organic sales rose 4%. Figures are P&G's rounded segment commentary."
}
Diluted earnings per share were $1.97, up 1% from $1.95. Core EPS was $2.00, also up 1% from $1.99; currency-neutral core EPS was unchanged. Net earnings were $4.8 billion. Operating cash flow was $5.8 billion, and free cash flow productivity was 93%.
The income statement was less clean than the sales line. Reported gross margin fell 160 basis points. Core gross margin and currency-neutral core gross margin each fell 150 basis points, which Morningstar locates at an adjusted gross margin of 49.8%. P&G blamed 140 basis points of higher commodity costs and 140 basis points of product reinvestments, only partly offset by 120 basis points of gross productivity savings, 50 basis points of tariff-related cost relief and recoveries, and 20 basis points of higher pricing.
Core SG&A as a percentage of sales improved by 80 basis points, helped by 130 basis points of productivity savings and 100 basis points of sales leverage. Even so, core operating margin still declined 80 basis points, or 90 basis points on a currency-neutral basis, despite 250 basis points of gross productivity savings.
CEO Shailesh Jejurikar, whom the October 22 release names as chairman, president, and chief executive officer, called the quarter "sharpened execution of our integrated strategy" and said the start "keeps us on track" for fiscal 2027 guidance. The company updated all-in sales growth to 2% to 4% to reflect the October 1 close of the Thorne acquisition, and it maintained organic sales growth of 1% to 3%, including a 30-to-50 basis-point headwind from brand, product-form, and go-to-market discontinuations.
It also maintained diluted EPS growth of 1% to 5% versus fiscal 2026 diluted EPS of $6.62, and core EPS growth of in-line to 3% versus core EPS of $6.89. That core range is $6.89 to $7.11, with a midpoint of $7.00, or about 1.5% growth.
Q1 organic sales of +4% sit above the 1-to-3% full-year organic range, but core EPS of +1% is already at the low end of the in-line-to-3% earnings guide.
The tension is cost. P&G now expects an after-tax commodity headwind of about $1.4 billion, plus $300 million from higher net interest expense, $150 million from lower non-operating income, and $50 million from unfavorable foreign exchange. Combined, those items are a $0.79 per-share drag, or an 11% headwind to core EPS growth. Productivity has to keep working, or the midpoint of $7.00 will prove optimistic.
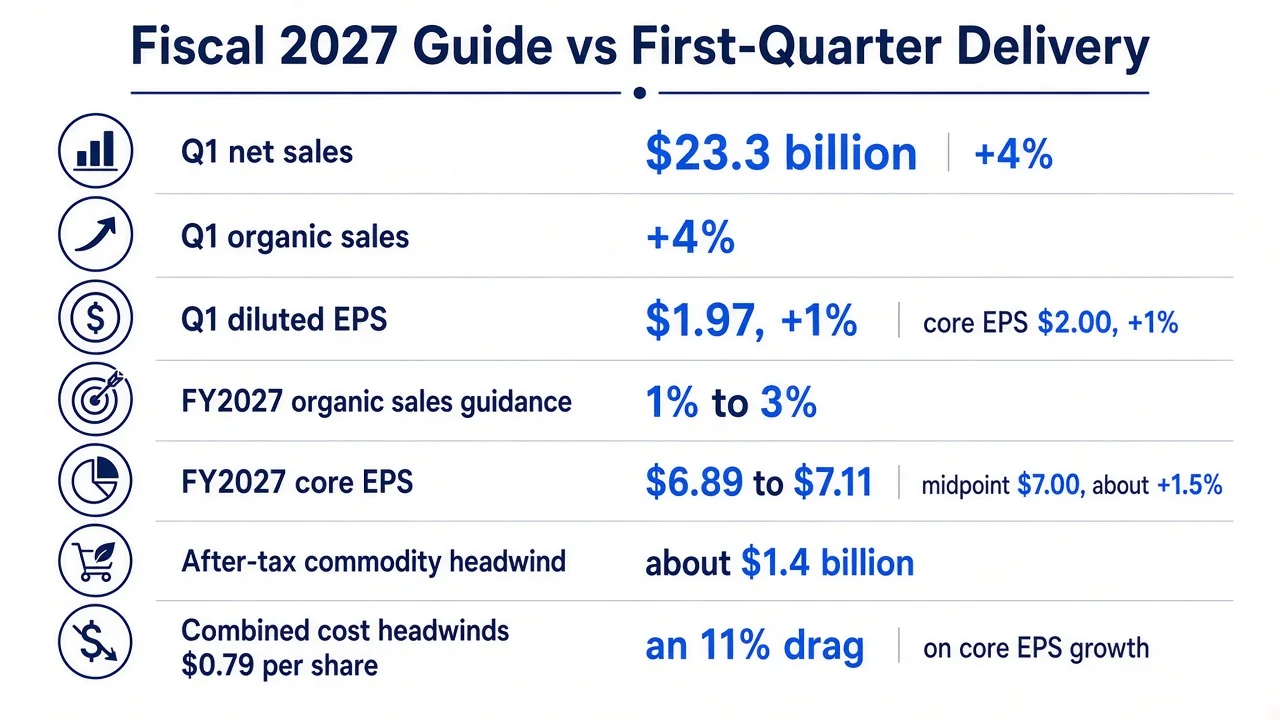 P&G's fiscal 2027 guide against the first-quarter print and the $1.4 billion after-tax commodity headwind. Figures from the October 22, 2026 earnings release.
Fiscal 2026 is the base this guide is built on. In its July 29 release, P&G reported full-year net sales of $87.0 billion, up 3%, organic sales up 1%, diluted EPS of $6.62, up 2%, and core EPS of $6.89, up 1%. The fourth quarter was softer: organic sales were unchanged, and diluted EPS fell 15% to $1.26. The first-quarter volume recovery is the first clean evidence that the "foundation building" year is producing faster top-line growth.
The 70-year dividend and the cash P&G is sending back
For many holders, PG stock is a cash-return vehicle first and a growth story second. On April 14, 2026, the board raised the quarterly dividend 3% to $1.0885 a share, or $4.354 annualized. StockAnalysis rounds the annual rate to $4.35, which at Friday's close is a 2.56% yield.
That increase was the 70th consecutive year P&G has raised its dividend, and the company has paid one for 136 consecutive years since its incorporation in 1890. StockAnalysis records 3.48% year-over-year dividend growth, a 65.61% earnings payout ratio, and a 65.79% free-cash-flow payout ratio. None of those ratios is stretched for a Dividend King, but none leaves a wide surplus either.
In fiscal 2026, P&G returned more than $15 billion to shareholders: $10.2 billion in dividends and $5.0 billion in buybacks. For fiscal 2027, it still plans to pay more than $10 billion in dividends and repurchase about $5 billion of common shares, and it guided free cash flow productivity to 85% to 90%. In the first quarter it already returned $3.9 billion, including $2.6 billion of dividends and $1.3 billion of repurchases, on free cash flow productivity of 93%.
Trailing twelve-month free cash flow is $15.34 billion, or $6.62 a share, according to StockAnalysis, almost identical to trailing EPS of $6.64. The free-cash-flow yield at $169.80 is 3.90%. Add the 1.31% buyback yield and the shareholder yield is 3.87%.
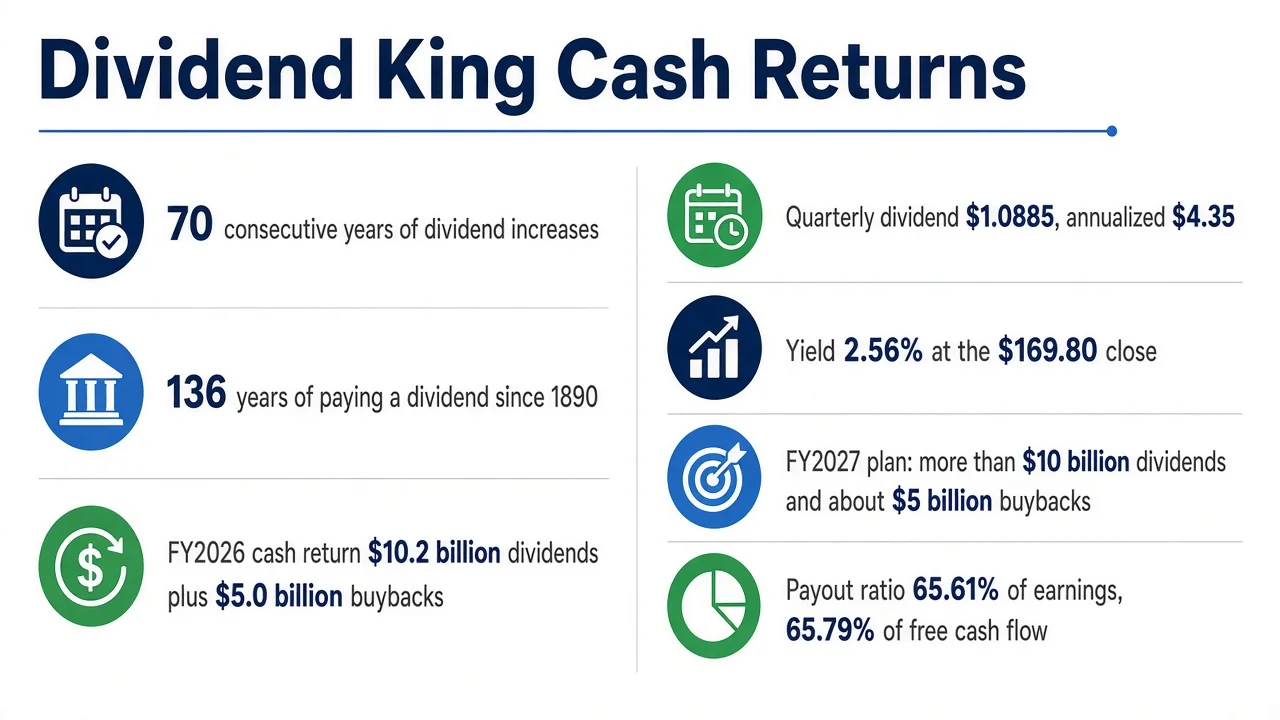 P&G's dividend streak and planned cash returns, as of the November 13, 2026 close. Figures from P&G's April 2026 dividend declaration, FY2026 and Q1 FY2027 results, and StockAnalysis.
The $4.35 annual dividend is covered, but the 66% earnings and free-cash-flow payout ratios mean future raises will have to come from modest earnings growth, not from a fatter payout.
The next scheduled catalyst for that story is already on the calendar. P&G will host Investor Day 2026 on Thursday, November 19, at 2:00 p.m. ET in Cincinnati, with Jejurikar and CFO Andre Schulten scheduled to discuss strategy and long-term value creation.
Valuation: a quality multiple with little consensus upside
At $169.80, PG stock is no longer priced like a January recovery. StockAnalysis lists a trailing P/E of 25.59, a forward P/E of 24.02, a price-to-sales ratio of 4.48, a price-to-book ratio of 7.24, and a price-to-free-cash-flow multiple of 25.66. EV/EBITDA is 16.63. The PEG ratio is 5.16, which is what a mid-20s earnings multiple looks like when three-year EPS growth is forecast at only 4.14%.
| Valuation measure | At the Nov. 13, 2026 close |
|---|---|
| Trailing P/E | 25.59 |
| Forward P/E | 24.02 |
| EV / EBITDA | 16.63 |
| Price / free cash flow | 25.66 |
| Price / sales | 4.48 |
| Price / book | 7.24 |
| PEG | 5.16 |
| Free-cash-flow yield | 3.90% |
| Average 25-analyst target | $174.04 (+2.5%) |
Source: StockAnalysis statistics, close of November 13, 2026.
On the company's own midpoint, the multiple is similar. Fiscal 2027 core EPS guidance is centered at $7.00. $169.80 divided by $7.00 is 24.3 times, almost identical to the stated forward P/E. Morningstar shows a normalized P/E of 24.61, versus 36.21 for L'Oréal and 19.54 for Unilever, so P&G sits between its closest global peers rather than at a distressed discount.
The Street has little room left to work with. Twenty-five analysts, per StockAnalysis, rate the stock a Buy with an average target of $174.04, only 2.5% above Friday's close. That is not a hidden-value setup. It is a quality compounder that has already been paid up for a better quarter and a successful defense of guidance.
Institutions own 71.27% of the shares, with insider ownership only 0.06%, according to StockAnalysis. Changes in those large positions are worth watching in 13F data and in tools that track institutional smart money, because a stock this widely held tends to move when allocators rebalance around income and defensive exposures, not when a single catalyst appears.
Return on equity is 29.61% and return on invested capital is 21.88%. Interest coverage of 24.23 times is comfortable. The weaker point is the balance-sheet shape of a large staples company: a current ratio of 0.72, a quick ratio of 0.49, and net debt of $23.56 billion, or $10.16 a share, against book value of $23.45. Those ratios have not stopped P&G from funding the dividend, but they leave less slack if commodity inflation stays elevated.
At 25.6 times trailing earnings and only 2.5% below the average target, PG stock is priced for the quality it has already shown, not for a second re-rating.
What could move PG stock next
The immediate event is Investor Day on November 19. Investors will listen for any tightening of the 1-to-3% organic sales range, any change in the $1.4 billion commodity headwind, and whether management still sees a path to the $7.00 core EPS midpoint. A confident productivity update could support the new high. A wider cost warning would test it, because the multiple now assumes the guide holds.
CNBC estimates the next earnings date at January 20, 2027. Until then, the tape is likely to trade on staples-relative flows, the $154.26 50-day average as a first support zone, and whether Friday's $170.73 high is retaken with heavier volume than the 6.94 million shares seen on November 13.
The bull case is straightforward. Organic sales have reaccelerated to 4%, volume is positive in the largest categories, all five segments are growing, and the company is still pointing to more than $15 billion of planned cash returns in fiscal 2027. The 0.36 beta and 70-year dividend streak keep the stock in defensive and income mandates even when growth stocks are in favor.
The bear case is also clear. Core earnings grew only 1% in the quarter, gross margin is absorbing a large commodity bill, and fiscal 2027 core EPS growth is guided at no more than 3%. A PEG above 5 leaves little room if that growth slips, or if the Thorne deal and brand discontinuations complicate the all-in sales comparison.
For readers building a staples thesis, the useful work is not staring at the last print. It is comparing the $169.80 quote with the $7.00 earnings midpoint, the 2.56% yield, and the cost headwinds management has already flagged, then deciding whether that package still compensates for a stock sitting on a 52-week high. An AI investment research agent can help keep those moving pieces — guidance, commodity costs, and institutional flows — in one workspace as the Investor Day and January print approach.
FAQ
What is the PG stock price today?
The latest official PG stock price is the Friday, November 13, 2026, U.S. cash close of $169.80, up $1.77, or 1.05%, from the prior close of $168.03. U.S. markets were closed on Saturday, November 14, 2026, so weekend or after-hours prints near $169.95 should not replace that official close.
Why did PG stock hit a 52-week high in November 2026?
CNBC dates the 52-week high of $170.73 to November 13, 2026, with a cash close of $169.80. The move followed P&G's October 22 first-quarter fiscal 2027 report, when net sales and organic sales both rose 4% and the stock closed at $165.59, up 5.58%. From the October 1 close of $143.95, the unadjusted quote is up 18.0%.
Is PG stock cheap at the current price?
At the November 13 close of $169.80, StockAnalysis shows a trailing P/E of 25.59, a forward P/E of 24.02, and a free-cash-flow yield of 3.90%. Fiscal 2027 core EPS guidance is centered at $7.00, or about 24.3 times Friday's price. The average 25-analyst target of $174.04 implies only 2.5% upside, so the market has already paid up for the first-quarter beat.
How long has P&G increased its dividend?
On April 14, 2026, P&G raised its quarterly dividend 3% to $1.0885 a share, or $4.35 annualized at the rounded StockAnalysis rate, marking the 70th consecutive year of dividend increases. The company has paid a dividend for 136 consecutive years since its incorporation in 1890. At the $169.80 close the yield is 2.56%, with a 65.61% earnings payout ratio.
What could move PG stock next?
P&G will host Investor Day on November 19, 2026, at 2:00 p.m. ET in Cincinnati. Investors will focus on the 1-to-3% organic sales guide, the $1.4 billion after-tax commodity headwind, and the $7.00 core EPS midpoint. CNBC estimates the next earnings date at January 20, 2027. Until then, the $154.26 50-day average and the $170.73 high are the nearest technical levels.