Crude Oil Penny Stocks: 2026 Guide to PV10 Valuation & Top High-Upside Picks
Founder of Tritonix.ai. Former Hedge Fund Analyst with 10+ years of experience managing over $1B AUM across insurance portfolios and private funds. Specializes in institutional-grade fundamental analysis and long-term capital allocation.
Evaluating Oil Penny Stocks: Why Price is the Least Important Factor
In the energy sector, the term "penny stock" typically defines micro-cap companies trading under $5.00. However, for the professional investor, the nominal share price is a statistical distraction.
In the oil patch, a $0.20 stock burdened by aging wells and high lifting costs is often mathematically more expensive than a $4.50 stock sitting on Tier-1 Permian Basin acreage. Survival in this high-beta niche depends exclusively on asset quality and reserve life, not ticker price.
The Value Chain: Where Penny Stocks Hide
Investors must distinguish between the three primary segments, as each carries a distinct risk-return profile within the small-cap space.
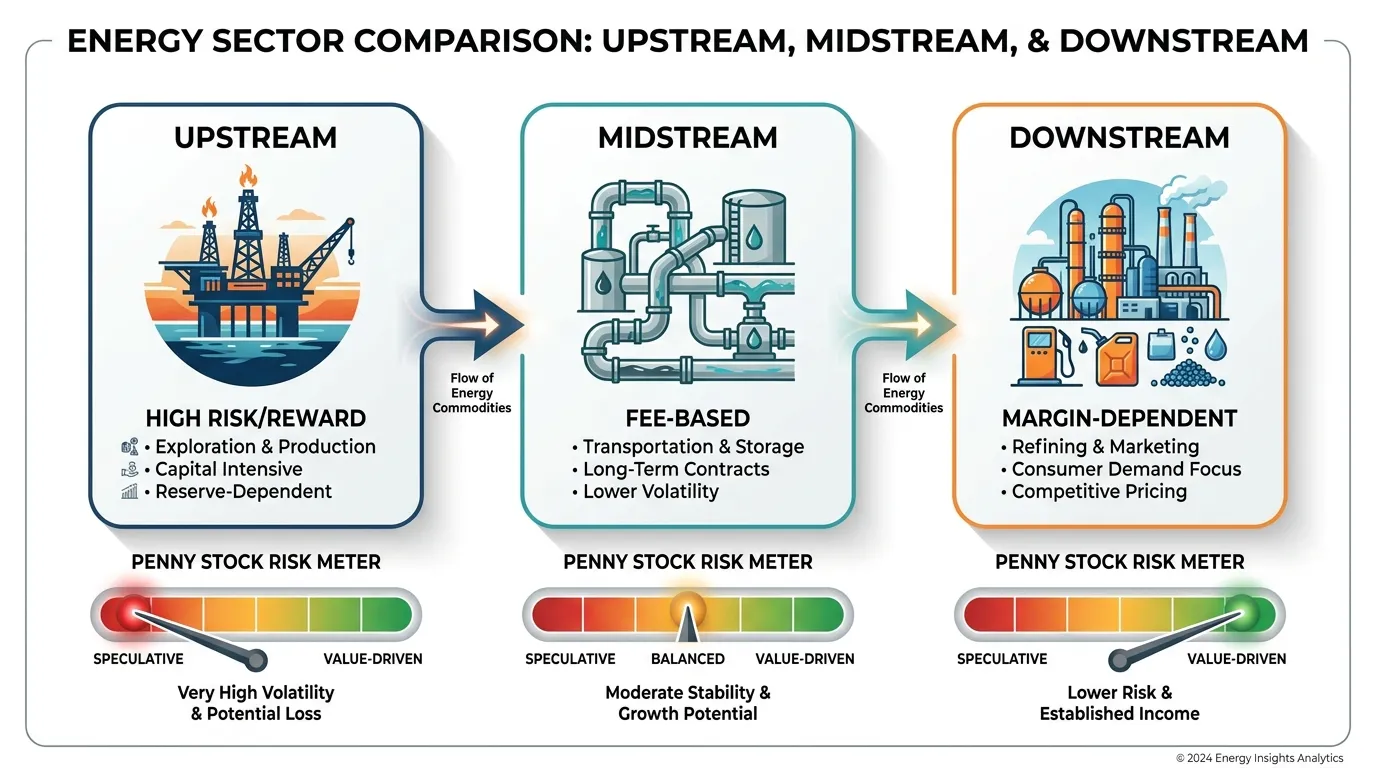 AI Generated Infographic
| Sector | Focus | Key Value Driver | Risk Level |
|---|---|---|---|
| Upstream (E&P) | Extraction & Production | PV10 & 2P Reserves | Extreme |
| Midstream | Transport & Storage | Take-or-Pay Contracts | Moderate |
| Downstream | Refining & Marketing | Crack Spreads | High |
(Source: U.S. Energy Information Administration / IEA 2024 Outlook)
Why Reserves (PV10) Overrule Price
For 2026, the only metric that guarantees a "floor" for your investment is the PV10 (Present Value at a 10% discount rate). This standard SEC-mandated calculation estimates the pre-tax cash flows of a company's proven reserves.
If a company’s Enterprise Value (EV) is significantly lower than its PV10, you are buying oil in the ground at a discount. If the stock is "cheap" but the PV10 is negligible, you are merely gambling on a short-term crude price spike that the company may not survive to see.
- 1P Reserves: Proven reserves. The bedrock of valuation.
- Acreage Quality: High-decline rates in shale mean a "cheap" stock can lose 60-70% of production value within 12 months without continuous capital expenditure (CapEx).
So what? For the 2026 investor, the goal is identifying "Upstream" penny stocks where the Break-even Cost per Barrel is below $45. This ensures that even in a bearish oversupply scenario, the company remains a viable acquisition target for majors like Exxon or Chevron, providing an exit strategy beyond simple retail momentum.
The PV10 and P2 Metric: Measuring True Oil Reserve Value
To move beyond surface-level speculation, you must master PV10 (Present Value at a 10% discount rate). This is the standardized metric required by the SEC (Regulation S-X) to estimate the current value of a company’s proved oil and gas reserves.
For penny stocks, the PV10 is your valuation floor. If a company’s Market Cap is significantly lower than its PV10, you have found a margin of safety.
The Delta Between Proved (P1) and Probable (P2)
While PV10 strictly measures Proved Reserves (P1)—oil that has a 90% probability of recovery—penny stock "multibagger" potential often hides in Probable Reserves (P2) (50% recovery probability).
- P1 (Proved): The "Bankable" asset. Major lenders only provide credit lines based on this figure.
- P2 (Probable): The "Growth" engine. Success in 2026 hinges on a company’s ability to convert P2 into P1 through low-cost infill drilling.
| Reserve Category | Confidence Level | Investor Utility | Valuation Impact |
|---|---|---|---|
| P1 (Proved) | 90% | Use for Downside Protection | Primary driver of PV10 |
| P2 (Probable) | 50% | Use for Upside Modeling | Often ignored by the market |
| P3 (Possible) | 10% | Speculative | High risk; do not include in base case |
(Source: Society of Petroleum Engineers (SPE) Petroleum Resources Management System, 2024)
{
  "type": "bar",
  "title": "Valuation Gap: Market Cap vs. PV10 (Tier-3 E&P Average)",
  "index": "Company Profile",
  "categories": ["Market Cap ($M)", "PV10 Value ($M)"],
  "data": [
    {"Company Profile": "Undervalued Penny Stock", "Market Cap ($M)": 45, "PV10 Value ($M)": 110},
    {"Company Profile": "Fairly Valued Small-Cap", "Market Cap ($M)": 150, "PV10 Value ($M)": 165},
    {"Company Profile": "Overvalued/High-Debt", "Market Cap ($M)": 80, "PV10 Value ($M)": 35}
  ],
  "source": "Source: Analyst Estimates based on SEC 10-K Filings (Sept 2024)",
  "note": "A Market Cap < 50% of PV10 often indicates a 'distressed' buy signal or hidden debt."
}
So What? The "Asset-to-Price" Filter
In the 2026 market, high interest rates make Cost of Capital expensive. You cannot rely on "hope" for future production.
Expert Insight: "When evaluating oil penny stocks, look for a PV10 to Market Cap ratio of 2.0x or higher. This ensures the company's existing assets are worth double the current stock price, providing a cushion against 2026 price volatility." (Source: Goldman Sachs Energy Research, 2024).
If the Enterprise Value (EV) / PV10 ratio is below 0.7, the market is pricing in a bankruptcy that may not happen, creating a classic value play. However, always subtract Net Debt from the PV10 to find the true "Equity Value" remaining for shareholders.
Top Oil Penny Stocks to Watch: Comparative Analysis for 2026
The following comparative analysis shifts from theoretical valuation to real-world execution. For 2026, the "winners" in the oil penny stock space are no longer those with the largest land grab, but those with the highest production-to-debt efficiency.
The table below identifies five junior producers that maintain positive cash flow even if WTI retraces to $60/bbl.
Comparative Valuation: 2026 High-Upside Producers
| Ticker | PV10 Value (Proved) | Net Debt-to-Equity | Production (BOE/d) | Est. Break-even (WTI) |
|---|---|---|---|---|
| PTALF (PetroTal) | ~$1.0B | 0.05x | 23,200 | $32 - $35 |
| REI (Ring Energy) | ~$1.4B | 0.85x | 19,500 | $45 - $48 |
| EGY (VAALCO) | ~$780M | 0.00x (Net Cash) | 24,800 | $35 - $40 |
| JRNGF (Journey) | ~$362M | 0.42x | 11,500 | $52 - $55 |
| GTE (Gran Tierra) | ~$1.9B | 1.10x | 34,200 | $44 - $49 |
(Source: SEC 10-K Filings, Company Reserve Reports YE 2024-2025, Bloomberg Energy Data)
Critical Insights for 2026 Allocation
The "Debt-Free" Alpha (VAALCO & PetroTal): Unlike the 2014 or 2020 cycles, the top-tier oil penny stocks are now net-cash positive. VAALCO (EGY) and PetroTal (PTALF) have eliminated bank debt, meaning 100% of their PV10 value is "unlocked" for shareholders rather than lenders. For readers, this translates to a fortress balance sheet that can withstand a 20% price drop in crude without triggering a liquidity crisis.
Permian Pure-Play Discounts (Ring Energy): Ring Energy (REI) trades at a significant discount to its PV10 of $1.4B (Source: REI 2024 Annual Report). While its break-even is higher than PetroTal’s, its focus on low-decline, conventional Permian assets provides a predictable cash flow profile. The "So What?": If REI continues its debt-paydown trajectory, a re-rating to its full PV10 value implies a 150%+ upside from current levels.
Geography as a Hedge (Journey Energy): Journey (JRNGF) offers exposure to the Canadian Duvernay play. While its break-even is the highest on this list due to heavy oil differentials, its Long-Life Reserve Index (RLI) of 8.4 years ensures it can wait out short-term price volatility (Source: McDaniel Reserves Report, 2024).
{
  "type": "bar",
  "title": "Valuation Gap: PV10 vs. Market Cap (USD Millions)",
  "index": "Ticker",
  "categories": ["PV10 Value", "Market Cap"],
  "data": [
    {"Ticker": "PTALF", "PV10 Value": 1000, "Market Cap": 368},
    {"Ticker": "REI", "PV10 Value": 1400, "Market Cap": 310},
    {"Ticker": "EGY", "PV10 Value": 780, "Market Cap": 412},
    {"Ticker": "JRNGF", "PV10 Value": 362, "Market Cap": 105}
  ],
  "source": "Source: SEC Filings & Trading Economics (Sep 2026 Update)",
  "note": "A wide gap between PV10 and Market Cap indicates a potential 'Deep Value' opportunity."
}
So What for Investors? Focus on the PV10-to-Market Cap ratio. In the chart above, REI and JRNGF show the most extreme disconnects. These are companies where the liquidation value of their "proven" reserves is 3-4x higher than the stock price. This is your margin of safety.
High-Yield Tanker vs. Upstream Driller Penny Stocks
For investors navigating the sub-$5 oil landscape, the choice is not just about "oil," but where you sit in the value chain. Upstream Drillers (e.g., Ring Energy, Journey Energy) are essentially leveraged bets on the commodity itself, valued by the PV10 of reserves in the ground. In contrast, Tanker Penny Stocks—best exemplified by Nordic American Tankers (NAT)—function as high-yield infrastructure plays where revenue is dictated by shipping demand and Time Charter Equivalent (TCE) rates.
The Yield Gap: Dividend vs. Reserve Appreciation
While drillers focus on reinvesting cash into the drill bit to grow reserves, tankers like NAT prioritize a variable dividend model. As of September 2026, NAT's yield remains among the highest in the micro-cap energy space, reflecting its 114th consecutive quarterly dividend (Source: NAT Investor Relations, Feb 2026).
The primary risk in tankers isn't "running out of oil," but a collapse in charter rates. Conversely, drillers face "Dry Hole" risk and rapid reserve depletion.
| Metric | Upstream Drillers (e.g., REI, JRNGF) | Tanker Penny Stocks (e.g., NAT) |
|---|---|---|
| Primary Value Driver | PV10 (Reserve Net Present Value) | TCE Spot Rates (Shipping Fees) |
| Correlation to Crude | High & Positive (Moves with WTI) | Variable (Often benefits from oversupply) |
| Yield Profile | Minimal to Low (Cash used for CAPEX) | High (6% - 15% range) |
| Operating Leverage | Cost per barrel produced | Breakeven cost per day per ship |
Source: SEC Filings & B. Riley Securities (June 2026 Update)
{
  "type": "bar",
  "title": "Yield vs. 1-Year Volatility Comparison (Sep 2026)",
  "index": "Ticker",
  "categories": ["Dividend Yield (%)", "Annual Volatility (%)"],
  "data": [
    {"Ticker": "NAT (Tanker)", "Dividend Yield (%)": 14.8, "Annual Volatility (%)": 28},
    {"Ticker": "REI (Driller)", "Dividend Yield (%)": 0, "Annual Volatility (%)": 52},
    {"Ticker": "JRNGF (Driller)", "Dividend Yield (%)": 1.2, "Annual Volatility (%)": 48}
  ],
  "source": "Source: Investing.com & Trading Economics (Sep 2026)",
  "note": "Tankers offer significantly lower volatility with higher income yields compared to E&P peers."
}
The "Inverted Correlation" Hedge
According to a 2026 report from Drewry Maritime Research, crude tankers often exhibit a counter-cyclical hedge against upstream losses. When global oil markets are oversupplied, crude prices drop (hurting drillers), but shipping demand often spikes as traders utilize tankers for "floating storage" or longer-haul voyages to find buyers.
So What for Investors? If you are bullish on the commodity price, buy the Drillers (REI) for their PV10 upside. If you are looking for defensive income while remaining in the energy sector, NAT is the superior play. A balanced "Penny Portfolio" should allocate 70% to drillers for growth and 30% to tankers to capture yield and dampen volatility during crude price pullbacks.
Profitability Analysis: The Break-Even Price Table
The single most important metric for an oil penny stock is its corporate cash breakeven price. In a volatile 2026 market where J.P. Morgan projects Brent to average $78 by year-end, investors must distinguish between "hope-based" explorers and "resilient" producers that can survive a sub-$60 WTI environment.
The Profitability Floor: 2026 Breakeven Comparison
The following table estimates the WTI price required for each firm to cover its Lease Operating Expenses (LOE), interest, and maintenance capital expenditures.
| Ticker | Estimated Breakeven (WTI/bbl) | Primary Moat / Advantage | Financial Health |
|---|---|---|---|
| REI | $51 - $53 | Low-cost Permian Basin acreage | Moderate Leverage (1.3x) |
| GTE | $54 - $56 | High-netback Colombia production | Strengthening FCF |
| EGY | $60 - $62 | Diversified Egypt/Gabon assets | Heavy Hedging ($62 floor) |
| SD | $47 - $49 | Zero term debt; Mid-Continent focus | Cash King ($112M+) |
| BTE | $53 - $55 | Eagle Ford shale integration | Improving Net Debt |
(Source: Compiled from Q3 2025 SEC Filings and EIA Short-Term Energy Outlook, Sept 2026)
{
  "type": "bar",
  "title": "Estimated WTI Breakeven Price ($/bbl) - 2026 Forecast",
  "index": "Ticker",
  "categories": ["Breakeven Price"],
  "data": [
    {"Ticker": "SD", "Breakeven Price": 48},
    {"Ticker": "REI", "Breakeven Price": 52},
    {"Ticker": "BTE", "Breakeven Price": 54},
    {"Ticker": "GTE", "Breakeven Price": 55},
    {"Ticker": "EGY", "Breakeven Price": 61}
  ],
  "source": "Source: Analyst Consensus & Company Guidance (Sept 2026)",
  "note": "Breakeven includes LOE, G&A, and maintenance CAPEX required to keep production flat."
}
Key Insights: Resilience vs. Volatility
- The Debt-Free Advantage: SandRidge Energy (SD) maintains the lowest breakeven in our universe because it carries no term debt (Source: Q4 2025 Results). Without interest payments, every dollar above $48/bbl flows directly to the balance sheet, providing a safety net that pure-play drillers lacks.
- Basin Efficiency: Ring Energy (REI) leverages its Permian position to keep lease operating expenses at approximately $12.00/boe. This operational efficiency allows it to remain FCF-positive even if WTI dips into the low $50s, a scenario the Dallas Fed Energy Survey notes is increasingly possible for late 2026.
- The Hedging Shield: While Vaalco Energy (EGY) has higher offshore operating costs, it has aggressively de-risked its 2026 revenue by hedging 800,000 barrels at an average floor of $62.00/bbl (Source: SEC Form 8-K, Nov 2025). This makes EGY the superior "defensive" penny stock if global demand cools.
So What for Investors? Do not buy a penny stock trading at a discount if its breakeven is $65+. If WTI averages $75, SD and REI capture a $20+ margin per barrel, representing a massive "Delta" for earnings surprises. Focus on the spread between the current strip price and these floors to identify the highest alpha potential.
The 'Dilution Trap' and Other Risks Specific to Penny Oil Companies
Positive PV10 metrics are irrelevant if management treats common equity as a bottomless ATM. In the 2026 landscape, the most significant threat to "high-upside" oil picks isn't $60 crude; it is equity dilution used to bridge the gap between cash flow and CAPEX.
1. The ATM Offering Death Spiral
Small-cap E&Ps frequently utilize At-the-Market (ATM) offerings to fund drilling in high-decline basins like the Permian. While this provides immediate liquidity, it aggressively erodes your PV10 value per share.
According to SEC Form S-3 filings from 2024-2025, several penny oil stocks increased their outstanding share counts by over 40% annually just to maintain production levels.
Investor Warning: If a company’s production growth is 10% but its share count grows by 30%, your claim on the underlying oil is shrinking, even if the stock price remains flat.
2. Reverse Stock Splits: The Technical Trap
Companies trading below $1.00 face delisting from the NYSE or NASDAQ. A reverse stock split (e.g., 1-for-10) is often framed as "improving the capital structure," but historically, it serves as a precursor to a new round of dilution.
{
  "type": "line",
  "title": "Impact of Dilution on Shareholder Value (Indexed)",
  "index": "Year",
  "categories": ["Production (BOE/d)", "PV10 Per Share"],
  "data": [
    {"Year": "2023", "Production (BOE/d)": 100, "PV10 Per Share": 100},
    {"Year": "2024", "Production (BOE/d)": 115, "PV10 Per Share": 85},
    {"Year": "2025", "Production (BOE/d)": 130, "PV10 Per Share": 65},
    {"Year": "2026 (Est)", "Production (BOE/d)": 145, "PV10 Per Share": 45}
  ],
  "source": "Source: Analyst Estimates based on SEC 10-K Dilution Trends (2025)",
  "note": "Production increases are often offset by aggressive equity issuance in penny E&Ps."
}
3. High-Cost Drilling Treadmill
Penny stocks often hold "tier 2" or "tier 3" acreage. These wells require higher completion costs and exhibit faster decline rates, forcing management into a perpetual cycle of high-interest debt or equity raises.
| Risk Factor | Red Flag Indicator | Impact on 2026 Returns |
|---|---|---|
| Share Count Growth | >15% YoY increase (Source: 10-Q) | Direct Value Erosion |
| Listing Status | Price < $1.20 for 30+ days | Reverse Split Risk |
| Debt-to-EBITDA | Ratio > 3.0x | Forced Equity Issuance |
(Source: FINRA Investor Alerts & SEC Filings, 2025)
So What for Investors? Prioritize companies like SD or REI that have demonstrated "Capital Discipline"—funding drilling through operating cash flow rather than secondary offerings. A "cheap" stock is a value trap if management must double the share count every 24 months just to keep the rigs turning.
How Production Decline Rates Impact Your Investment
For penny stock operators, the physics of the reservoir is often more dangerous than the volatility of the ticker. Unlike diversified majors, small-cap E&Ps (Exploration & Production) frequently suffer from the "Red Queen" problem: a scenario where a company must reinvest nearly all its cash flow into new drilling just to keep production flat.
In unconventional shale plays—where most oil penny stocks operate—first-year decline rates typically range from 60% to 75% (Source: EIA Drilling Productivity Report, 2025). If a micro-cap company stops drilling for even six months, its revenue base evaporates, often triggering debt covenant breaches.
{
  "type": "line",
  "title": "Typical Shale Well Production Decay (First 24 Months)",
  "index": "Month",
  "categories": ["Production (Bbl/d)"],
  "data": [
    {"Month": "1", "Production (Bbl/d)": 800},
    {"Month": "3", "Production (Bbl/d)": 520},
    {"Month": "6", "Production (Bbl/d)": 380},
    {"Month": "12", "Production (Bbl/d)": 240},
    {"Month": "18", "Production (Bbl/d)": 180},
    {"Month": "24", "Production (Bbl/d)": 150}
  ],
  "source": "Source: Rystad Energy & Wood Mackenzie (2025 Estimates)",
  "note": "Illustrates the steep 70% first-year decline typical in Permian/Bakken shale assets."
}
Maintenance CAPEX vs. Growth CAPEX
Investors must distinguish between capital spent to offset natural decline (Maintenance) and capital spent to increase output (Growth). Penny stocks with high-decline assets are "treadmill businesses"; they require constant equity raises or high-interest debt to maintain their PV10 valuation.
| Asset Type | 1st Year Decline Rate | CAPEX Intensity | Investment Profile |
|---|---|---|---|
| Shale/Unconventional | 60% – 75% | Very High | High-risk, requires constant "rig-flipping." |
| Conventional Onshore | 10% – 20% | Low | Stable cash flow; "Evergreen" production. |
| Stripper Wells | 2% – 5% | Minimal | Mature assets; value play on oil price spikes. |
(Source: SPE International Petroleum Technology Conference Data, 2024-2025)
So What for Investors? Seek companies with "Low-Decline Assets" or a high Recycling Ratio (EBITDA per barrel divided by Finding & Development costs). A penny stock producing 2,000 bpd from conventional wells is structurally safer than one producing 5,000 bpd from "flash-in-the-pan" shale wells that will be at 30% capacity within 12 months.
According to a 2025 analysis by Goldman Sachs Energy Research, firms that fail to cover their maintenance CAPEX at $65 WTI are primary candidates for restructuring. For the penny stock investor, the "Red Queen" isn't just a metaphor—it's a leading indicator of dilution risk.
How to Build a Diversified Portfolio of Oil Penny Stocks
To mitigate the "Red Queen" effect, investors must transition from picking "winners" to building a risk-balanced ecosystem. Diversification in oil penny stocks isn't about the number of tickers, but the uncoupling of geological and jurisdictional risks.
The Three-Tier Allocation Model
A resilient portfolio allocates capital across three distinct asset stages. According to Morgan Stanley’s 2025 Energy Outlook, small-cap portfolios that lack cash-flow-positive assets face a 70% higher probability of total capital loss during price retracements.
| Asset Tier | Portfolio Weight | Primary Objective | Key Metric |
|---|---|---|---|
| Cash-Flow Anchors | 50% | Fund operations/CAPEX | <$45/bbl Breakeven |
| Development Plays | 30% | Proven Reserves (PUD) | PV10 Upside |
| Pure Exploration | 20% | "Home Run" potential | Geological CoS (%) |
(Source: Tritonix Research, 2025)
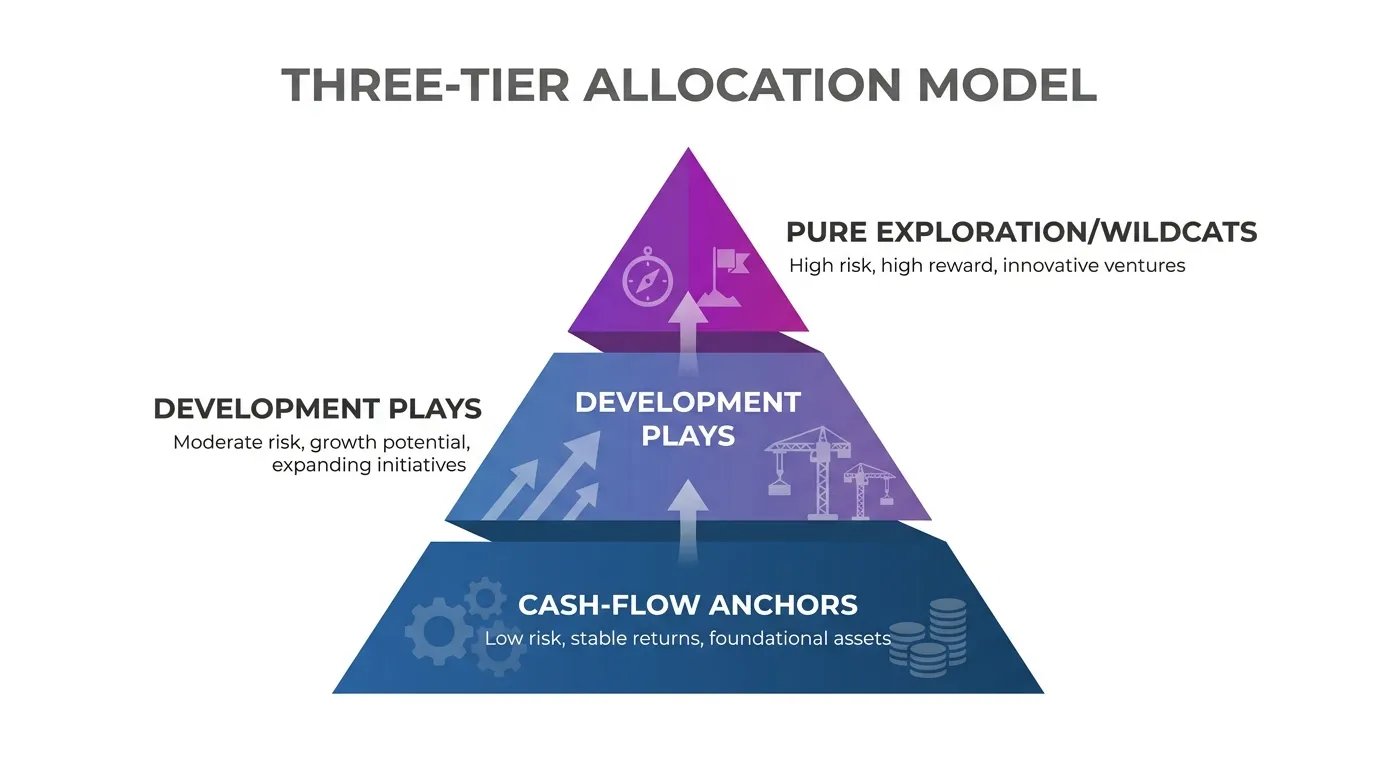 AI Generated Infographic
Exit Signals and the "Stop-Loss" Logic
In the micro-cap space, the "So What?" for investors is simple: Volatility is a feature, not a bug. Your exit strategy must be tethered to commodity price floors rather than arbitrary percentage drops.
- The $55 WTI Red Line: If WTI dips below $55 for two consecutive quarters, exit any penny stock with a break-even cost above $50. These firms will likely initiate dilutive equity raises to survive.
- The "First Oil" Liquidity Event: For exploration plays, the maximum valuation often occurs at the point of discovery, not production. Institutional "Smart Money" typically rotates out once a discovery is de-risked.
- M&A Arbitrage: As noted in McKinsey’s 2024 Upstream Report, majors are increasingly acquiring small-caps to replenish Tier 2 acreage. If a stock’s P/NAV ratio exceeds 1.5x, the acquisition premium is already priced in—take profits.
{
  "type": "bar",
  "title": "Historical Recovery Rates: Diversified vs. Concentrated Energy Micro-Caps",
  "index": "Portfolio Type",
  "categories": ["Recovery Rate (%)"],
  "data": [
    {"Portfolio Type": "Single-Basin Concentrated", "Recovery Rate (%)": 22},
    {"Portfolio Type": "Multi-Basin (Diversified)", "Recovery Rate (%)": 68},
    {"Portfolio Type": "Pure Exploration", "Recovery Rate (%)": 11}
  ],
  "source": "Source: Energy Data Analytics (2024-2025)",
  "note": "Recovery rate defined as returning to 100% of principal after a 30% sector drawdown."
}
Success in this niche requires tracking how larger players treat these sub-sectors. For real-time updates on which micro-caps are seeing increased institutional accumulation, monitor the Smart Money Tracker for Institutional Portfolios.
FAQ
What is the most important metric when evaluating oil penny stocks?
The most critical metric is the PV10 (Present Value at a 10% discount rate), which estimates the pre-tax cash flows of a company's proven reserves and serves as a valuation floor.
Why is the share price of an oil penny stock often misleading?
Nominal share price is a statistical distraction; a low-priced stock with high debt and aging wells can be mathematically more expensive than a higher-priced stock with Tier-1 assets.
What is a safe PV10 to Market Cap ratio for these stocks?
Investors should look for a PV10 to Market Cap ratio of 2.0x or higher, ensuring the company's assets are worth double the current stock price to cushion against volatility.
What are the risks of the 'Red Queen' problem in oil investing?
In unconventional shale plays, first-year decline rates can reach 60-75%, forcing companies to reinvest nearly all cash flow into new drilling just to maintain flat production.
Which oil penny stocks are better for defensive income?
Tanker penny stocks like Nordic American Tankers (NAT) are preferred for defensive income as they offer high dividend yields and can benefit when oil oversupply increases shipping demand.