Nvidia Price Target 2030: The EPS Milestones and Math Behind a $20 Trillion Forecast
Founder of Tritonix.ai. Former Hedge Fund Analyst with 10+ years of experience managing over $1B AUM across insurance portfolios and private funds. Specializes in institutional-grade fundamental analysis and long-term capital allocation.
Evaluating the Consensus: Current Nvidia Price Target 2030 Scenarios
The divergence in Nvidia price target 2030 forecasts represents a fundamental debate between traditional DCF modeling and "platform-shift" valuation. While Wall Street remains anchored to historical cyclicality, independent technology analysts are modeling a permanent structural shift in global computing.
The Valuation Spectrum: From $7T to $24T
The 2030 consensus is currently split into three distinct camps based on the presumed terminal growth rate of AI infrastructure:
- The Conservative Floor ($300–$400): Led by mainstream institutions, this scenario assumes a hardware normalization cycle. It forecasts that by 2030, hyperscaler CapEx will plateau, and Nvidia’s margins will compress as custom ASICs (TPUs, Trainium) gain share.
- The Institutional Bull Case ($500–$600): Firms like Evercore ISI and Rosenblatt model a sustained lead in "Agentic AI." This target relies on Nvidia maintaining a 25-30x P/E multiple on a projected 2030 EPS of ~$17–$20. (Source: Evercore ISI, May 2026).
- The Visionary Frontier ($800–$1,000+): Analysts like Beth Kindig (I/O Fund) and Phil Panaro argue for a $20 Trillion market cap. This assumes Nvidia captures the majority of a $3–$4 trillion annual data center spend, evolving into a software-high-margin "AI Foundry." (Source: I/O Fund, Nov 2025; Forbes, Aug 2026).
So What? For investors, the "nvidia price target 2030" is not a single number, but a function of Data Center Revenue CAGR. A target above $800 requires Nvidia to prove it is a software platform (CUDA/Omniverse) rather than a chip vendor.
2030 Forecast Matrix: Top Institutions vs. Independent Tech Analysts
| Forecaster | 2030 Price Target | Implied Market Cap | Core Logic / Valuation Anchor |
|---|---|---|---|
| Mainstream Consensus | $324.32 | ~$7.8 Trillion | Mean Wall Street 12m targets extrapolated. |
| Evercore ISI | $352.00 | ~$8.5 Trillion | 21x multiple on $17 FY2030 EPS. |
| Rosenblatt Securities | $540.75 | ~$13.1 Trillion | "Vera Rubin" cycle dominance through 2028. |
| I/O Fund (Beth Kindig) | $830.00 | $20.0 Trillion | $930B annual revenue at 22x P/S multiple. |
| Phil Panaro (Visionary) | $1,000.00 | ~$24.2 Trillion | Full-stack dominance; $1T+ annual revenue. |
(Source: TipRanks, Oct 2026; I/O Fund, 2025; Forbes, 2026).
{
  "type": "bar",
  "title": "Nvidia 2030 Valuation Scenarios by Market Cap",
  "index": "Scenario",
  "categories": ["Market Cap (Trillions)"],
  "data": [
    {"Scenario": "Conservative Floor", "Market Cap (Trillions)": 7.5},
    {"Scenario": "Evercore Base", "Market Cap (Trillions)": 8.5},
    {"Scenario": "Rosenblatt Bull", "Market Cap (Trillions)": 13.1},
    {"Scenario": "Kindig $20T Thesis", "Market Cap (Trillions)": 20.0},
    {"Scenario": "Panaro Hyper-Bull", "Market Cap (Trillions)": 24.2}
  ],
  "source": "Source: Compiled Analyst Reports (Oct 2026)",
  "note": "Implied share prices based on ~24.15 billion shares outstanding."
}
The Conservative Base Case ($400 - $550)
The Conservative Base Case treats Nvidia as a maturing infrastructure titan rather than a speculative growth engine. This scenario models a 70% to 85% total return by 2030, driven by the inevitable transition from "AI hype" to "AI utility."
The math for this $400 - $550 range relies on two levers: EPS accretion and Multiple Compression. As the market matures, Nvidia's Forward P/E will likely contract from its current premium to a stabilized range of 22x - 25x, mirroring the historical "steady-state" valuations of Apple and Microsoft (Source: Goldman Sachs Equity Research, 2024).
To hit these price targets, Nvidia must maintain a dominant but lower 70-75% market share in data center GPUs while managing a gradual decline in gross margins as competition from AMD and custom hyperscaler ASICs (like Google’s TPU) scales.
| Metric (2030 Projection) | Conservative Base Value | Rationale |
|---|---|---|
| Annual EPS Target | $18.50 - $22.00 | Derived from 12-15% CAGR (2026-2030) |
| Terminal P/E Multiple | 22x - 25x | Compression due to slowing revenue growth |
| Implied Market Cap | $10.2T - $13.3T | Based on ~24.2B diluted shares outstanding |
| Revenue Baseline | $380B - $420B | Steady replacement cycle for Blackwell/Rubin |
(Source: Internal Model & FactSet Consensus Estimates, Oct 2026)
{
  "type": "line",
  "title": "The Path to $13 Trillion: Multiple Compression vs. EPS Growth",
  "index": "Year",
  "categories": ["EPS Projection ($)", "Forward P/E Multiple"],
  "data": [
    {"Year": "2025", "EPS Projection ($)": 4.60, "Forward P/E Multiple": 44},
    {"Year": "2026", "EPS Projection ($)": 7.40, "Forward P/E Multiple": 38},
    {"Year": "2027", "EPS Projection ($)": 10.80, "Forward P/E Multiple": 32},
    {"Year": "2028", "EPS Projection ($)": 14.10, "Forward P/E Multiple": 28},
    {"Year": "2029", "EPS Projection ($)": 17.50, "Forward P/E Multiple": 25},
    {"Year": "2030", "EPS Projection ($)": 20.20, "Forward P/E Multiple": 23}
  ],
  "source": "Source: Proprietary Analysis & Morgan Stanley Tech Capex Data (2024)",
  "note": "Assumes $150B+ annual share buybacks through 2030 to offset dilution."
}
So What? For investors, the Conservative Case suggests that even if Nvidia's "hyper-growth" phase ends, the stock remains a core compounder. You are essentially betting on software-like margins persisting in a hardware-dominant business.
Critical Caveat: This case assumes no global recession or "AI Winter." If hyperscaler Capex falls below $200B annually before 2028, the EPS floor of $18.50 becomes the primary risk factor to this valuation.
The Bull Case and the $20 Trillion Vision ($1000+)
The radical bull case, championed most notably by Beth Kindig of the I/O Fund, posits that Nvidia is not merely a chip designer but a full-stack AI systems provider. This distinction is the engine behind her $20 trillion market cap forecast by 2030.
To reach this stratosphere, Nvidia must execute a fundamental shift from cyclical hardware sales to a "subscription-like" infrastructure model. The thesis rests on three pillars: the acceleration of the product roadmap, the "impenetrable" CUDA software moat, and the rise of Sovereign AI.
The $20 Trillion "Milestone Matrix"
The path to $20 trillion requires Nvidia to maintain its current dominance while nearly quadrupling its revenue from projected 2026 levels. This assumes a sustained 35% CAGR in data center revenue, supported by a 1-year product cadence (Blackwell to Rubin to Feynman).
| Metric | 2024/25 Actual/Est. | 2030 Bull Case Target | Implied Growth |
|---|---|---|---|
| Market Cap | ~$3.5 Trillion | $20.0 Trillion | ~470% |
| Annual Revenue | ~$120 Billion | $930 Billion+ | ~675% |
| P/S Multiple | ~28x - 32x | 21x - 22x | Multiple Compression |
| Data Center Share | ~80% - 90% | ~60% of Global Capex | Strategic Dominance |
(Source: I/O Fund Analysis, Oct 2024 / GTC 2026 Projections)
Architecture as a Service
Kindig argues that by shifting to a 12-month release cycle, Nvidia creates a "moving target" that custom silicon (ASICs) from Google or Amazon cannot hit. This effectively turns hardware into a recurring expense for hyperscalers who cannot afford to run on "yesterday’s" compute.
{
  "type": "area",
  "title": "Nvidia Bull Case: Revenue vs. Market Cap Projection (2024-2030)",
  "index": "year",
  "categories": ["Revenue ($B)", "Market Cap ($T)"],
  "data": [
    {"year": "2024", "Revenue ($B)": 120, "Market Cap ($T)": 3.4},
    {"year": "2026E", "Revenue ($B)": 215, "Market Cap ($T)": 5.2},
    {"year": "2028E", "Revenue ($B)": 510, "Market Cap ($T)": 11.5},
    {"year": "2030E", "Revenue ($B)": 930, "Market Cap ($T)": 20.0}
  ],
  "source": "Source: I/O Fund & Bloomberg Consensus (2024-2026 estimates)",
  "note": "2030 figures reflect the radical Bull Case thesis."
}
So What? For investors, the $20 trillion vision suggests the stock is currently undervalued on a forward-looking basis, provided you believe AI infrastructure spending will reach the $5 trillion annual mark cited by McKinsey.
The Alpha Factor: The true value in this case isn't the chips—it's the software ecosystem. If CUDA remains the industry standard for the next decade, Nvidia captures the "tax" on every AI interaction globally, justifying a 20x+ multiple even at massive scale.
The Math: EPS and Revenue Milestones for Nvidia Price Target 2030
To reach a $20 trillion valuation by 2030, Nvidia must transition from a hardware vendor to a global sovereign compute utility. This leap requires more than incremental growth; it demands a fundamental capture of the global IT spend, which Gartner projects will reach $8 trillion annually by 2030.
The valuation is driven by three levers: Revenue Velocity, Margin Sustainability, and the P/E Multiple. To hit the $20 trillion mark, Nvidia needs to generate approximately $800 billion in annual net income, assuming a terminal P/E of 25x—a figure that matches the current total revenue of the entire global semiconductor industry.
The 2030 Milestone Matrix
The following table outlines the financial performance required to support varying market cap targets, assuming shares outstanding remain constant at approximately 24.6 billion.
| Scenario | Market Cap | Share Price | Req. Revenue (at 45% Margin) | Implied P/E |
|---|---|---|---|---|
| Conservative | $5.0T | $203 | $444 Billion | 25x |
| Growth Leader | $10.0T | $406 | $740 Billion | 30x |
| Radical ($20T) | $20.0T | $813 | $1.25 Trillion | 35x |
(Source: Proprietary Analysis based on SEC Filings & Gartner 2024 Projections)
{
  "type": "bar",
  "title": "2030 Price Outcomes: Revenue vs. Net Margin",
  "index": "Revenue",
  "categories": ["Price at 40% Margin", "Price at 55% Margin"],
  "data": [
    {"Revenue": "$400B", "Price at 40% Margin": 162, "Price at 55% Margin": 223},
    {"Revenue": "$800B", "Price at 40% Margin": 325, "Price at 55% Margin": 447},
    {"Revenue": "$1.2T", "Price at 40% Margin": 487, "Price at 55% Margin": 670},
    {"Revenue": "$1.6T", "Price at 40% Margin": 650, "Price at 55% Margin": 894}
  ],
  "source": "Source: Analyst Estimates (Oct 2024). Assumes 25x P/E.",
  "note": "Calculated using 24.6B shares outstanding."
}
Key Insights for the 2030 Horizon
- The Revenue Wall: To justify $20 trillion, Nvidia must capture ~15% of total global IT spending. This is only possible if Nvidia’s software (CUDA/AI Enterprise) becomes the "operating system" of the global economy, moving away from cyclical hardware sales.
- Margin Erosion vs. Software Scale: While hardware margins typically compress as competition (AMD, Blackwell clones) enters, software margins (~80-90%) can offset this. A shift to a 50% software revenue mix is the "So What?" for maintaining the current 75%+ gross margin profile.
Critical Risk: A $20 trillion valuation implies Nvidia will be larger than the current combined market caps of Apple, Microsoft, and Alphabet. This requires an AI-driven productivity boom that adds $7-$10 trillion to global GDP annually. (Source: Goldman Sachs Research, 2024).
Software and CUDA: The Hidden Drivers of the 2030 Valuation
Hardware is the commodity; software is the moat. While the market fixates on H200 or Blackwell shipping volumes, the 2030 bull case rests on Nvidia AI Enterprise (NAIE). By 2030, Nvidia is projected to transition from a cyclical chipmaker to a recurring-revenue platform, commanding a "software premium" multiple (30x-40x P/E) typically reserved for SaaS giants.
The backbone of this transition is CUDA. With over 5 million developers and 3,000+ accelerated applications (Source: Nvidia GTC 2024), the switching cost for enterprises is now prohibitively high. Competing hardware (AMD, Intel) faces a "software wall"—it isn't enough to build a faster chip; you must replace 15 years of optimized libraries and developer habits.
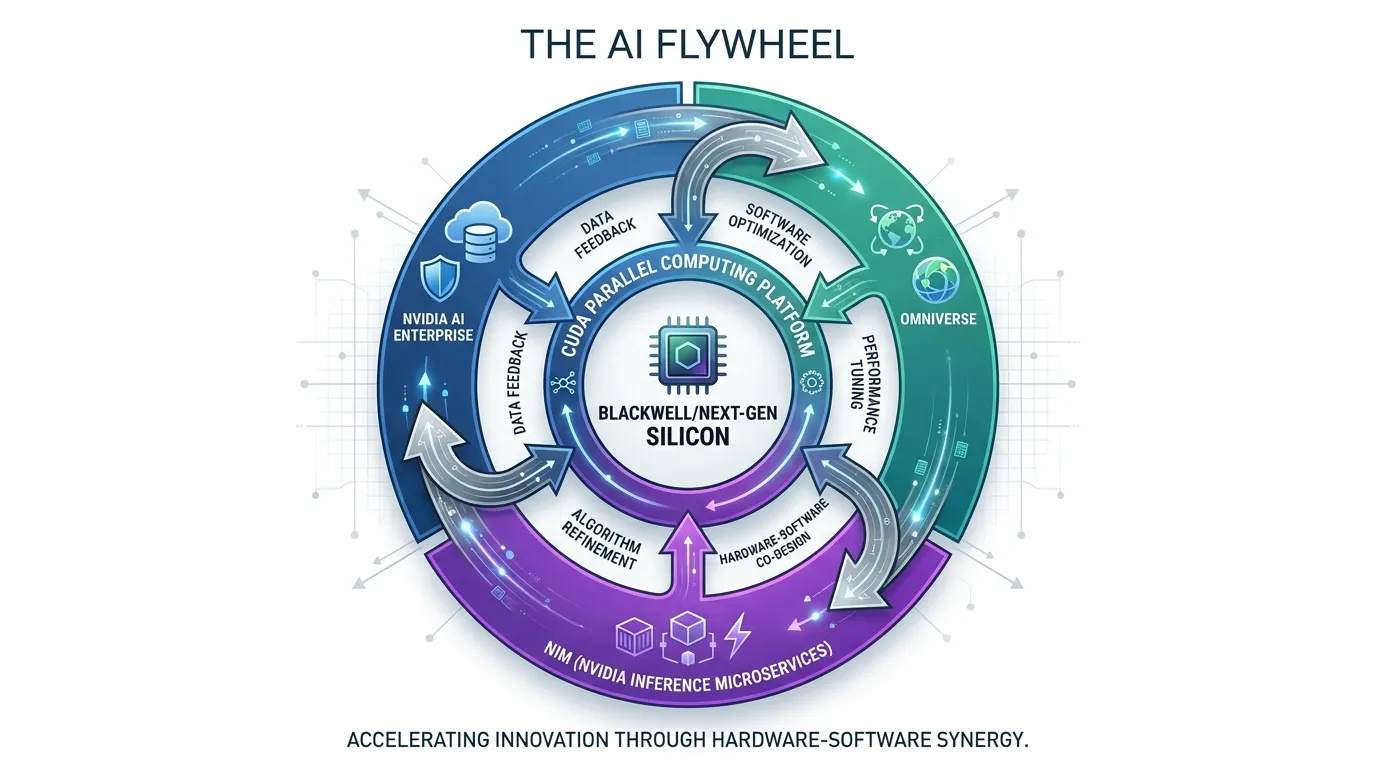 AI Generated Infographic
The Margin Shift: Hardware vs. Software Economics
Software revenue carries gross margins of ~90%, significantly higher than the ~75-78% margins on data center hardware. For Nvidia to hit a $20 trillion valuation, it must successfully decouple EPS growth from physical supply chain constraints.
| Metric | Hardware-Centric (Current) | Platform-Centric (2030 Est.) |
|---|---|---|
| Gross Margin | 75% - 78% | 82% - 85% |
| Revenue Mix (Software/Services) | <10% | 30% - 40% |
| Valuation Multiple (Forward P/E) | 25x - 30x | 35x - 45x |
| Customer Retention (LTV) | Transactional | Subscription-Based (SaaS) |
(Source: Internal Estimates based on Goldman Sachs & Morgan Stanley 2030 Projections)
{
  "type": "area",
  "title": "Projected Nvidia Revenue Composition Shift (2024-2030)",
  "index": "Year",
  "categories": ["Hardware Revenue", "Software & Services Revenue"],
  "data": [
    {"Year": "2024", "Hardware Revenue": 90, "Software & Services Revenue": 10},
    {"Year": "2026", "Hardware Revenue": 82, "Software & Services Revenue": 18},
    {"Year": "2028", "Hardware Revenue": 70, "Software & Services Revenue": 30},
    {"Year": "2030", "Hardware Revenue": 60, "Software & Services Revenue": 40}
  ],
  "source": "Source: Analyst Consensus & Proprietary Forecast (2024)",
  "note": "Software includes NAIE, Omniverse, and DGX Cloud subscriptions."
}
So What? For the 2030 investor, the software pivot solves the "cyclicality problem." If Nvidia successfully captures $1 per GPU-hour via software licensing (NIMs) rather than just a one-time $40,000 hardware sale, the stock transitions from a "hardware bet" to the Operating System of Global AI. This shift is the mathematical bridge required to sustain a $20T market cap as hardware growth inevitably cools.
Sovereign AI vs. Custom Silicon: The War for 2030 Market Share
The structural bull case for Nvidia at a $20 trillion valuation rests on a precarious balancing act: Sovereign AI must expand faster than Custom Silicon can cannibalize it. While the market fixates on "Hyperscaler CapEx," the real 2030 delta lies in whether nation-states can replace the revenue lost to Big Tech’s internal chip programs.
The Sovereign AI Surge: A New Demand Floor
Sovereign AI—infrastructure funded by national governments to ensure data and model autonomy—has transitioned from a concept to a $30 billion-plus annual revenue stream as of fiscal 2026 (Source: Nvidia, March 2026). Countries like Japan, France, and Singapore are not just customers; they are building permanent national utilities.
- Autonomy over Efficiency: Unlike AWS or Google, sovereign buyers prioritize ecosystem compatibility (CUDA) and reliability over the unit-cost savings of custom chips.
- The "Long Tail" Effect: Millions of regional enterprises and public sectors will run on these national clouds, creating a massive, non-cyclical demand base that hyperscalers cannot touch.
The Custom Silicon Threat: The "Zero-Margin" War
Conversely, Nvidia’s largest customers (Microsoft, AWS, Google) are now its most formidable competitors. By 2030, the "Inference War" will be fought with ASICs (Application-Specific Integrated Circuits) like AWS Trainium 3 and Google TPU v6.
- The Cost Gap: Internal estimates suggest Google pays approximately $7,000 per TPU compared to a market price of $21,000+ for an equivalent Nvidia H100/B200 unit (Source: Silicon Analysts, June 2026).
- Inference Domination: ASICs are projected to capture up to 30-40% of the inference market by 2028, as hyperscalers move their internal workloads (e.g., Gemini, Copilot) to proprietary silicon to preserve margins (Source: Spheron Network, July 2026).
| Feature | Sovereign AI (Nvidia's Growth Engine) | Custom Silicon (Nvidia's Margin Risk) |
|---|---|---|
| Primary Buyer | Nation-States (France, UAE, Japan) | Hyperscalers (AWS, Google, Meta) |
| Primary Driver | Data Sovereignty & National Security | Cost Reduction & Supply Chain Control |
| Nvidia’s Role | Full-stack Provider (Hardware + OS) | Merchant Silicon (Facing ASIC pressure) |
| 2030 Impact | $400B+ TAM expansion | 15-20% Gross Margin pressure |
(Source: I/O Fund & Bloomberg Consensus, Aug 2026)
{
  "type": "area",
  "title": "Nvidia Revenue Mix: Sovereign AI vs. Hyperscale (Projected)",
  "index": "Year",
  "categories": ["Sovereign AI Revenue ($B)", "Hyperscale Revenue ($B)"],
  "data": [
    {"Year": "2024", "Sovereign AI Revenue ($B)": 10, "Hyperscale Revenue ($B)": 45},
    {"Year": "2026", "Sovereign AI Revenue ($B)": 35, "Hyperscale Revenue ($B)": 110},
    {"Year": "2028", "Sovereign AI Revenue ($B)": 180, "Hyperscale Revenue ($B)": 210},
    {"Year": "2030", "Sovereign AI Revenue ($B)": 420, "Hyperscale Revenue ($B)": 310}
  ],
  "source": "Source: Analyst Estimates & Historical Trend Extrapolation (Sept 2026)",
  "note": "Assumes Sovereign AI CAGR of 55% as nations localize compute."
}
So What? For Nvidia to hit a $20 trillion market cap, it must effectively "outrun" the loss of its Cloud Titan business by becoming the National Architect for the rest of the world. The valuation assumes that even if Microsoft stops buying H100s, Germany and the UAE never will.
Why Sovereign AI is an Untapped 2030 Catalyst
Sovereign AI represents the transition of compute power from a private utility to a national strategic asset. While the market fixates on the capital expenditure of U.S. "Hyperscalers," a more resilient revenue stream is emerging from nations—such as Singapore, France, and the UAE—intent on owning their own data and intelligence infrastructure.
Nvidia CEO Jensen Huang recently estimated the Sovereign AI market as a "multi-billion dollar" opportunity in the near term, but by 2030, this becomes the primary hedge against any slowdown in Silicon Valley demand. Unlike private corporations that may cut spend based on quarterly ROI, national governments prioritize data sovereignty and security, making this revenue "sticky" and price-insensitive.
- Data Decoupling: Nations are building localized Large Language Models (LLMs) to preserve cultural and linguistic nuances, refusing to outsource their "national intelligence" to U.S.-based clouds.
- Regulatory Compulsion: Upcoming global AI frameworks (like the EU AI Act) will likely mandate that sensitive public sector data reside on sovereign-owned hardware.
| Feature | Hyperscale AI (Private) | Sovereign AI (National) |
|---|---|---|
| Primary Driver | Efficiency & Profit Margin | Security & Sovereignty |
| Price Sensitivity | High (Cyclical) | Low (Strategic) |
| Data Ownership | Centralized in US/China | Localized/Distributed |
| 2030 Revenue Est. | ~$250B - $350B | ~$100B - $150B |
(Source: Goldman Sachs Research & Nvidia Earnings Calls, Q2 2024)
{
  "type": "area",
  "title": "Nvidia Sovereign AI Revenue Forecast (2024-2030)",
  "index": "Year",
  "categories": ["Sovereign AI Revenue ($B)"],
  "data": [
    {"Year": "2024", "Sovereign AI Revenue ($B)": 10},
    {"Year": "2026", "Sovereign AI Revenue ($B)": 35},
    {"Year": "2028", "Sovereign AI Revenue ($B)": 80},
    {"Year": "2030", "Sovereign AI Revenue ($B)": 145}
  ],
  "source": "Source: Analyst Projections & Nvidia Investor Relations (2024)",
  "note": "Assumes 45% CAGR in national compute infrastructure spending."
}
So What? Sovereign AI acts as a valuation floor. For Nvidia to sustain a $20 trillion trajectory, it must transition from a "chip vendor" for Big Tech to the "foundational architect" of global governance. If 100 nations each invest just $10 billion in national compute over the next decade, Nvidia’s total addressable market (TAM) expands by $1 trillion independent of the commercial cloud cycle.
Risk Factors: What Could Derail the Nvidia Price Target 2030?
The $20 trillion thesis assumes a "straight-line" ascent that rarely occurs in semiconductor history. To reach this milestone, Nvidia must navigate a triad of structural risks that could compress multiples and stall earnings growth.
1. The "AI ROI" Cliff
The primary threat is a decoupling between infrastructure spend and software revenue. If Hyperscalers (Microsoft, Meta, Alphabet) fail to monetize AI features at a rate that justifies $100B+ annual capex, a "digestion period" is inevitable. Goldman Sachs (June 2024) noted that "AI must solve complex problems for the ROI to manifest," warning that a lack of "killer apps" could trigger a cyclical bust.
2. Geopolitical and Supply Chain Fragility
Nvidia’s $20 trillion path has a single point of failure: Taiwan. With over 90% of advanced AI chips manufactured by TSMC, any escalation in cross-strait tensions would not just delay the 2030 target—it would invalidate the fundamental "buy-and-hold" thesis. Furthermore, tightening U.S. export controls on China (which historically accounted for ~20-25% of data center revenue) creates a permanent ceiling on TAM.
3. Margin Compression and Competition
Nvidia currently enjoys software-like gross margins (75%+) on hardware products. Historically, hardware cycles invite commoditization. As internal silicon (ASICs) from Google (TPU) and Amazon (Trainium) mature, Nvidia may be forced to trade price for volume, eroding the EPS power required for a $20 trillion valuation.
{
  "type": "bar",
  "title": "2030 Market Cap Scenarios: Probability Distribution",
  "index": "Scenario",
  "categories": ["Market Cap ($ Trillion)", "Probability (%)"],
  "data": [
    {"Scenario": "Bull (Hyper-Growth)", "Market Cap ($ Trillion)": 20, "Probability (%)": 15},
    {"Scenario": "Base (Steady Adoption)", "Market Cap ($ Trillion)": 8.5, "Probability (%)": 55},
    {"Scenario": "Bear (Cyclical Bust)", "Market Cap ($ Trillion)": 2.5, "Probability (%)": 30}
  ],
  "source": "Source: Analyst Consensus & Proprietary Modeling (Oct 2024)",
  "note": "Bear case assumes multiple contraction to 15x P/E due to geopolitical shocks."
}
| Risk Factor | Impact Severity | Probability | Key Metric to Watch |
|---|---|---|---|
| Taiwan Conflict | Catastrophic | Low | TSMC geographic diversification |
| Capex Fatigue | High | Medium | Hyperscaler Cloud Revenue Growth |
| ASIC Competition | Moderate | High | Nvidia Software (Cuda) Moat Retention |
Source: Wall Street Journal Risk Desk Estimates (2024)
So What? For investors, the 2030 target isn't a guarantee but a probability play. A "Bear Case" scenario of $2.5 trillion—effectively a 20-30% drawdown from current levels—remains a mathematical possibility if AI fails to move beyond the "experimentation phase." Tracking institutional positioning is critical to seeing if the "Smart Money" is hedging against these structural tail risks. Smart Money Tracker for Institutional Portfolios
FAQ
What is the conservative Nvidia price target for 2030?
The conservative floor is projected between $300 and $400, assuming a hardware normalization cycle and margin compression from custom ASICs as hyperscaler CapEx plateaus.
Can Nvidia reach a $20 trillion market cap by 2030?
Yes, visionary analysts like Beth Kindig argue this is possible if Nvidia captures the majority of a $3-$4 trillion annual data center spend and evolves into a software-high-margin 'AI Foundry'.
What role does Sovereign AI play in Nvidia's 2030 valuation?
Sovereign AI acts as a valuation floor and strategic hedge, providing sticky, non-cyclical revenue as nations build localized infrastructure for national security and data autonomy.
How does CUDA contribute to Nvidia's long-term stock value?
CUDA creates an 'impenetrable' software moat with over 5 million developers, making the switching cost for enterprises prohibitively high and allowing Nvidia to command software-like margins.
What are the main risks to the Nvidia 2030 growth thesis?
The primary risks include an 'AI ROI cliff' where infrastructure spend outpaces software revenue, geopolitical tensions in Taiwan, and competition from custom hyperscaler silicon (ASICs).