NASDAQ: PLTR in November 2026: Price, Valuation, and Outlook
PhD in Electrical Engineering. Formerly a silicon architect in Silicon Valley. She deconstructs complex tech stacks—from AI chips to autonomous driving sensors—into investable insights.
What NASDAQ: PLTR is pricing after the November 11 close
NASDAQ: PLTR is the Class A common stock of Palantir Technologies Inc., listed on the Nasdaq Global Select Market under the ticker PLTR. The shares closed at $172.40 on Wednesday, November 11, 2026. Yahoo Finance and StockAnalysis both show the session up $3.58, or 2.12%, with a range of $170.80 to $175.41. U.S. equity markets were closed after that session as of Thursday, November 12 in Asia, so this is the latest official close.
At that price, StockAnalysis, citing S&P Global Market Intelligence data checked on November 12, put the company's market capitalization at $415.40 billion on 2.41 billion shares outstanding. Trailing twelve-month revenue was $7.29 billion, net income was $3.67 billion, and diluted earnings per share were $1.42. The trailing price-to-earnings ratio stood at 121.45.
The quote has already bounced off this month's low, but it is not priced as if the multiple has been reset. The 52-week range is $106.37 to $212.94. The November 11 close sits about 19% below that high and about 62% above the low. Yahoo Finance's trailing total return was only 3.01% year to date as of November 11, lagging the S&P 500's 11.30%. The three-year total return was still 776.46%, which is the long rerating still sitting inside today's ticker.
NASDAQ: PLTR at $172.40 is discounting another year of very fast growth, while leaving little room if bookings stay as lumpy as they looked in the third quarter.
A lot of the post-earnings damage is still in the price. The shares sit below the 50-day moving average of $185.04 and above the 200-day average of $153.57, with a 14-day RSI of 42.40, according to StockAnalysis. Investors who want a rules-based read on that setup, rather than a single close, can check the trend in Tritonix’s AI technical analysis tools.
Ownership is institutionally meaningful, though not extreme. Institutions hold 62.36% of the shares, insiders own 7.45%, and the float is 2.12 billion shares. Short interest is 56.09 million shares, or 2.33% of shares outstanding and 2.65% of the float, equal to 2.37 days to cover. That is not a crowded short. Readers who want to see how large funds are actually positioned, instead of inferring sponsorship from the ownership percentage alone, can cross-check 13F-style holdings through Tritonix’s institutional smart money dashboard.
{
  "type": "line",
  "title": "NASDAQ: PLTR Closing Price Around the Q3 2026 Report",
  "index": "Date",
  "categories": ["Close"],
  "data": [
    {"Date": "2026-10-09", "Close": 209.05},
    {"Date": "2026-10-12", "Close": 209.00},
    {"Date": "2026-10-16", "Close": 186.03},
    {"Date": "2026-10-21", "Close": 201.72},
    {"Date": "2026-10-30", "Close": 184.11},
    {"Date": "2026-11-02", "Close": 178.34},
    {"Date": "2026-11-03", "Close": 175.40},
    {"Date": "2026-11-05", "Close": 154.99},
    {"Date": "2026-11-06", "Close": 160.38},
    {"Date": "2026-11-09", "Close": 169.20},
    {"Date": "2026-11-10", "Close": 168.82},
    {"Date": "2026-11-11", "Close": 172.40}
  ],
  "source": "StockAnalysis and FinancialContent session closes through November 11, 2026. The 52-week high of $212.94 was the October 12 intraday high.",
  "note": "Palantir reported third-quarter results after the close on November 2, 2026."
}
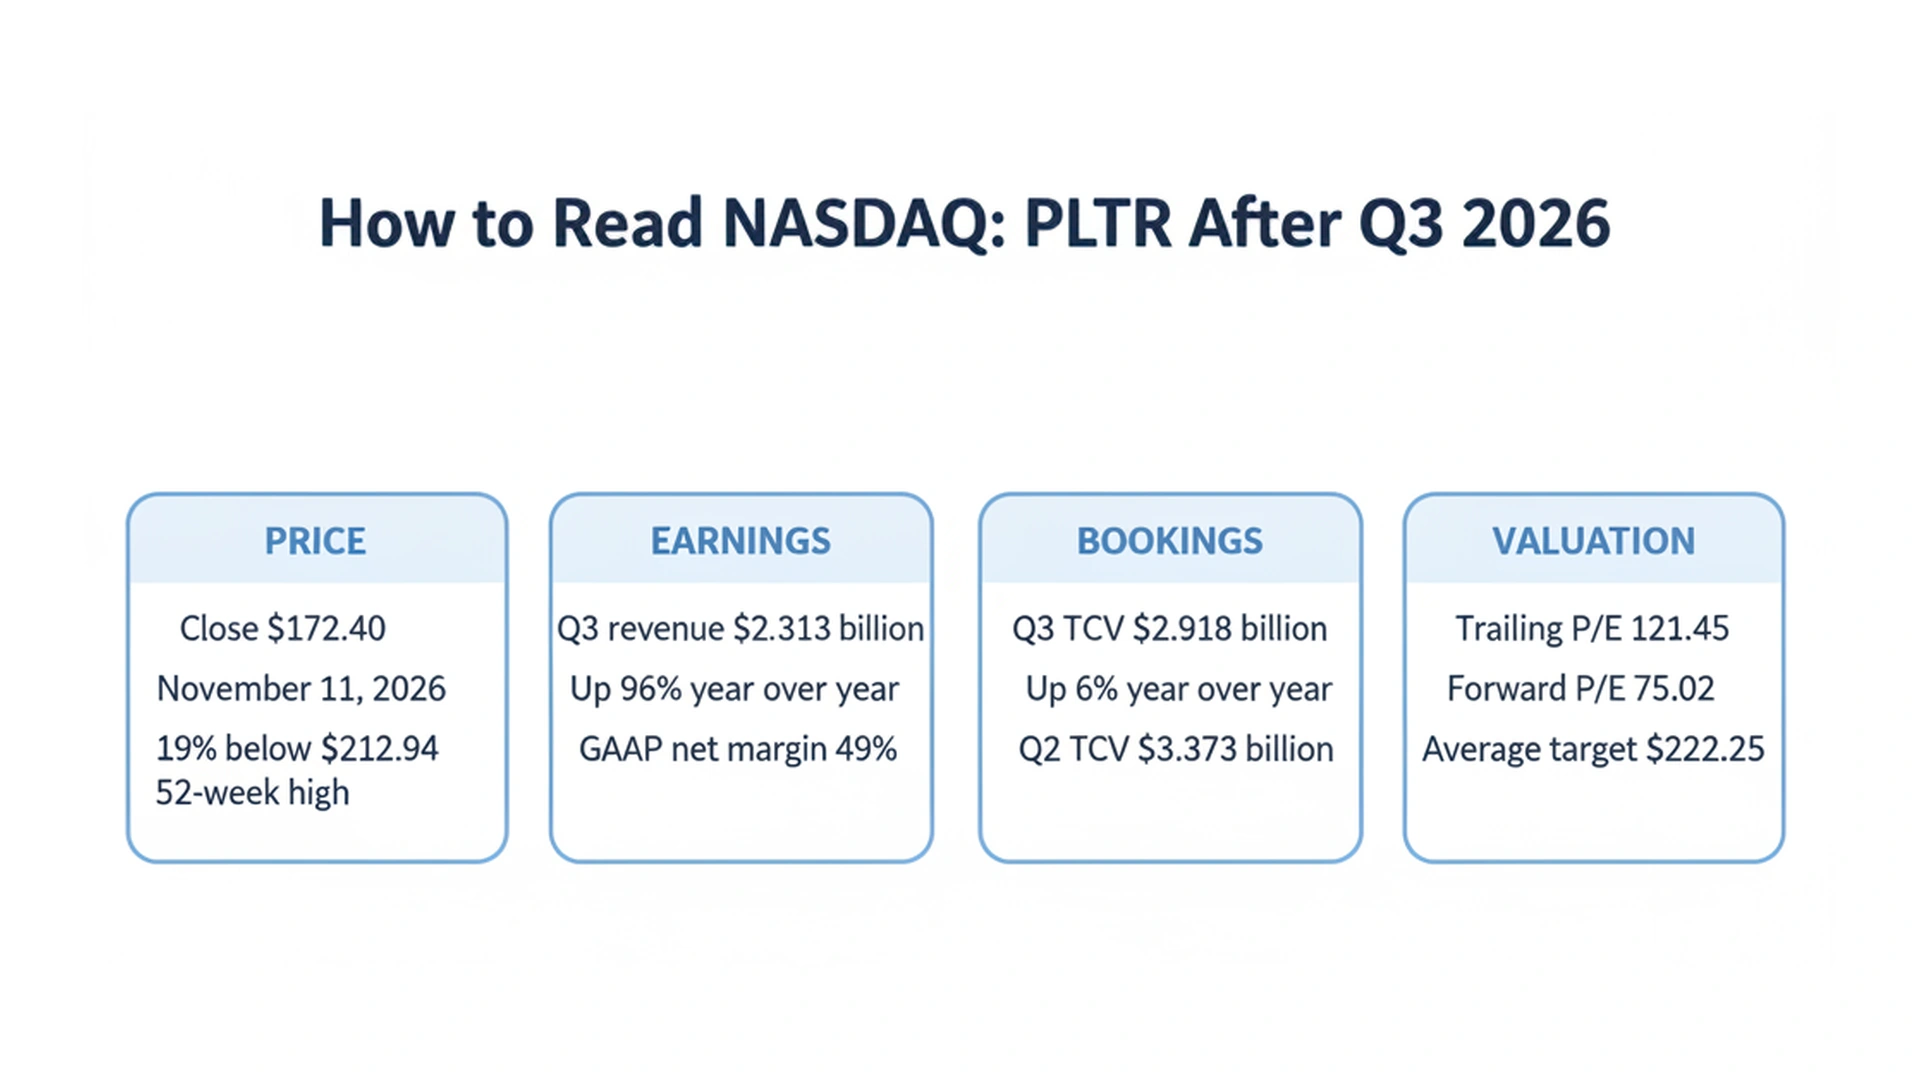
A four-part framework for the November 11 close: price versus the 52-week high, third-quarter earnings power, the bookings slowdown, and the still-elevated multiple. Figures match the sources cited in this article.
How the ticker sold off after a blowout quarter
The fundamental report was not the problem. Palantir released third-quarter results after the close on Monday, November 2, 2026, and CNBC reported a clear beat versus LSEG estimates: revenue of $2.31 billion against $2.18 billion expected, and adjusted earnings of 44 cents against 41 cents. Shares still dipped about 3% in extended trading and were down more than 7% in premarket trading on November 3, CNBC later noted.
The regular-session tape then did the rest. According to historical session closes compiled by StockAnalysis and FinancialContent, PLTR finished at $178.34 on November 2, then slid to $175.40, $171.70, and $154.99 on November 5, a 9.73% single-day drop on about 50 million shares. From the October 12 session high of $212.94, the November 5 close was a decline of about 27%.
The rebound since that low has been real, but it has also been incomplete. The shares closed at $160.38, $169.20, $168.82, and then $172.40 through November 11, a bounce of about 11% from the November 5 trough. Volume on November 11 was light: Yahoo Finance recorded 15.88 million shares, versus its average volume of 26.55 million. StockAnalysis shows 16.12 million versus a 20-day average of 26.13 million.
The market is no longer arguing about whether Palantir can grow. It is arguing about how much of that growth is already in a $415 billion market cap.
That is a different debate from last year's rerating. The 50-day average is still above the last close, which means the bounce has not yet repaired the trend that broke after earnings. A beta of 1.61 also reminds holders that this ticker moves more than the market when the multiple is under review.
Q3 results: U.S. commercial takes the lead
The company's November 2 release showed revenue of $2.313 billion, up 96% year over year and 20% sequentially, the first quarter above $2 billion. That also cleared Palantir's own prior third-quarter guide of $2.160 billion to $2.164 billion, issued with the second-quarter results on August 3.
The more important crossover was customer mix. U.S. commercial revenue rose 148% year over year and 29% sequentially to $984 million, surpassing U.S. government revenue of $953 million, which was itself up 96%. Combined U.S. revenue was $1.937 billion, or about 84% of the company. In the earnings call transcript, management said U.S. commercial customer count reached 686, up 29% year over year.
Profitability stayed unusually high for a software company still growing near 100%. GAAP operating income was $1.085 billion, a 47% margin. Adjusted operating income was $1.427 billion, a 62% margin. GAAP net income attributable to common stockholders was $1.128 billion, a 49% margin, and both GAAP and adjusted diluted EPS were $0.44. Adjusted free cash flow was $1.216 billion, a 53% margin. The Rule of 40 score was 158%.
| Metric | Q3 2026 | Change |
|---|---|---|
| Revenue | $2.313 billion | +96% year over year, +20% sequential |
| U.S. commercial revenue | $984 million | +148% year over year, +29% sequential |
| U.S. government revenue | $953 million | +96% year over year, +18% sequential |
| GAAP operating income | $1.085 billion | 47% margin |
| Adjusted operating income | $1.427 billion | 62% margin |
| GAAP net income | $1.128 billion | 49% margin |
| GAAP / adjusted EPS | $0.44 / $0.44 | Versus LSEG estimate of $0.41 |
| Adjusted free cash flow | $1.216 billion | 53% margin |
| Rule of 40 | 158% | Revenue growth plus adjusted operating margin |
Source: Palantir Q3 2026 earnings release, November 2, 2026; LSEG estimate via CNBC.
{
  "type": "bar",
  "title": "Palantir Q3 2026 Revenue Mix",
  "index": "Segment",
  "categories": ["Revenue ($ millions)"],
  "data": [
    {"Segment": "U.S. commercial", "Revenue ($ millions)": 984},
    {"Segment": "U.S. government", "Revenue ($ millions)": 953},
    {"Segment": "International government", "Revenue ($ millions)": 192},
    {"Segment": "International commercial", "Revenue ($ millions)": 184}
  ],
  "source": "Palantir Q3 2026 earnings release and Q3 2026 earnings call, November 2, 2026.",
  "note": "The four segments sum to $2.313 billion. U.S. commercial surpassed U.S. government for the first time."
}
The overseas commercial story is the soft spot inside an otherwise exceptional print. International commercial revenue grew only 21% year over year and 1% sequentially to $184 million. International government revenue was $192 million, up 31% year over year and 6% sequentially. Palantir is increasingly a U.S. compounder with a smaller, slower international book attached.
Guidance moved up with the beat. For the fourth quarter, Palantir expects revenue of $2.649 billion to $2.653 billion and adjusted operating income of $1.640 billion to $1.644 billion. Full-year 2026 revenue guidance was raised to $8.530 billion to $8.534 billion, implying about 91% year-over-year growth. U.S. commercial revenue is now expected in excess of $3.559 billion, or at least 143% growth. Adjusted operating income guidance is $5.245 billion to $5.249 billion, and adjusted free cash flow is $4.8 billion to $5.0 billion.
Bookings, remaining deal value, and the duration question
The number that unsettled the multiple was not revenue. Total contract value closed in the third quarter was $2.918 billion, up only 6% year over year. In the second quarter, TCV had been $3.373 billion, up 49%. U.S. commercial TCV slowed even more sharply, from a record $2.132 billion in the second quarter, up 153%, to $1.463 billion in the third, up 11%.
That is not a collapse in demand so much as a change in the shape of demand. On the call, management said it signed multiple eight-figure deals that were shorter in duration than usual, as customers adopted initial Sovereign AI capabilities. Net dollar retention was 165%, up eight points from the prior quarter, which is consistent with customers spending more inside existing accounts even if new contract length is shorter.
The backlog picture is mixed rather than broken. U.S. commercial remaining deal value was $6.517 billion, up 79% year over year but only 4% sequentially, after a 27% sequential increase in the second quarter. Total remaining deal value ended the quarter at $13.4 billion, up 55% year over year and 2% sequentially. Remaining performance obligations were $4.9 billion, up 88% year over year and flat sequentially.
Revenue growing 96% on total contract value growing 6% is sustainable only if consumption inside existing deals keeps compounding. That is the risk the November tape is underwriting.
Deal count was still heavy. Palantir closed 212 deals of at least $1 million, 107 of at least $5 million, and 64 of at least $10 million. Commercial TCV as a whole was $1.652 billion, up 17%. The implied international commercial booking contribution was much smaller than the U.S. book, which fits the almost flat international commercial revenue line.
| Bookings and backlog | Q2 2026 | Q3 2026 |
|---|---|---|
| Total TCV | $3.373 billion, +49% year over year | $2.918 billion, +6% year over year |
| U.S. commercial TCV | $2.132 billion, +153% year over year | $1.463 billion, +11% year over year |
| U.S. commercial remaining deal value | $6.238 billion, +27% sequential | $6.517 billion, +4% sequential, +79% year over year |
| Total remaining deal value | — | $13.4 billion, +2% sequential, +55% year over year |
| Remaining performance obligations | — | $4.9 billion, flat sequential, +88% year over year |
| Net dollar retention | — | 165%, +8 points sequential |
| Commercial TCV | — | $1.652 billion, +17% year over year |
Source: Palantir Q2 2026 earnings release, August 3, 2026; Palantir Q3 2026 earnings release and earnings call, November 2, 2026.
The company's own disclosures also caution that TCV and remaining deal value presume the exercise of contract options and no terminations, while most contracts can be terminated for convenience. The third-quarter Form 10-Q repeats that Palantir historically has not realized all of the revenue from full deal value. That language matters more when the market is being asked to pay 121 times trailing earnings.
Valuation, cash, and what the Street's $222 target assumes
Even after the pullback, NASDAQ: PLTR is priced like a scarce AI operating system, not like a conventional software franchise. At the November 11 close, StockAnalysis shows a forward price-to-earnings ratio of 75.02, a price-to-sales ratio of 57.00, a forward price-to-sales ratio of 34.80, and a price-to-free-cash-flow ratio of 102.47. The PEG ratio is 1.28, which looks less extreme only because the earnings growth rate is still very high.
Enterprise value was $405.06 billion, or about 55.58 times trailing sales and 99.92 times free cash flow. Trailing free cash flow was $4.05 billion, for an FCF yield of just 0.98%. The earnings yield was 0.82%. Those yields only make sense if mid-60% to 70% growth lasts long enough to grow into the multiple. StockAnalysis's compiled forecasts imply 62.44% revenue growth and 70.73% EPS growth over three years, which is the bull case already in the quote.
The balance sheet can support that patience. StockAnalysis lists $10.56 billion in cash and cash equivalents, $225.27 million of total debt, and net cash of $10.34 billion, or $4.29 a share. The current ratio is 7.10 and debt-to-equity is 0.02. Palantir's quarter-end cash, cash equivalents, and U.S. Treasury securities were $10.4 billion in the earnings release. The company does not pay a dividend, and share count rose 0.70% over the past year, so shareholder yield is slightly negative.
| Valuation and balance sheet | November 11, 2026 |
|---|---|
| Market capitalization | $415.40 billion |
| Enterprise value | $405.06 billion |
| Trailing / forward P/E | 121.45 / 75.02 |
| Price-to-sales / forward price-to-sales | 57.00 / 34.80 |
| Price-to-free-cash-flow | 102.47 |
| PEG ratio | 1.28 |
| Net cash | $10.34 billion, or $4.29 a share |
| 33-analyst average target | $222.25, implied upside 28.92% |
Source: StockAnalysis, citing S&P Global Market Intelligence, checked November 12, 2026, based on the November 11 close.
Wall Street has not abandoned the stock. StockAnalysis reports a 33-analyst average target of $222.25, implying 28.92% upside, with a consensus rating of "Buy." Yahoo Finance shows the same average, with a low of $80.00 and a high of $273.00. On November 4, Barclays maintained an Overweight rating and raised its target from $265 to $273, according to the Yahoo Finance quote page. The dispersion itself is the point: the bull case sees the commercial crossover extending, while the low target treats the multiple as the main risk.
One under-discussed support for today's earnings power is taxes. StockAnalysis shows only $50.92 million of income tax over the past twelve months, an effective rate of 1.36%. Palantir's adjusted earnings already assume a 23.0% long-term annual effective tax rate in its non-GAAP reconciliations. If cash taxes normalize toward that level, reported earnings quality will look different even if operations do not.
What matters for NASDAQ: PLTR into early 2027
The next official test is the fourth-quarter report. Yahoo Finance currently lists an estimated date of February 1, 2027. The company's guide already asks investors to believe in another step-up, to about $2.65 billion of quarterly revenue and more than $1.64 billion of adjusted operating income. If that lands, the commercial crossover will look less like a one-quarter event.
The bookings line will matter more than the beat. Investors will look for U.S. commercial TCV to stabilize after the drop from $2.132 billion to $1.463 billion, for remaining performance obligations to start rising again after a flat quarter at $4.9 billion, and for international commercial revenue to do more than grow 1% sequentially. Shorter Sovereign AI contracts can still be a feature if they convert into longer, larger renewals, as management said it expects over time.
Valuation leaves less cushion than the 11% bounce from $154.99 suggests. A $415.40 billion company growing into a $222.25 consensus target still has to keep posting mid-teens sequential growth without another bookings air pocket. The 52-week high of $212.94 is a reminder of how quickly this ticker can re-rate in either direction.
The investment question for NASDAQ: PLTR is no longer whether Palantir is a real AI software business. It is whether 75 times forward earnings is the right price for a company whose contract value just decelerated to 6%.
That is a research problem, not a headline problem. Readers who want to track the quote, the moving averages, and the fundamental series in one place can follow Palantir through Tritonix’s market data workspace.
FAQ
What is the latest price of NASDAQ: PLTR?
NASDAQ: PLTR closed at $172.40 on Wednesday, November 11, 2026, up $3.58, or 2.12%, according to Yahoo Finance and StockAnalysis. The session range was $170.80 to $175.41, and the 52-week range is $106.37 to $212.94.
Why did Palantir stock fall after Q3 2026 earnings?
Palantir beat LSEG estimates on November 2, 2026, with revenue of $2.31 billion versus $2.18 billion expected and adjusted EPS of $0.44 versus $0.41. The shares still sold off because total contract value rose only 6% year over year, to $2.918 billion, after $3.373 billion in the second quarter. The stock bottomed at $154.99 on November 5 before closing at $172.40 on November 11.
Did U.S. commercial revenue surpass U.S. government revenue?
Yes. In the third quarter of 2026, U.S. commercial revenue rose 148% year over year and 29% sequentially to $984 million, surpassing U.S. government revenue of $953 million, which was up 96%. Combined U.S. revenue was $1.937 billion, or about 84% of total revenue of $2.313 billion.
What valuation does NASDAQ: PLTR trade at after the November 11 close?
At the November 11, 2026 close of $172.40, StockAnalysis, citing S&P Global Market Intelligence, showed a market cap of $415.40 billion, a trailing P/E of 121.45, a forward P/E of 75.02, a price-to-sales ratio of 57.00, and a price-to-free-cash-flow ratio of 102.47.
What is Wall Street's price target for Palantir?
StockAnalysis reports a 33-analyst average 12-month target of $222.25, implying 28.92% upside from the November 11 close, with a consensus rating of Buy. Yahoo Finance shows the same average, with a low of $80.00 and a high of $273.00. On November 4, Barclays maintained an Overweight rating and raised its target from $265 to $273.