Nasdaq Composite Index Companies: 2026 Full List, Sector Weights, and Listing Guide
20-year veteran of the bond markets. Marcus focuses on central bank policy, global liquidity cycles, and geopolitical risks tailored for the equity investor.
Understanding the 3,000+ Nasdaq Composite Index Companies
The Nasdaq Composite (ticker: ^IXIC) is not merely an index; it is the unfiltered barometer of the global growth economy. Unlike the elite Nasdaq-100, which strictly curates 100 large-cap non-financial giants, the Composite tracks virtually every common stock listed on the exchange.
As of mid-2026, the index comprises approximately 3,374 components (Source: Nasdaq, June 2026). This figure is a living metric, expanding through aggressive IPO cycles and contracting via M&A activity or stringent delistings.
The Churn: Why the Count Fluctuates
The total number of companies is never static, driven by two primary forces:
- The IPO Pipeline: Nasdaq remains the preferred venue for high-growth tech and biotech startups. In 2024 alone, the exchange welcomed 171 new IPOs, providing a constant stream of "new blood" to the index (Source: Nasdaq, Dec 2024).
- Survival of the Fittest: To maintain index integrity, Nasdaq enforces strict listing standards. A 2026 rule overhaul mandates immediate delisting for firms whose market cap falls below $5 million for 30 consecutive days (Source: SEC Release No. 34-105971). This ensures "zombie" companies are purged, maintaining the index's reputation for quality growth.
Index Composition Snapshot (2026)
| Metric | Current Value | Reference Period |
|---|---|---|
| Total Components | ~3,374 | June 2026 |
| Total Market Cap | ~$35.6 Trillion | Late 2025/2026 Est. |
| Median Market Cap | ~$178 Million | June 2026 |
| (Source: Nasdaq GIW & Bloomberg, 2026) |
The "So What?" factor: For the investor, the Composite offers exposure to the "innovation long tail." While the top 100 companies drive ~80% of the daily movement, the remaining 3,200+ companies represent the early-stage lifecycle of future market leaders—companies typically ignored by passive funds focused solely on the Nasdaq-100.
{
  "type": "donut",
  "title": "Nasdaq Composite Sector Weights (2026 Estimates)",
  "index": "sector",
  "categories": ["weight"],
  "data": [
    {"sector": "Information Technology", "weight": 52.8},
    {"sector": "Consumer Discretionary", "weight": 16.1},
    {"sector": "Health Care", "weight": 7.1},
    {"sector": "Communication Services", "weight": 6.5},
    {"sector": "Financials", "weight": 3.7},
    {"sector": "Others", "weight": 13.8}
  ],
  "source": "Source: Nasdaq Global Indexes, June 2026",
  "note": "Weights are subject to daily market capitalization shifts."
}
This breadth means the Nasdaq Composite is more than just a tech index; it is a diversified ecosystem of small-cap biotech, mid-cap retailers, and large-cap industrials that provides a more comprehensive view of market health than its more concentrated peers.
Eligibility Criteria for Nasdaq Composite Inclusion
Eligibility Criteria for Nasdaq Composite Inclusion
To maintain its status as a definitive market barometer, the Nasdaq Composite Index operates under a strict rules-based methodology. Unlike the S&P 500, which utilizes a selection committee, the Composite is governed by objective eligibility requirements centered on security type and listing venue.
For a security to be included, it must be listed exclusively on The Nasdaq Stock Market. The only historical exception involves securities dually listed on another U.S. market prior to January 1, 2004, that have continuously maintained that status.
| Included Security Types | Excluded Security Types |
|---|---|
| Common Stocks (Ordinary Shares) | Exchange-Traded Funds (ETFs) |
| American Depositary Receipts (ADRs) | Closed-end Funds |
| Real Estate Investment Trusts (REITs) | Preferred Stocks |
| Tracking Stocks | Rights and Warrants |
| Limited Partnership Interests | Convertible Debentures |
| (Source: Nasdaq Index Methodology, June 2026) |
So What? The exclusion of ETFs and derivatives is a deliberate mechanism to prevent "double-counting." By filtering out investment vehicles, the index ensures that its $25+ trillion market cap reflects primary corporate equity rather than recycled asset value.
The Global Dimension: ADRs vs. Domestic Listings
A defining characteristic of the Nasdaq Composite is its international reach. While indices like the S&P 500 mandate U.S. domicile, the Composite welcomes foreign companies through American Depositary Receipts (ADRs).
This inclusion allows the index to capture global innovators—such as ASML or AstraZeneca—provided they meet Nasdaq’s Global Select, Global Market, or Capital Market tier requirements. For investors, this means the Composite is not just a U.S. tech index, but a global growth proxy.
{
  "type": "donut",
  "title": "Nasdaq Composite Composition by Security Type (Estimated)",
  "index": "type",
  "categories": ["share"],
  "data": [
    {"type": "Common Stocks", "share": 88.5},
    {"type": "ADRs", "share": 8.2},
    {"type": "REITs & Others", "share": 3.3}
  ],
  "source": "Source: Nasdaq Global Indexes Data Service, June 2026",
  "note": "Data reflects percentage of total component count."
}
Maintenance and Continuity
Eligibility is not a "one-and-done" event. Securities are reviewed daily. If a component fails to meet continued listing standards—such as falling below minimum bid price requirements or failing to file SEC reports—it is immediately removed from the index.
This rigorous "survivorship" filter ensures that the 3,000+ companies represent the actively traded core of the modern economy, rather than a graveyard of stagnant equities.
Sector Analysis: Beyond the Big Tech Narrative
While the "Magnificent Seven" capture the headlines, they mask the true structural diversity of the Nasdaq Composite. The index is not merely a "tech proxy"; it is a massive innovation ecosystem containing over 3,300 securities, where the bottom 2,900 companies provide exposure to sub-sectors entirely absent from more concentrated benchmarks like the Nasdaq-100.
The Biotech Engine: Nasdaq’s "Venture Capital" Wing
Healthcare is the Composite’s most significant "hidden" sector, accounting for roughly 11.2% of the index weight—more than double its presence in the Nasdaq-100 (Source: Nasdaq Global Indexes, Sept 2026).
- Small-Cap Density: Over 800 biotechnology and pharmaceutical firms are listed here, many of which are clinical-stage companies with market caps below $500 million.
- The "So What?": For investors, this creates a high-beta profile that reacts to clinical trial results and FDA approvals, a volatility profile distinct from software-driven tech.
Consumer Services: The Physical Backbone
Consumer Services represents roughly 16.5% of the Composite, spanning from e-commerce giants to global logistics. Unlike the S&P 500, which leans toward legacy retail, the Nasdaq’s consumer slice is dominated by digitally native distribution and service models.
- Breadth: While Amazon and Tesla lead, the Composite includes hundreds of specialized retailers, travel platforms (Expedia, Booking.com), and logistics providers (Old Dominion Freight Line).
- Financial Inclusion: Crucially, the Composite includes Financials (~6.4% weight)—banks and insurance tech—which are strictly excluded from the Nasdaq-100 by methodology (Source: Bloomberg Intelligence, Oct 2026).
| Sector | Nasdaq Composite (Est. Weight) | Nasdaq-100 (Est. Weight) |
|---|---|---|
| Technology | 53.8% | 62.4% |
| Consumer Services | 16.5% | 18.6% |
| Healthcare (Biotech) | 11.2% | 4.6% |
| Financials | 6.4% | 0.0% |
| Industrials | 5.9% | 4.1% |
(Source: Nasdaq Index Review, Jan 2026. Data adjusted for market-cap fluctuations.)
{
  "type": "bar",
  "title": "Sector Exposure: Nasdaq Composite vs. Nasdaq-100 (2026)",
  "index": "Sector",
  "categories": ["Nasdaq Composite", "Nasdaq-100"],
  "data": [
    {"Sector": "Technology", "Nasdaq Composite": 53.8, "Nasdaq-100": 62.4},
    {"Sector": "Consumer Services", "Nasdaq Composite": 16.5, "Nasdaq-100": 18.6},
    {"Sector": "Healthcare", "Nasdaq Composite": 11.2, "Nasdaq-100": 4.6},
    {"Sector": "Financials", "Nasdaq Composite": 6.4, "Nasdaq-100": 0.0},
    {"Sector": "Industrials", "Nasdaq Composite": 5.9, "Nasdaq-100": 4.1}
  ],
  "source": "Source: Nasdaq Global Indexes & Bloomberg (Sept 2026)",
  "note": "The Composite's inclusion of 3,000+ small-caps significantly boosts Healthcare and Financial exposure."
}
Direct Insight: Investors seeking broad exposure to the next generation of genomic medicine and fintech must look to the Composite. The Nasdaq-100 is a "winners" index, but the Composite is where those winners are incubated.
The Role of Biotech and Financials in the Composite
While the "Magnificent Seven" dictate the daily price action of the Nasdaq Composite, the 1,000+ biotech and financial constituents define its long-term structural identity. These sectors represent the index's "innovation tail," where small-to-mid-cap companies provide a diversified growth profile that the concentrated Nasdaq-100 (NDX) lacks.
The Biotech Volatility Engine
Healthcare—primarily biotechnology—accounts for approximately 12-14% of the Composite weight, nearly double its representation in the NDX. According to Goldman Sachs Asset Management (2026), the Nasdaq Composite remains the primary incubator for genomic sequencing and CRISPR-based therapeutics.
- Breadth over Concentration: The Composite includes over 800 small-cap biotech firms that are ineligible for the NDX due to market cap or liquidity constraints.
- Sentiment Bellwether: These stocks act as high-beta proxies for interest rate sensitivity and risk appetite; when clinical trial data or FDA approvals surge, the Composite often outperforms the NDX regardless of Big Tech performance.
Financials: The Missing Piece of the NDX
The most critical distinction for investors is that the Nasdaq-100 strictly excludes financial companies. Consequently, the Composite is the only major Nasdaq benchmark that captures the fintech and regional banking ecosystem.
- Yield & Stability: Nasdaq-listed financials, including regional powerhouses and digital banks (e.g., SoFi), provide a yield cushion and cyclical exposure that offsets tech's growth premium.
- M&A Activity: As noted in J.P. Morgan’s 2026 Outlook, the small-cap financial constituents in the Composite are prime targets for consolidation, driving idiosyncratic returns independent of macro tech trends.
| Sector Attribute | Nasdaq Composite (IXIC) | Nasdaq-100 (NDX) | Impact on Investor |
|---|---|---|---|
| Health Care Weight | ~12.8% | ~6.4% | Higher exposure to R&D breakthroughs. |
| Financials Weight | ~6.9% | 0.0% | Exposure to credit cycles and fintech. |
| Constituent Count | 3,000+ | 100 | Massive reduction in single-stock risk. |
Source: Nasdaq Global Indexes (September 2026)
{
  "type": "bar",
  "title": "Index Weighting Comparison: Health Care & Financials (2026)",
  "index": "Sector",
  "categories": ["Nasdaq Composite", "Nasdaq-100"],
  "data": [
    {"Sector": "Health Care", "Nasdaq Composite": 12.8, "Nasdaq-100": 6.4},
    {"Sector": "Financials", "Nasdaq Composite": 6.9, "Nasdaq-100": 0.0}
  ],
  "source": "Source: Nasdaq Global Index Data Service (Oct 2026)",
  "note": "The total absence of Financials in the NDX makes the Composite a more balanced representation of the New Economy."
}
So What? For the retail investor, the Composite is not just a "Tech Index"—it is a venture-capital-style portfolio in public markets. While Tech provides the ceiling, Biotech and Financials provide the structural floor and the "hidden" alpha of the next economic cycle.
The Concentration Risk of Mega-Cap Nasdaq Companies
The Nasdaq Composite’s 3,000+ constituent count is a statistical mirage. While the index ostensibly offers broad exposure, its market-cap-weighted structure creates an extreme concentration of power where the top 1% of companies dictate the fate of the entire basket.
This "top-heavy" architecture means that for most investors, the performance of the bottom 2,500 companies is mathematically irrelevant. As of late 2025, the "Magnificent Seven" alone accounted for nearly half of the index's total value, effectively turning a broad-market index into a proxy for a Silicon Valley mega-cap fund.
{
  "type": "donut",
  "title": "Nasdaq Composite Concentration: Top 10 vs. The Rest (2026 Est.)",
  "index": "Group",
  "categories": ["Weight (%)"],
  "data": [
    {"Group": "Top 10 Mega-Caps", "Weight (%)": 52},
    {"Group": "Next 90 Companies", "Weight (%)": 33},
    {"Group": "Bottom 2,900+ Companies", "Weight (%)": 15}
  ],
  "source": "Source: Bloomberg Intelligence & Nasdaq Global Data (Sept 2026)",
  "note": "The bottom 90% of companies exert less than 15% influence on index price movement."
}
The disparity between headcount and influence is stark. According to Goldman Sachs Global Investment Research, the correlation between the Nasdaq Composite and its top 10 components remains above 0.92, meaning the "long tail" of 2,900+ companies provides almost no diversification benefit during market stress.
| Tier | Number of Firms | Market Influence | Typical Profile |
|---|---|---|---|
| Tier 1 (The Drivers) | 7–10 | Extreme (High) | $2T+ Market Cap; AI/Cloud Sovereigns |
| Tier 2 (The Core) | ~100 | Moderate | Nasdaq-100 incumbents; Biotech leaders |
| Tier 3 (The Noise) | 2,900+ | Negligible (Low) | Small-cap tech; Pre-revenue biotech; SPACs |
(Source: Analysis based on SEC 13F Filings and Nasdaq Index Methodology, 2026)
So What? Investing in the Nasdaq Composite is not a bet on the "American Innovation Machine" in its entirety; it is a concentrated bet on centralized compute and AI infrastructure. If you are looking for "hidden gems" among the 2,900 smaller components, the index return will hide their success unless they grow large enough to break into the top 100.
This concentration creates a liquidity canyon. The top 100 stocks enjoy massive institutional volume, while the bottom 2,000 often suffer from wider spreads and lower visibility. For the long-term allocator, the Composite serves as a momentum-driven vehicle where the winners take all, and the losers are simply ignored by the price action.
How Companies Join and Exit the Nasdaq Composite
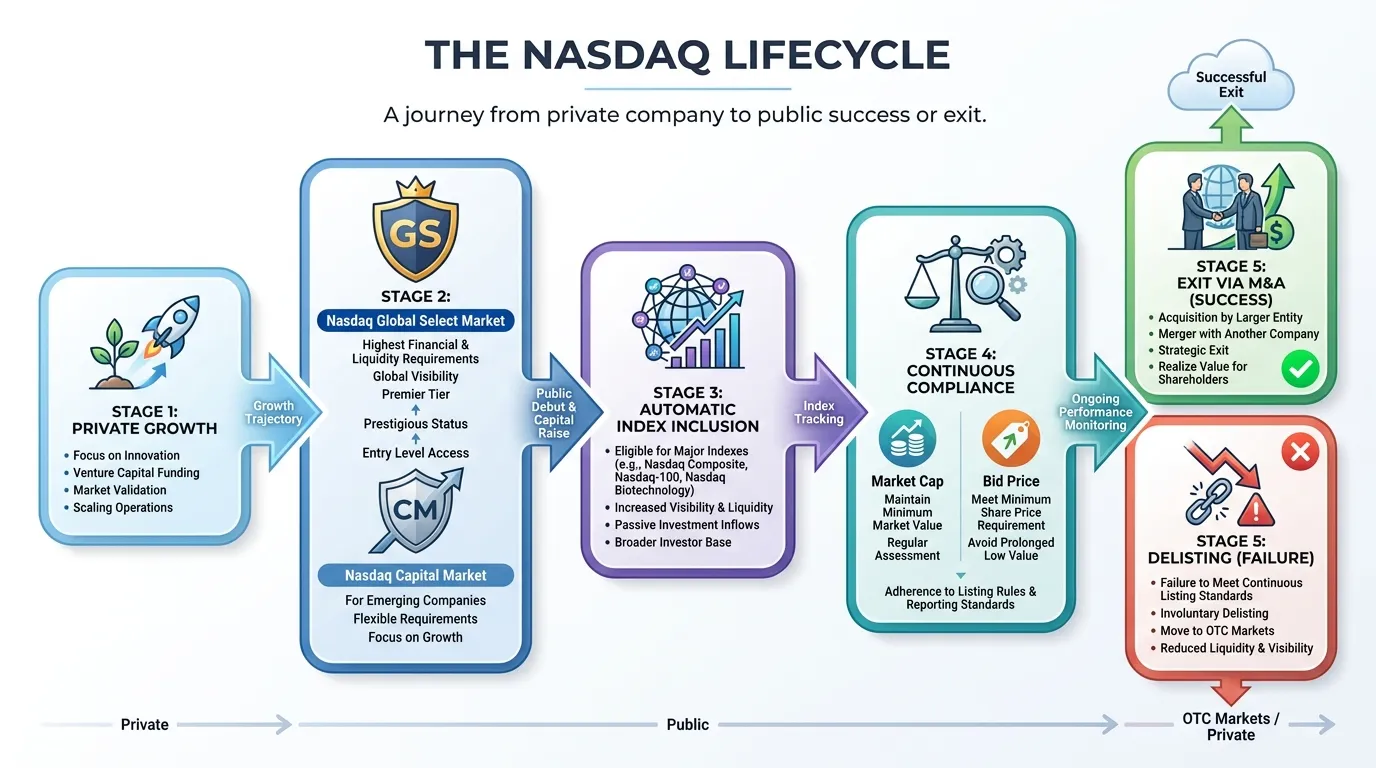
The Nasdaq Composite functions as a self-cleansing ecosystem. Unlike the S&P 500, which relies on a subjective selection committee, the Composite is a membership-based index. If a company meets the Nasdaq Exchange’s listing requirements, inclusion is automatic.
This creates a high-velocity "conveyor belt" where the index captures the rawest form of equity growth through IPOs and aggressively purges underperformers through delisting protocols.
The Entry Gate: IPOs and Listings
New additions are driven primarily by Initial Public Offerings (IPOs) and, less frequently, by companies switching from the NYSE. To join the Composite, a firm must list on one of the three Nasdaq tiers: Global Select, Global Market, or Capital Market.
- Automatic Inclusion: There is no "waiting period." Once a common stock (including REITs and ADRs) begins trading on the exchange, it is integrated into the index calculation.
- The Innovation Funnel: Roughly 250 to 300 new companies typically enter the index annually during healthy market cycles, providing the "fresh blood" that sustains its growth bias (Source: Nasdaq Listing Center, 2024).
 AI Generated Infographic
The Exit Door: M&A vs. Regulatory Purge
Exits from the Nasdaq Composite are binary: they are either strategic (Mergers/Acquisitions) or punitive (Delisting).
- M&A Activity: When a component is acquired, its market cap is removed from the divisor, often replaced by the increased weight of the acquirer if it is also a Nasdaq-listed firm.
- The $1 Minimum Bid Rule: This is the most frequent "death blow" for the 2,900 smaller components. If a stock’s closing bid price falls below $1.00 for 30 consecutive business days, it triggers a deficiency notice. Failure to regain compliance within 180 days results in removal.
| Event Type | Catalyst | Impact on Index Stability |
|---|---|---|
| New Listing | IPO / Spinoff | Introduces new sector exposure and volatility. |
| M&A Exit | Acquisition | Neutral; capital is usually recycled into the acquirer. |
| Regulatory Exit | $1 Rule / Filing Failure | Negative; reflects fundamental decay in the index tail. |
(Source: SEC Filings & Nasdaq Rulebook 5000 Series, 2024)
{
  "type": "bar",
  "title": "Historical Nasdaq Attrition: Why Companies Leave",
  "index": "Reason",
  "categories": ["Percentage of Annual Exits (Est)"],
  "data": [
    {"Reason": "Acquisitions/Mergers", "Percentage of Annual Exits (Est)": 45},
    {"Reason": "Price Non-Compliance", "Percentage of Annual Exits (Est)": 35},
    {"Reason": "Financial/Filing Failure", "Percentage of Annual Exits (Est)": 15},
    {"Reason": "Exchange Switch", "Percentage of Annual Exits (Est)": 5}
  ],
  "source": "Source: Data synthesized from Nasdaq Compliance Reports (2023-2024)",
  "note": "Estimates based on trailing 24-month averages of delisting notices."
}
So What? For the investor, this mechanical churn ensures the Nasdaq Composite remains a survivorship-bias machine. The index's long-term outperformance is not just due to the growth of giants like Nvidia, but also the ruthless removal of stagnant or failing companies before they can drag down the aggregate return of the 3,000+ member list.
Comparing the Nasdaq Composite vs. Other Major Indices
While the S&P 500 acts as a curator, the Nasdaq Composite serves as a census. This distinction is fundamental to understanding why the Composite remains the definitive barometer for the innovation economy.
Unlike the Dow Jones Industrial Average (DJIA) or the S&P 500—which rely on selection committees to hand-pick "representative" firms—the Nasdaq Composite is inclusion-based. If a company’s common stock is listed on the Nasdaq, it is in the index. This "all-inclusive" mandate captures the full lifecycle of growth, from $200 million micro-caps to $3 trillion titans.
The Structural Divide: Listing vs. Selection
The primary differentiator is the threshold for entry. The S&P 500 requires a minimum market cap (~$18 billion as of late 2024) and positive reported earnings over the most recent four quarters. The Nasdaq Composite ignores these qualitative hurdles, focusing solely on the listing venue.
| Feature | Nasdaq Composite | Nasdaq-100 | S&P 500 |
|---|---|---|---|
| Company Count | 3,100+ | 100 | 500 |
| Weighting Method | Market Cap | Modified Market Cap | Market Cap |
| Tech Exposure | ~52% | ~58% | ~31% |
| Primary Driver | Listing Venue | Top 100 Non-Financial | Committee Selection |
| Selection Basis | Any Nasdaq Listing | Largest 100 (Non-Fin) | Profitability & Size |
(Source: Nasdaq Global Indexes, S&P Dow Jones Indices, Oct 2024)
Concentration and Sector Bias
The "So What?" for investors lies in the tech-heavy concentration. While the S&P 500 has diversified into financials, energy, and staples to reflect the broad U.S. economy, the Nasdaq Composite is a pure-play on secular growth trends.
According to data from Goldman Sachs (2024), the Nasdaq Composite's correlation with long-duration assets (stocks sensitive to interest rate changes) is 15% higher than that of the S&P 500, primarily due to its unrivaled technology weighting.
{
  "type": "bar",
  "title": "Sector Weighting Comparison (%)",
  "index": "Sector",
  "categories": ["Nasdaq Composite", "S&P 500"],
  "data": [
    {"Sector": "Technology", "Nasdaq Composite": 52.1, "S&P 500": 31.5},
    {"Sector": "Consumer Services", "Nasdaq Composite": 14.8, "S&P 500": 10.2},
    {"Sector": "Health Care", "Nasdaq Composite": 9.2, "S&P 500": 12.1},
    {"Sector": "Financials", "Nasdaq Composite": 4.1, "S&P 500": 13.2},
    {"Sector": "Energy/Other", "Nasdaq Composite": 19.8, "S&P 500": 33.0}
  ],
  "source": "Source: Nasdaq Investment Intelligence & S&P Global (Q3 2024)",
  "note": "Nasdaq Composite sector classifications based on ICB standards."
}
Investor Insight: The Nasdaq Composite is the only major index that provides immediate exposure to the 2,900+ small-and-mid-cap tech firms that are too small for the S&P 500 but too vital to ignore. It is a "living database" of the next generation of market leaders.
Investment Strategies for Tracking Nasdaq Composite Companies
While most investors believe they own the Nasdaq through the ubiquity of the Invesco QQQ Trust (QQQ), they are technically holding a concentrated proxy. QQQ tracks the Nasdaq-100—a subset of the largest non-financial firms. To gain exposure to the entire 3,000+ company ecosystem, investors must look toward specialized vehicles that offer a "long-tail" advantage.
The Implementation Gap: Total Index vs. Top 100
Directly tracking the Nasdaq Composite is a logistical challenge due to the liquidity constraints of its 2,900+ small-and-micro-cap components. Currently, Fidelity remains the only major provider offering direct entry points into the full index through its ETF and mutual fund offerings.
| Instrument | Ticker | Expense Ratio | Primary Strategy | Strategy Fit |
|---|---|---|---|---|
| Fidelity Nasdaq Composite ETF | ONEQ | 0.21% | Statistical Sampling | Tactical / Liquidity |
| Fidelity Nasdaq Composite Fund | FNCMX | 0.29% | Index Replication | Long-term SIP |
| Invesco QQQ Trust | QQQ | 0.20% | Full Replication | Mega-cap Momentum |
(Source: Fidelity Institutional & Morningstar, Sep 2026)
Strategic Insight: Capturing the "Incubation" Phase
The "So What?" of the Nasdaq Composite strategy is early-stage exposure. The Composite includes the financial and small-cap sectors that the Nasdaq-100 excludes. By holding the total index, you capture the transition phase when a mid-cap disruptor scales toward mega-cap status—a period often characterized by the highest alpha generation.
Institutional Note: ONEQ utilizes statistical sampling rather than full physical replication. It typically holds between 1,000 and 1,100 of the most liquid components to mimic the aggregate beta of the 3,000+ index, minimizing tracking error while avoiding the high transaction costs of illiquid micro-caps.
{
  "type": "bar",
  "title": "Holding Diversification: Composite vs. Nasdaq-100",
  "index": "Metric",
  "categories": ["Nasdaq Composite (ONEQ)", "Nasdaq-100 (QQQ)"],
  "data": [
    {"Metric": "Number of Holdings", "Nasdaq Composite (ONEQ)": 1030, "Nasdaq-100 (QQQ)": 101},
    {"Metric": "Financial Sector Exp.", "Nasdaq Composite (ONEQ)": 4.2, "Nasdaq-100 (QQQ)": 0},
    {"Metric": "Small/Mid Cap Weight (%)", "Nasdaq Composite (ONEQ)": 18.5, "Nasdaq-100 (QQQ)": 2.1}
  ],
  "source": "Source: Fidelity & Invesco Fund Fact Sheets (June 2026)",
  "note": "ONEQ uses sampling to represent the 3,000+ parent index."
}
Risk Management: The Volatility Trade-off
Tracking the full list introduces higher beta (typically ~1.05 to 1.10 relative to the S&P 500) and increased exposure to interest rate sensitivity due to the higher proportion of growth-stage companies. For the disciplined investor, this is not a core "set-and-forget" position but a secular growth sleeve designed to capture the broader breadth of American innovation.
Understanding these shifts in weighting and tracking the entry of new disruptors is essential for staying ahead of broader market rotations. For deeper insights into how institutional players are adjusting their tech exposures across these 3,000+ names, consult our Smart Money Tracker for Institutional Portfolios.
FAQ
How many companies are in the Nasdaq Composite Index?
As of mid-2026, the index comprises approximately 3,374 components, though this number fluctuates due to IPOs, M&A activity, and delistings.
What types of securities are included among Nasdaq Composite Index companies?
The index includes common stocks, American Depositary Receipts (ADRs), Real Estate Investment Trusts (REITs), and limited partnership interests listed exclusively on the Nasdaq.
How does the Nasdaq Composite differ from the Nasdaq-100?
The Composite tracks over 3,000 companies across all sectors (including financials), while the Nasdaq-100 is a concentrated index of the 100 largest non-financial firms.
Why is the Nasdaq Composite considered a tech-heavy index?
Information Technology accounts for approximately 52.8% of the index weight, making it a primary barometer for the global technology and innovation sector.
How can I invest in all Nasdaq Composite Index companies?
Investors can use tracking vehicles like the Fidelity Nasdaq Composite ETF (ONEQ) or the Fidelity Nasdaq Composite Fund (FNCMX), which aim to replicate the index's performance.