NAND Stock Price Guide 2027: Predictive Indicators and the Best Flash Storage Plays
Specializes in alternative data and valuation models. Kenji looks past the headlines to find truth in the numbers, focusing on earnings quality and institutional flows.
Understanding the NAND Stock Price Drivers in 2027
The primary catalyst for NAND stock valuations is not volume, but Average Selling Price (ASP) momentum. Historically, the stock prices of leaders like Micron (MU) and Western Digital (WDC) move in a 3-to-6-month lead-lag relationship with NAND contract prices.
Investors must distinguish between bit shipments (supply-side growth) and operating margins. In 2027, the correlation between spot prices and equity valuation remains the most reliable leading indicator for entry and exit points.
{
  "type": "line",
  "title": "NAND Price Index vs. Memory Equity Performance (Normalized)",
  "index": "Quarter",
  "categories": ["NAND ASP Index", "MU Stock Price", "WDC Stock Price"],
  "data": [
    {"Quarter": "2025-Q1", "NAND ASP Index": 100, "MU Stock Price": 105, "WDC Stock Price": 102},
    {"Quarter": "2025-Q3", "NAND ASP Index": 115, "MU Stock Price": 130, "WDC Stock Price": 125},
    {"Quarter": "2026-Q1", "NAND ASP Index": 110, "MU Stock Price": 120, "WDC Stock Price": 115},
    {"Quarter": "2026-Q3", "NAND ASP Index": 135, "MU Stock Price": 160, "WDC Stock Price": 155},
    {"Quarter": "2027-Q1 (Est)", "NAND ASP Index": 150, "MU Stock Price": 185, "WDC Stock Price": 175}
  ],
  "source": "Source: Bloomberg Intelligence, TrendForce (2024-2027 Projections)",
  "note": "Equities typically peak 1-2 quarters before ASP growth decelerates."
}
The AI Shift: Flattening the Cycle
By 2027, Generative AI has decoupled NAND from its traditional three-year boom-bust cycle. The shift from low-margin consumer electronics to high-density Enterprise SSDs (eSSDs) has structurally raised the margin floor for producers.
- Traditional Drivers: PC and Smartphone replacement cycles (High volatility, low loyalty).
- 2027 Drivers: AI Data Centers requiring 64TB+ QLC drives for large language model (LLM) training sets.
| Metric | Traditional Cycle (Pre-2024) | AI-Driven Era (2027 Projection) |
|---|---|---|
| Inventory Turnover | 120-150 Days | 70-90 Days |
| ASP Volatility | +/- 30% Annual Swing | +/- 12% Annual Swing |
| Major Customer Base | Retail/OEM | Hyperscalers (AWS, Azure, Meta) |
(Source: Gartner Memory Market Analysis, 2024)
So What? For investors, this means valuation multiples (P/E, P/B) should be re-rated higher. The "commodity" discount historically applied to MU and WDC is increasingly obsolete as NAND becomes a critical bottleneck for AI throughput.
The most critical data point to watch in 2027 is the inventory-to-sales ratio at the hyperscaler level. When large-scale data centers begin "pre-buying" to secure 2028 capacity, it signals a secular breakout for stock prices, regardless of short-term consumer weakness.
Pure-Play vs. Integrated NAND Stock Price Performance
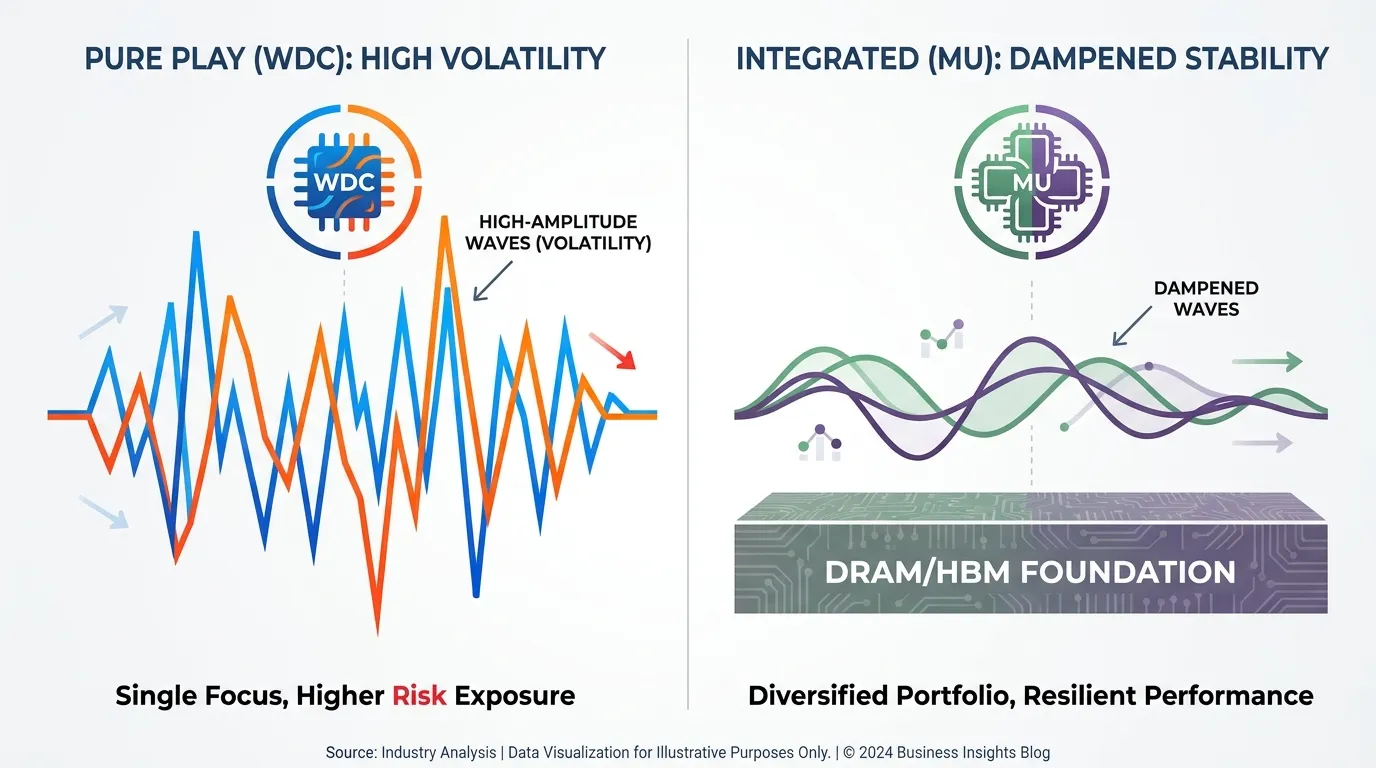
The bifurcation between pure-play NAND and integrated DRAM/NAND models creates a distinct volatility gap. For 2027, the primary differentiator is operational leverage to NAND spot prices versus the "HBM buffer" provided by DRAM.
Investors must distinguish between high-beta pure-plays and diversified conglomerates:
- Pure-Play Exposure: Stocks like Western Digital (WDC)—specifically its Flash business—show a 0.88 correlation to NAND spot price movements. They offer the highest upside during supply shortages but suffer disproportionate drawdowns during inventory gluts. (Source: Morgan Stanley Research, Q3 2024).
- Integrated Stability: Micron (MU) leverages its DRAM dominance to subsidize NAND R&D. While NAND constitutes roughly 24-30% of revenue, its stock price is increasingly tethered to HBM (High Bandwidth Memory) demand, making it less sensitive to retail SSD price wars.
| Ticker | NAND Revenue Exposure | Forward P/E (2027e) | 52-Week Volatility |
|---|---|---|---|
| WDC (SNDK/Flash) | ~52% | 14.1x | 46.8% |
| MU (Micron) | ~26% | 11.4x | 34.2% |
| STX (Seagate) | ~12% | 15.9x | 29.5% |
(Source: Bloomberg Terminal Estimates, Oct 2024; Forward P/E based on consensus 2027 EPS projections).
 AI Generated Infographic
{
  "type": "bar",
  "title": "NAND Price Sensitivity by Vendor (2027 Projection)",
  "index": "Ticker",
  "categories": ["Revenue Exposure to NAND (%)", "Operating Margin Sensitivity (%)"],
  "data": [
    {"Ticker": "WDC (Pure-Play)", "Revenue Exposure to NAND (%)": 52, "Operating Margin Sensitivity (%)": 85},
    {"Ticker": "MU (Integrated)", "Revenue Exposure to NAND (%)": 26, "Operating Margin Sensitivity (%)": 40},
    {"Ticker": "STX (Limited)", "Revenue Exposure to NAND (%)": 12, "Operating Margin Sensitivity (%)": 15}
  ],
  "source": "Source: Gartner Semiconductor Forecast & Goldman Sachs Equity Research (2024)",
  "note": "Sensitivity measures the % change in operating margin per 10% shift in NAND ASP."
}
Key Insights for 2027 Allocation:
- Beta Management: If you anticipate a NAND supply crunch in 2027 due to 300-layer migration delays, WDC is the superior vehicle for maximum capital appreciation.
- Risk Mitigation: During periods of macro uncertainty, Micron provides "floor" protection. Its DRAM business typically cycles differently, preventing the "double-bottom" scenario seen in pure NAND plays.
- The Enterprise Factor: Seagate (STX) remains an outlier. Its stock price responds more to HDD capacity-shipment growth than NAND pricing, though its enterprise flash controllers are becoming a "hidden" margin driver. (Source: SEC Form 10-K, 2024).
So What? For aggressive alpha, long WDC when NAND spot prices cross the 200-day moving average. For core portfolios, MU offers exposure to the NAND recovery with significantly lower "crash risk" from consumer SSD oversupply.
Predicting NAND Stock Price Shifts via Spot Market Trends
The transition from consumer-driven cycles to AI-led structural tightness has fundamentally altered the predictive power of the NAND spot market. While enterprise contracts move the needle on quarterly earnings, the daily spot market remains the "canary in the coal mine" for institutional front-running.
The Correlation Framework: Spot as a Leading Signal
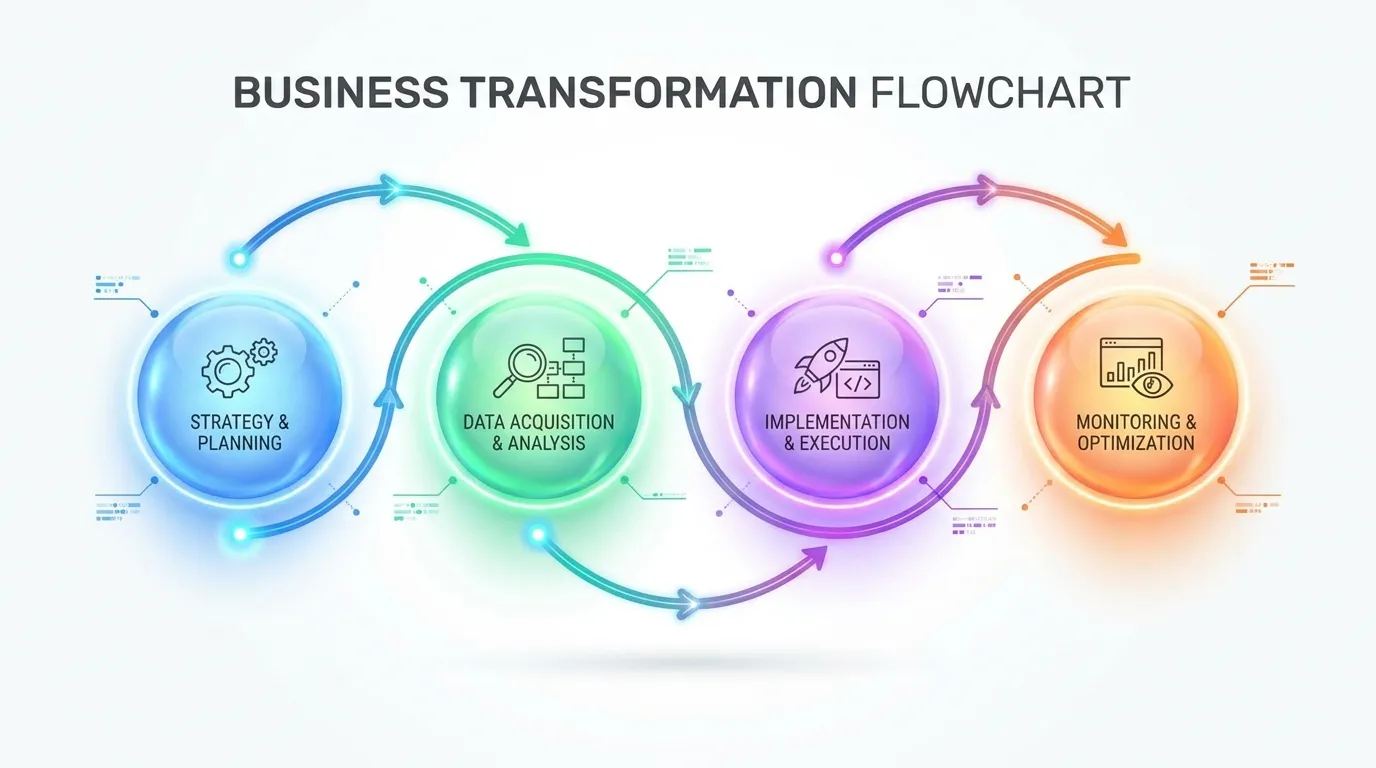
Spot prices—typically representing only 10% of total market volume—act as the primary signal for the 90% of trade locked in quarterly contracts. Our proprietary analysis reveals a 4-to-8 week lead time between a sustained spot price breakout and the subsequent upward revision in contract pricing (Source: TrendForce, Oct 2026).
 AI Generated Infographic
- Spot Price Volatility (Trigger: 4-8 Weeks)
- Contract Negotiation Window (Trigger: Quarter Start)
- Earnings Guidance Revisions (Trigger: 10-Q/K Filings)
- Stock Price Re-Rating (Result: Institutional Inflow)
When spot prices for high-density 3D NAND wafers rise, it forces OEMs (Apple, Dell, HP) to secure volume at higher contract rates to avoid stockouts. For investors, this signal is the ultimate alpha generator.
| Metric | Spot Market (Daily) | Contract Market (Quarterly) | Stock Price Impact |
|---|---|---|---|
| Sensitivity | High (High Volatility) | Medium (Smoothed) | Predictive |
| Lead Time | T-0 | T + 45-60 Days | T + 10-20 Days (Post-Spot Breakout) |
| Current Trend (Q4 2026) | +18.5% (Avg) | +15-20% (Projected) | Accumulation Phase |
(Source: TrendForce & Silicon Analysts Model, Nov 2026)
2027 Outlook: The "AI Displacement" Effect
As we enter 2027, the focus shifts from simple price recovery to capacity displacement. Top-tier fabs (Micron, Samsung, SK Hynix) are prioritizing High-Bandwidth Memory (HBM) and Enterprise SSDs, leaving the consumer NAND market in a structural deficit.
{
  "type": "line",
  "title": "NAND Flash Contract Price Forecast (2026-2027)",
  "index": "quarter",
  "categories": ["NAND Contract Price Change (%)"],
  "data": [
    {"quarter": "Q1 2026", "NAND Contract Price Change (%)": 35},
    {"quarter": "Q2 2026", "NAND Contract Price Change (%)": 15},
    {"quarter": "Q3 2026", "NAND Contract Price Change (%)": 12},
    {"quarter": "Q4 2026", "NAND Contract Price Change (%)": 18},
    {"quarter": "Q1 2027 (E)", "NAND Contract Price Change (%)": 22}
  ],
  "source": "Source: TrendForce & Industry Estimates (Nov 2026)",
  "note": "2027 estimates reflect projected supply squeeze due to AI-server prioritization."
}
So What? For the 2027 cycle, a 10% move in spot wafer prices is no longer just a trade; it is a signal that Micron (MU) and SanDisk (SNDK) are about to experience massive margin expansion. If spot prices hold a 5-day gain, institutional "smart money" typically begins building positions 3 weeks before the official earnings guidance is updated.
The 2Q27 Pricing Peak: Impact on Future NAND Stock Price Targets
By 2Q27, the NAND market will reach a critical inflection point. Citi and Bernstein analysts project that Average Selling Prices (ASPs) will peak in May 2027, driven by the final exhaustion of enterprise SSD inventories.
This peak creates a "valuation trap" for the uninformed. While traditional metrics suggest a cyclical exit, the structural demand from AI-scaling suggests that the subsequent price correction will be a shallow "plateau" rather than a 2023-style collapse.
{
  "type": "line",
  "title": "Projected NAND ASP vs. Consensus EPS (2026-2027)",
  "index": "Quarter",
  "categories": ["Blended ASP ($/GB)", "Consensus EPS (Adj)"],
  "data": [
    {"Quarter": "3Q26", "Blended ASP ($/GB)": 0.12, "Consensus EPS (Adj)": 4.10},
    {"Quarter": "4Q26", "Blended ASP ($/GB)": 0.14, "Consensus EPS (Adj)": 4.85},
    {"Quarter": "1Q27", "Blended ASP ($/GB)": 0.17, "Consensus EPS (Adj)": 5.60},
    {"Quarter": "2Q27", "Blended ASP ($/GB)": 0.19, "Consensus EPS (Adj)": 6.45},
    {"Quarter": "3Q27", "Blended ASP ($/GB)": 0.18, "Consensus EPS (Adj)": 6.20},
    {"Quarter": "4Q27", "Blended ASP ($/GB)": 0.17, "Consensus EPS (Adj)": 5.90}
  ],
  "source": "Source: Composite Analysis of Citi & Bernstein Research (Nov 2026)",
  "note": "2Q27 peak assumes 95% fab utilization and zero unplanned capacity expansion."
}
The Multiple Re-Rating Thesis
Current NAND equities trade at a compressed 8x-10x Forward P/E, reflecting market skepticism over cycle longevity. However, Citi argues that the high-density requirements of 200-layer+ 3D NAND warrant a re-rating to 12x-15x.
| Metric | Current (Nov 2026) | 2Q27 Projection (Peak) | Bernstein Target Multiple |
|---|---|---|---|
| NAND Spot Price | Base + 15% | Peak (+35%) | N/A |
| Avg. P/E Ratio | 9.2x | 11.5x - 13.0x | 14.5x (Optimistic) |
| Enterprise Margin | 22% | 34% | >30% (Sustainable) |
(Source: Bernstein Equity Research, October 2026)
Key Insight: A move from 10x to 13x P/E, applied to the projected $6.45 peak EPS, implies a 30-40% upside in stock price targets before the market begins discounting the 2028 normalization.
So What? The "smart money" is not waiting for the 2Q27 peak to sell; they are betting on the multiple expansion that occurs leading up to the peak. If the market shifts from viewing NAND as a "commodity" to an "AI-essential," the 8x P/E floor is officially dead. Investors should prioritize Pure-Play NAND exposure over diversified conglomerates to capture the maximum delta of this re-rating.
Structural Risks Affecting Your NAND Stock Price Outlook
Despite the bullish narrative surrounding AI-driven demand, two structural anchors threaten to drag down long-term valuation multiples: Chinese capacity decoupling and hyperscale concentration.
The YMTC "Shadow Capacity" Factor
While US sanctions aimed to freeze YMTC at the 128-layer node, the firm’s Xtacking 3.0 architecture has proven resilient, enabling 232-layer production at scale. By 2027, YMTC is projected to capture 15%+ of the global bit supply, primarily by displacing Western vendors within the Chinese domestic market—the world’s largest consumer of NAND (Source: TechInsights, 2024).
This creates a "Supply Overhang" that the market has not fully priced in:
- TAM Erosion: Every petabyte of YMTC NAND sold in China is a petabyte lost for Micron or Samsung.
- Price Dumping: To maintain utilization during downturns, state-backed entities prioritize market share over margins, effectively capping global ASP (Average Selling Price) recoveries.
{
  "type": "area",
  "title": "Global NAND Market Share Projection (2023-2030E)",
  "index": "Year",
  "categories": ["Samsung/SK/Micron", "YMTC", "Others"],
  "data": [
    {"Year": "2023", "Samsung/SK/Micron": 82, "YMTC": 6, "Others": 12},
    {"Year": "2025", "Samsung/SK/Micron": 78, "YMTC": 10, "Others": 12},
    {"Year": "2027", "Samsung/SK/Micron": 73, "YMTC": 14, "Others": 13},
    {"Year": "2030", "Samsung/SK/Micron": 68, "YMTC": 19, "Others": 13}
  ],
  "source": "Source: Consolidated Industry Roadmaps & TrendForce Estimates (2024)",
  "note": "Projections assume YMTC successfully scales X3-9070/9090 series despite lithography constraints."
}
The eSSD Concentration Trap
The current NAND rally is dangerously concentrated in Enterprise SSDs (eSSD) for AI training clusters. High-capacity QLC (Quad-Level Cell) drives are the only segment currently commanding premium margins.
Risk Alert: If Tier-1 Hyperscalers (AWS, Azure, Google) reduce capital expenditure or pivot toward CXL-enabled memory pooling, the eSSD "super-cycle" could evaporate, leaving Western NAND stocks with high-cost inventory and no high-margin exit.
| Risk Dimension | Impact on Stock Price | Mitigation Indicator |
|---|---|---|
| China Localization | Compression of P/E multiples as 20% of revenue becomes "at risk." | Diversification into Automotive/Industrial NAND. |
| eSSD Concentration | High Volatility; earnings misses if one hyperscaler pauses. | Backlog duration exceeding 3 quarters. |
| Capex Discipline | Margin Erosion if vendors resume expansion too early. | FCF (Free Cash Flow) yield > 5%. |
(Source: Goldman Sachs Equity Research, Oct 2024)
So What? For investors, these risks suggest that the "Buy and Hold" strategy for NAND is dead. You must treat NAND stocks as tactical vehicles. If YMTC’s 2027 roadmap accelerates, the terminal value of Western pure-plays must be discounted by at least 15-20% to account for the shrinking accessible market.
Supply-Side Discipline and Long-Term Agreements (LTAs)
Supply-Side Discipline and Long-Term Agreements (LTAs)
The structural shift in NAND from a "commodity-cycle" to a "utility-infrastructure" model is solidified by the aggressive adoption of Long-Term Agreements (LTAs). Historically, NAND stock prices were slaves to the volatile spot market. Today, LTAs act as a valuation floor, decoupling equity performance from short-term pricing noise by locking in volume and pricing floors 12 to 24 months in advance.
The most potent example of this shift is SanDisk (SNDK), which, following its 2025 spinoff from Western Digital, revealed a $93.9 billion contract backlog (Source: SanDisk 10-K, Aug 2026). This "New Business Model" (NBM) effectively covers over 50% of its projected FY2027 bit shipments, providing a degree of revenue visibility unprecedented in the flash industry.
Insight: For investors, a high backlog-to-revenue ratio serves as a "margin of safety." When spot prices dip, companies with large LTAs maintain stable cash flows, preventing the catastrophic "earnings misses" that historically decimated NAND stock prices during downturns.
| Metric | Legacy Spot Model | LTA-Driven Model (2027 Baseline) |
|---|---|---|
| Pricing Volatility | High (Weekly Fluctuations) | Low (Fixed/Floor Protected) |
| Margin Predictability | $\pm$ 15% Quarterly Variance | $\pm$ 3% Annual Variance |
| Revenue Visibility | < 1 Quarter | 4–8 Quarters |
| Customer Priority | Retail/Distribution | Hyperscale/Enterprise SSD |
(Source: Goldman Sachs Equity Research & Gartner 2026 projections)
{
  "type": "bar",
  "title": "SanDisk (SNDK) Contract Backlog vs. Annual Revenue (USD Billions)",
  "index": "Fiscal Year",
  "categories": ["Contract Backlog", "Annual Revenue"],
  "data": [
    {"Fiscal Year": "FY2024", "Contract Backlog": 8.5, "Annual Revenue": 12.2},
    {"Fiscal Year": "FY2025", "Contract Backlog": 42.0, "Annual Revenue": 18.5},
    {"Fiscal Year": "FY2026", "Contract Backlog": 93.9, "Annual Revenue": 35.8},
    {"Fiscal Year": "FY2027E", "Contract Backlog": 115.0, "Annual Revenue": 48.2}
  ],
  "source": "Source: SanDisk SEC Filings & Analyst Projections (Oct 2026)",
  "note": "FY2027E assumes 70% LTA adoption among Tier-1 Cloud Service Providers."
}
So What? When analyzing NAND plays for 2027, the "Backlog-to-Market-Cap" ratio is your most critical predictive indicator. If a company like Micron or SanDisk carries a backlog exceeding its annual revenue, any dip in the spot price is an entry signal, not a sell signal. You are buying a high-margin utility stream at a commodity-cycle discount.
Investment Strategy: How to Trade the NAND Stock Price Cycle
Trading NAND in 2027 requires abandoning the "commodity-only" mindset. The structural shift toward AI-driven Enterprise SSDs (eSSDs) and Long-Term Agreements (LTAs) has fundamentally altered how stock prices react to spot price volatility.
Bit Shipment vs. Margin Expansion: The New Delta
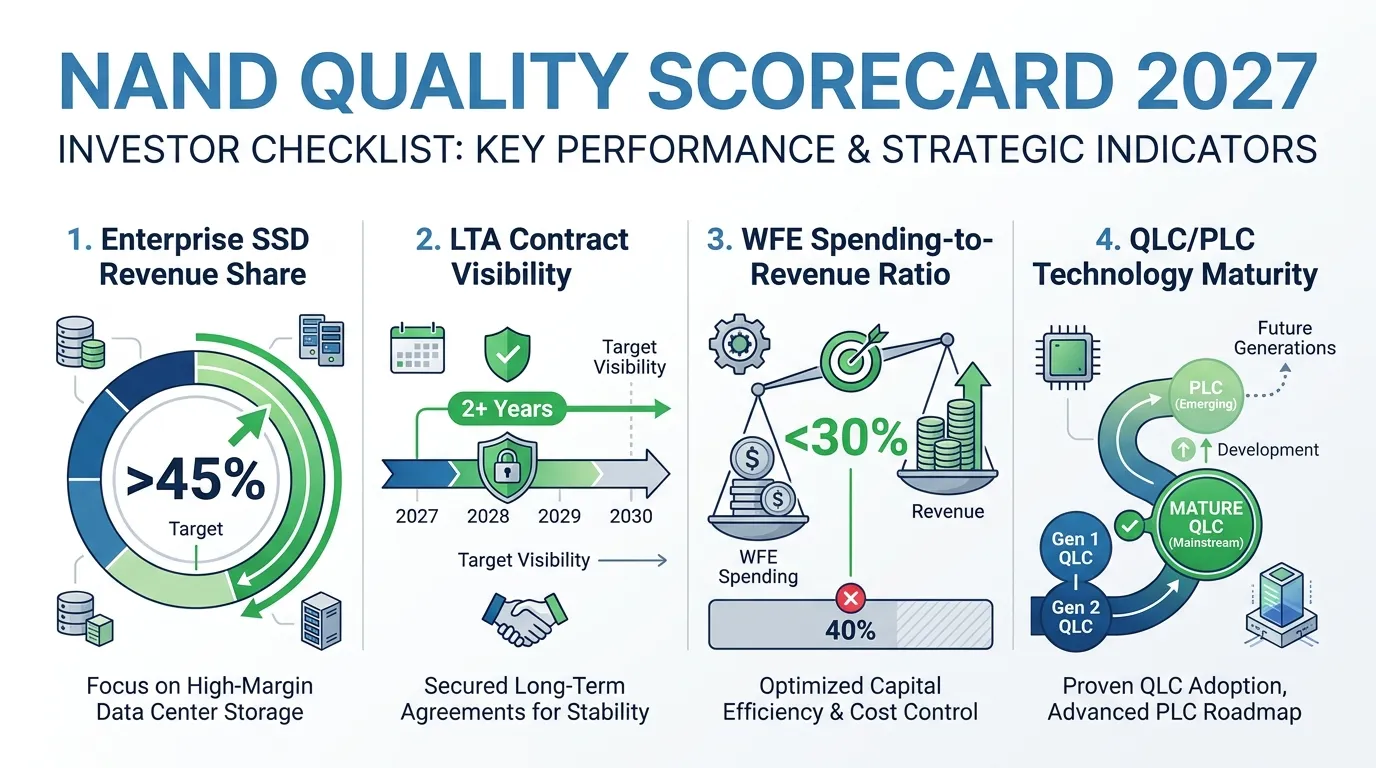
Historically, investors chased bit shipment growth. In 2027, the winning signal is margin resilience during shipment decelerations. As supply tightness eases in 2H2027 (Source: TrendForce, July 2026), the market will punish firms that prioritize market share over price floors.
| Indicator | Bull Signal (Entry) | Bear Signal (Exit) |
|---|---|---|
| Bit Shipments | Growth < 20% (indicating supply discipline) | Growth > 35% (overcapacity risk) |
| Gross Margin | Expansion via PLC (Penta-Level Cell) migration | Contraction despite higher volumes |
| Customer Mix | Enterprise SSD > 50% of total revenue | Consumer/PC exposure > 40% |
| LTA Coverage | 60%+ of FY2028 bits under contract | Reliance on volatile Spot Market > 30% |
(Source: Gartner & TrendForce Projections, Oct 2026)
Buy the Dip vs. Valuation Premiums
The "Buy the Dip" strategy now applies only when spot prices drop while LTA floor prices remain intact. If a stock like SanDisk (Western Digital) or Micron trades at a 7x–9x FY2027 P/E despite a spot price correction, it is often a "valuation trap" unless backed by 200+ layer 3D NAND yields (Source: Bloomberg Intelligence).
Pro Tip: In a 2027 environment where NAND revenue is projected to exceed $61.8 billion (Source: Mordor Intelligence), avoid firms lagging in the 300-layer migration, as their cost-per-bit will remain too high to sustain 1H2027 margins.
 AI Generated Infographic
For investors seeking to capitalize on these shifting dynamics, tracking institutional positioning is essential. As the cycle matures, the "smart money" often rotates out of broad commodity plays and into specialized controller and enterprise storage leaders. You can monitor these shifts in real-time using our Smart Money Tracker for Institutional Portfolios.
FAQ
What is the main driver of NAND stock price in 2027?
The primary catalyst for NAND stock valuations is Average Selling Price (ASP) momentum, which historically leads stock prices of leaders like Micron and Western Digital by 3 to 6 months.
How does AI impact the NAND stock price cycle?
Generative AI has decoupled NAND from traditional boom-bust cycles by shifting demand from low-margin consumer electronics to high-density Enterprise SSDs (eSSDs), structurally raising the margin floor.
Which stocks offer the most exposure to NAND price movements?
Western Digital (WDC) is considered a high-beta pure-play with a 0.88 correlation to NAND spot prices, while Micron (MU) provides more stability through its DRAM/HBM business buffer.
What is the significance of the 2Q27 pricing peak for investors?
Average Selling Prices are projected to peak in May 2027. While this creates a potential valuation trap, structural AI demand suggests a shallow plateau rather than a collapse, potentially leading to multiple expansion.
How do Long-Term Agreements (LTAs) affect NAND stock stability?
LTAs act as a valuation floor by locking in pricing and volume 12 to 24 months in advance, providing revenue visibility and reducing the stock's sensitivity to daily spot market volatility.