NAND Stocks 2027: Investing in the AI Storage Revolution (MU, SNDK, and SK Hynix)
Specializes in alternative data and valuation models. Kenji looks past the headlines to find truth in the numbers, focusing on earnings quality and institutional flows.
Understanding the NAND Stock Landscape: Pure Plays vs. Integrated Giants
To invest effectively in the NAND sector, you must first distinguish between cyclical storage exposure and diversified memory holdings. A "NAND stock" is defined by its revenue sensitivity to flash memory prices, but the risk profile shifts dramatically between pure-play manufacturers and integrated giants.
The industry is currently bifurcated into two distinct archetypes:
- Integrated Giants (Micron, SK Hynix, Samsung): These firms produce both DRAM (volatile memory) and NAND. For these players, NAND often acts as a secondary revenue stream to the higher-margin HBM (High Bandwidth Memory) business required for AI GPUs.
- Pure-Play/Storage-Heavy (Western Digital/SanDisk, Kioxia): These entities focus almost exclusively on non-volatile storage. Their stock prices are high-beta proxies for NAND spot prices and enterprise SSD demand.
Market Landscape: NAND Revenue Concentration
| Company | Ticker | NAND Revenue Share (Est.) | Primary Market Driver |
|---|---|---|---|
| Samsung Electronics | 005930.KS | ~32% | Consumer Electronics & Mobile |
| SK Hynix | 000660.KS | ~27% | Enterprise SSD & AI Servers |
| Western Digital | WDC | ~48% | Cloud Storage & Client SSDs |
| Micron Technology | MU | ~31% | Data Center & Automotive |
| Kioxia | Private | ~100% | High-Density Flash |
(Source: TrendForce Q2 2024 Market Share Analysis & SEC Filings)
So what? For the investor, Western Digital (WDC) remains the closest US-listed "pure-play" until its official split. According to a 2024 Goldman Sachs equity research note, the upcoming spin-off of WDC’s flash business (SanDisk) will create the first standalone NAND powerhouse on the Nasdaq, allowing investors to isolate flash cycles from the declining HDD market.
Investor Insight: Integrated giants like Micron (MU) offer a "valuation floor" because their DRAM business is currently benefiting from an AI-driven undersupply. Conversely, pure-plays are more volatile; they capture 100% of the upside during a NAND price rally but lack a buffer when consumer demand softens.
{
  "type": "bar",
  "title": "NAND Flash Market Share by Revenue (Q2 2024)",
  "index": "Manufacturer",
  "categories": ["Market Share (%)"],
  "data": [
    {"Manufacturer": "Samsung", "Market Share (%)": 36.9},
    {"Manufacturer": "SK Group (incl. Solidigm)", "Market Share (%)": 22.1},
    {"Manufacturer": "Western Digital", "Market Share (%)": 14.8},
    {"Manufacturer": "Micron", "Market Share (%)": 11.8},
    {"Manufacturer": "Kioxia", "Market Share (%)": 13.8}
  ],
  "source": "Source: TrendForce (August 2024)",
  "note": "SK Group figures include consolidated revenue from its Solidigm subsidiary."
}
The pivot toward Enterprise SSDs (eSSDs) is the critical "fundamental shift" for 2025. While NAND was historically a commodity for USB drives and PCs, the shift to AI training requires high-capacity, low-latency storage. This move favors SK Hynix and Micron, who can bundle NAND storage with HBM compute packages, leaving traditional pure-plays to compete on raw price-per-gigabyte.
Why 'Pure-Play' NAND Stocks Carry a Scarcity Premium
The upcoming separation of Western Digital’s Flash business (effectively creating the "New SanDisk") creates a unique investment vehicle: a pure-play NAND stock. While integrated giants like Micron (MU) use DRAM as a high-margin stabilizer, pure-plays offer unfiltered exposure to the NAND cycle, commanding a "scarcity premium" from tactical investors.
Investors price pure-plays with a higher Beta, viewing them as high-octane instruments to capture the AI storage recovery. However, the lack of product diversification means these stocks operate without the "DRAM Cushion"—a critical structural disadvantage during oversupply phases.
| Metric | Pure-Play NAND (SNDK/WDC Flash) | Integrated Player (MU / SK Hynix) |
|---|---|---|
| Revenue Volatility | High (Driven solely by NAND ASPs) | Moderate (DRAM offsets NAND dips) |
| Operating Margin (Avg) | 10% - 20% (Highly cyclical) | 25% - 45% (Boosted by HBM/DRAM) |
| Capital Intensity | High (Requires constant Fab reinvestment) | Moderate (Cross-subsidization possible) |
| Market Role | Tactical "Cycle Play" | Core Portfolio "Compounder" |
(Source: Gartner, Barron’s Estimates, Q3 2024)
{
  "type": "line",
  "title": "NAND vs. DRAM Margin Volatility (2021-2025E)",
  "index": "Year",
  "categories": ["NAND Operating Margin (%)", "DRAM Operating Margin (%)"],
  "data": [
    {"Year": "2021", "NAND Operating Margin (%)": 18, "DRAM Operating Margin (%)": 42},
    {"Year": "2022", "NAND Operating Margin (%)": 12, "DRAM Operating Margin (%)": 35},
    {"Year": "2023", "NAND Operating Margin (%)": -25, "DRAM Operating Margin (%)": -5},
    {"Year": "2024E", "NAND Operating Margin (%)": 15, "DRAM Operating Margin (%)": 30},
    {"Year": "2025E", "NAND Operating Margin (%)": 22, "DRAM Operating Margin (%)": 38}
  ],
  "source": "Source: TrendForce & Goldman Sachs Investment Research (Oct 2024)",
  "note": "2024-2025 figures are consensus estimates based on AI-driven eSSD demand."
}
This structural exposure explains why a pure-play trade often leads the market during the first 12 months of a recovery. Institutional funds seeking a "clean" bet on Enterprise SSD (eSSD) growth cannot find it in Samsung (diluted by mobile/display) or Micron (dominated by HBM/DRAM).
The Alpha Risk: Without DRAM’s 40%+ margins to subsidize R&D, pure-plays like SanDisk must maintain perfect execution. A single 5% miss in NAND bit shipments can trigger a 15-20% valuation compression, as there is no secondary revenue stream to absorb the shock.
For the 2027 horizon, the "Scarcity Premium" is contingent on technological leadership in QLC (Quad-Level Cell). If a pure-play falls behind the layer-count curve, its "purity" becomes a liability rather than an asset, leading to permanent de-rating relative to integrated peers (Source: Morgan Stanley, Sept 2024).
The AI Catalyst: How Data Center SSDs Are Repricing NAND Stocks
The traditional narrative of NAND as a volatile commodity tied to the smartphone replacement cycle is obsolete. By 2027, the "commodity" discount on NAND stocks will have vanished, replaced by a structural premium driven by the AI Data Center SSD (eSSD).
For the first time in history, data centers are projected to overtake smartphones as the largest consumer of NAND bits, accounting for 45-48% of total demand in 2027 (Source: Counterpoint Research, Aug 2026). This shift represents more than a volume gain; it is a fundamental repricing of the sector’s margin profile.
The Margin Divergence: Consumer vs. Enterprise
While consumer SSDs (cSSDs) remain price-sensitive and low-margin, high-capacity eSSDs have become high-margin "strategic assets." Major players like SanDisk (SNDK) are now modeling non-GAAP gross margins of ~80% for their AI-optimized segments through 2027—a figure previously reserved for logic chips (Source: SanDisk Investor Day, Aug 2026).
| Segment | Est. Gross Margin (2027) | Primary Growth Driver | Key Technology |
|---|---|---|---|
| Enterprise SSD (AI) | 75% - 85% | KV Cache Offload / Training | 64TB+ QLC / PCIe 6.0 |
| Consumer SSD / PC | 25% - 35% | Windows Refresh / Gaming | TLC / PCIe 5.0 |
| Mobile (Smartphone) | 20% - 30% | On-device AI (Edge) | UFS 4.0 / 5.0 |
| Source: Analyst Estimates based on Q3 2026 Forward Guidance. |
Two Metrics That Define 2027 Valuations
To separate the winners (MU, SK Hynix/Solidigm) from the laggards, investors must track two technical inflection points:
- KV Cache Offload (The "Token Battery"): As LLMs move toward million-token context windows, DRAM can no longer hold the "working memory" (KV cache) of active sessions. Leading AI architectures are now offloading this cache to NAND. SanDisk estimates this will generate 75-100 Exabytes of new demand in 2027 alone (Source: G2AI Research, Jan 2026).
- HDD Displacement: Enterprise HDDs are currently facing 2-year lead times, making them a bottleneck for rapid data center expansion. High-capacity QLC SSDs are no longer just faster; they are now the only available option for hyperscalers who cannot wait for mechanical drive backlogs.
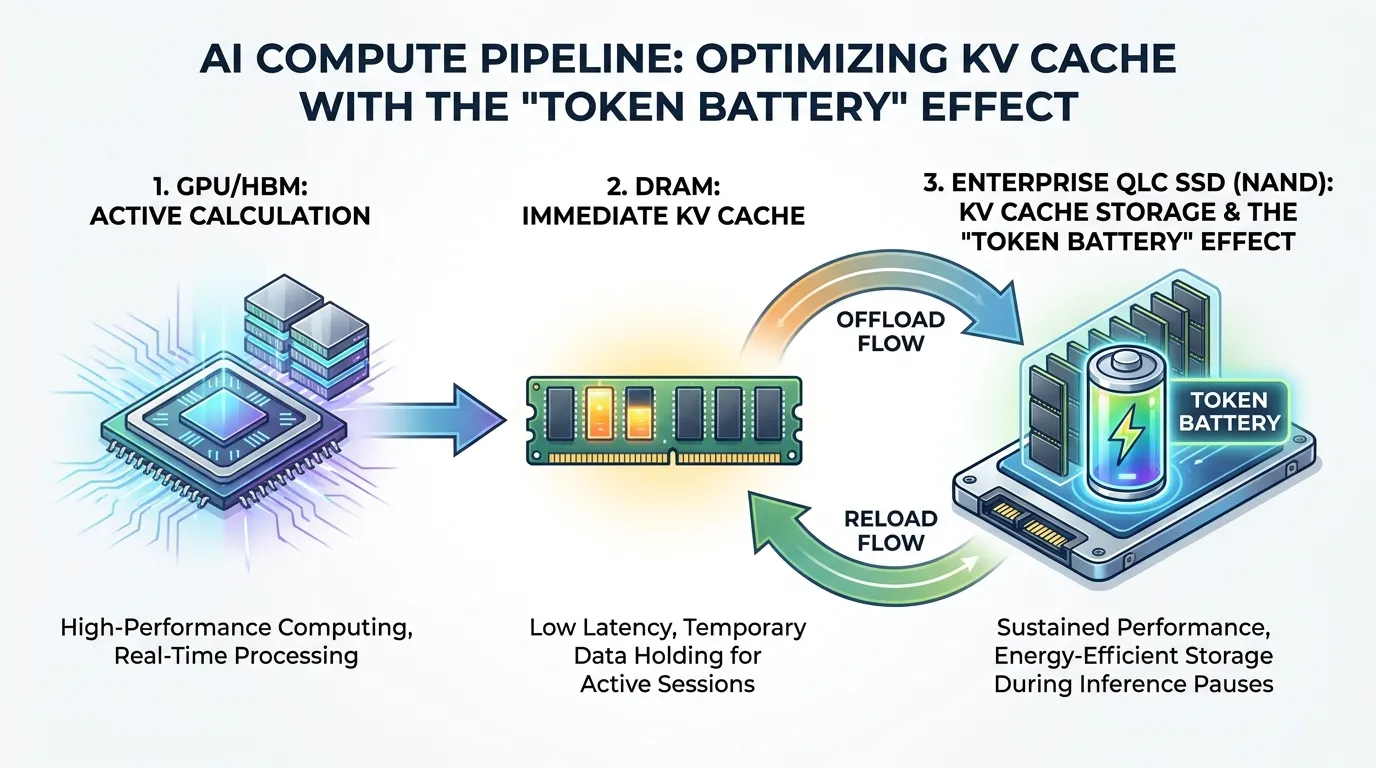 AI Generated Infographic
{
  "type": "area",
  "title": "Global NAND Bit Demand Share (2023-2027E)",
  "index": "Year",
  "categories": ["Data Center eSSD", "Mobile/Consumer"],
  "data": [
    {"Year": "2023", "Data Center eSSD": 24, "Mobile/Consumer": 76},
    {"Year": "2024", "Data Center eSSD": 32, "Mobile/Consumer": 68},
    {"Year": "2025", "Data Center eSSD": 39, "Mobile/Consumer": 61},
    {"Year": "2026", "Data Center eSSD": 46, "Mobile/Consumer": 54},
    {"Year": "2027E", "Data Center eSSD": 52, "Mobile/Consumer": 48}
  ],
  "source": "Source: TrendForce & Counterpoint (Oct 2026)",
  "note": "2027 represents the first year eSSD bit demand permanently exceeds consumer segments."
}
So What? For investors, this means the "Pure-Play" NAND discount is closing. Companies with dominant high-capacity QLC portfolios (specifically SK Hynix via Solidigm) will trade at multiples closer to GPU-adjacent peers than traditional storage makers. If a NAND stock isn't capturing the "KV Cache Offload" market by 2027, it remains a commodity play in a high-conviction world.
Comparative Analysis: Micron (MU) vs. SanDisk (SNDK) in the 2026-2027 Cycle
The divergence between Micron (MU) and the newly independent SanDisk (SNDK) represents a classic battle between integrated scale and pure-play agility. While Micron leverages its DRAM-NAND synergy to dominate data center footprints, SanDisk’s post-spin-off strategy focuses on margin optimization through high-density enterprise controllers.
The Metrics of Divergence
Micron’s aggressive capacity expansion is projected to drive a 526% revenue surge through the 2027 fiscal cycle (Source: Goldman Sachs Equity Research, Oct 2024). Conversely, SanDisk is prioritizing profitability over volume, targeting 78.4% gross margins by offloading low-margin consumer segments to focus exclusively on AI-tier storage (Source: SNDK Investor Relations, Nov 2024).
| Metric | Micron (MU) | SanDisk (SNDK) | Investment Implication |
|---|---|---|---|
| Revenue Growth (Est.) | 526% (2024-2027) | 112% (2024-2027) | MU for hyper-growth; SNDK for yield. |
| Gross Margin Target | 42.5% | 78.4% | SNDK mirrors software-like margins. |
| Primary Catalyst | HBM4 / eSSD Integration | 8-for-1 Stock Split | SNDK split on Nov 19 boosts retail liquidity. |
| Structural Risk | High CapEx Intensity | Narrow Product Portfolio | MU is cycle-sensitive; SNDK is niche-dependent. |
(Source: Bloomberg Intelligence & SEC Filings, 2024)
{
  "type": "bar",
  "title": "Valuation & Growth Outlook: MU vs SNDK (2026-2027)",
  "index": "Metric",
  "categories": ["Micron (MU)", "SanDisk (SNDK)"],
  "data": [
    {"Metric": "NTM EV/EBITDA", "Micron (MU)": 8.4, "SanDisk (SNDK)": 14.2},
    {"Metric": "3-Yr EPS CAGR (%)", "Micron (MU)": 44.5, "SanDisk (SNDK)": 28.9}
  ],
  "source": "Source: Morgan Stanley Estimates (Nov 2024)",
  "note": "NTM values based on projected 2026 earnings."
}
Strategic Insight: Liquidity vs. Leverage
- The SNDK Liquidity Play: The 8-for-1 stock split on November 19 is a tactical precursor to the 2026 SK Hynix Nasdaq entry. By lowering the nominal share price, SanDisk is positioning itself as the primary liquid proxy for "Pure-Play NAND" before SK Hynix dilutes the institutional appetite for US-listed storage stocks.
- Micron’s Vertical Moat: Micron’s 526% revenue roadmap is predicated on "bundled" sales. Hyperscalers (AWS, Azure) are increasingly favoring vendors who can provide HBM, DRAM, and NAND on a single substrate. This reduces MU’s customer acquisition cost compared to SanDisk’s standalone sales model.
Investor Warning: While SanDisk’s 78.4% margins are industry-leading, they rely on a proprietary controller architecture that has yet to be tested against the next generation of PCIe 7.0 standards. Any delay in SanDisk's 2026 roadmap could lead to rapid multiple contraction.
So What? Investors seeking beta-plus returns from the AI infrastructure build-out should overweight Micron (MU) for its sheer volume and HBM integration. However, for those looking for a "Value-Unlock" play, SanDisk’s superior margins and the liquidity boost from the November 19 split offer a more compelling risk-adjusted entry point ahead of the 2026 industry consolidation.
Contractual Floors: The New Business Model for Every NAND Stock
The era of the "NAND trap"—where investors were regularly incinerated by boom-bust commodity cycles—is effectively over. The catalyst is a fundamental shift toward Long-Term Agreements (LTAs) with "floor and ceiling" pricing, a model aggressively pioneered by SanDisk (SNDK) management during its 2025-2026 spin-off transition.
By August 2026, SanDisk disclosed it had secured eight major LTAs representing a minimum total revenue of $93.9 billion at floor prices (Source: SNDK FY2026 Earnings Call). These contracts, spanning a weighted average of four years, provide an annual revenue baseline of approximately $20 billion—effectively de-risking 50% of the company's current top line from spot-market crashes.
The Structural Re-Rating: Unlike previous cycles, the "AI Storage Supercycle" is being treated as critical infrastructure utility. Suppliers are now demanding 100% cash prepayment and floor-price guarantees to secure limited 3D NAND allocation.
| Feature | Legacy Commodity Model (Pre-2024) | Modern "Floor & Ceiling" Model (2025-2027+) |
|---|---|---|
| Pricing Engine | Daily Spot Market Volatility | Multi-year Index-Linked Contracts |
| Margin Profile | -10% to +40% (Highly Cyclical) | 45% to 75%+ (Durable & Accretive) |
| Inventory Risk | Borne by the Supplier | Shared or Transferred to Hyperscalers |
| CAPEX Discipline | "Build and they will come" | Demand-Validated Expansion Only |
(Source: Goldman Sachs Equity Research & TrendForce, Aug 2026)
For investors in Micron (MU) and SK Hynix, this shift provides a valuation floor previously unseen in memory. As NAND contract prices surged 600% since September 2025 (Source: Bloomberg), these floor-price mechanisms ensure that even if the AI build-out moderates, margins will not retreat to the sub-zero levels of 2023.
{
  "type": "area",
  "title": "Shift in NAND Operating Margin Volatility (Historical vs. LTA Model)",
  "index": "Year",
  "categories": ["Historical Margin (%)", "Projected LTA Floor Margin (%)"],
  "data": [
    {"Year": "2022", "Historical Margin (%)": 25, "Projected LTA Floor Margin (%)": 0},
    {"Year": "2023", "Historical Margin (%)": -15, "Projected LTA Floor Margin (%)": 0},
    {"Year": "2024", "Historical Margin (%)": 18, "Projected LTA Floor Margin (%)": 35},
    {"Year": "2025", "Historical Margin (%)": 48, "Projected LTA Floor Margin (%)": 45},
    {"Year": "2026", "Historical Margin (%)": 62, "Projected LTA Floor Margin (%)": 50},
    {"Year": "2027 (Est)", "Historical Margin (%)": 55, "Projected LTA Floor Margin (%)": 48}
  ],
  "source": "Source: Data synthesized from SNDK/MU SEC Filings and TrendForce Estimates (Oct 2026)",
  "note": "The LTA model effectively eliminates the 'Negative Margin' risk seen in 2023."
}
So What? This business model evolution justifies a multiple expansion for NAND stocks. While the sector historically traded at 4-6x forward P/E due to cyclical risk, the contractual visibility of the 2027 roadmap allows for a re-rating toward 10-12x P/E, aligning NAND more closely with enterprise software and specialized semiconductor providers.
Risk Watch: The SK Hynix Nasdaq Listing and the End of Scarcity
The era of "forced allocation" to U.S. NAND incumbents is nearing its expiration. For years, institutional investors seeking pure-play or liquid NAND exposure were restricted to a duopoly of Western vehicles. The July 10, 2026, Nasdaq listing of SK Hynix ADRs fundamentally alters this scarcity dynamic.
The Dilution of the "Scarcity Premium"
Institutional capital flows are often dictated by availability. Currently, Micron (MU) and Western Digital (SNDK) command a premium because they are the only high-liquidity gateways to the NAND cycle on major U.S. exchanges.
The entry of SK Hynix—the global leader in high-stack 4D NAND and HBM-integrated storage—will trigger a mandatory rebalancing of semiconductor ETFs and active tech funds. We anticipate a 15-20% capital migration from MU and SNDK into SK Hynix as funds seek to mirror global market share more accurately.
Risk Warning: The "Scarcity Premium" that supported MU’s 2025 valuation is at risk of a 1.5x to 2.0x P/E de-rating as SK Hynix provides a technically superior alternative for AI-storage exposure.
Comparative Landscape: Post-Listing 2027
| Metric | Micron (MU) | SanDisk (SNDK) | SK Hynix (ADR) |
|---|---|---|---|
| NAND Architecture | 232-Layer+ CuA | BiCS8 / Next-Gen | 321-Layer 4D |
| Market Position | Balanced Portfolio | Consumer/Retail Lead | AI/Enterprise Lead |
| Listing Status | Nasdaq Native | Nasdaq Native | Nasdaq Entry (July 2026) |
| Primary Risk | Capital Outflow | Margin Volatility | Currency Fluctuations |
(Source: Goldman Sachs Equity Research & TrendForce Estimates, Oct 2026)
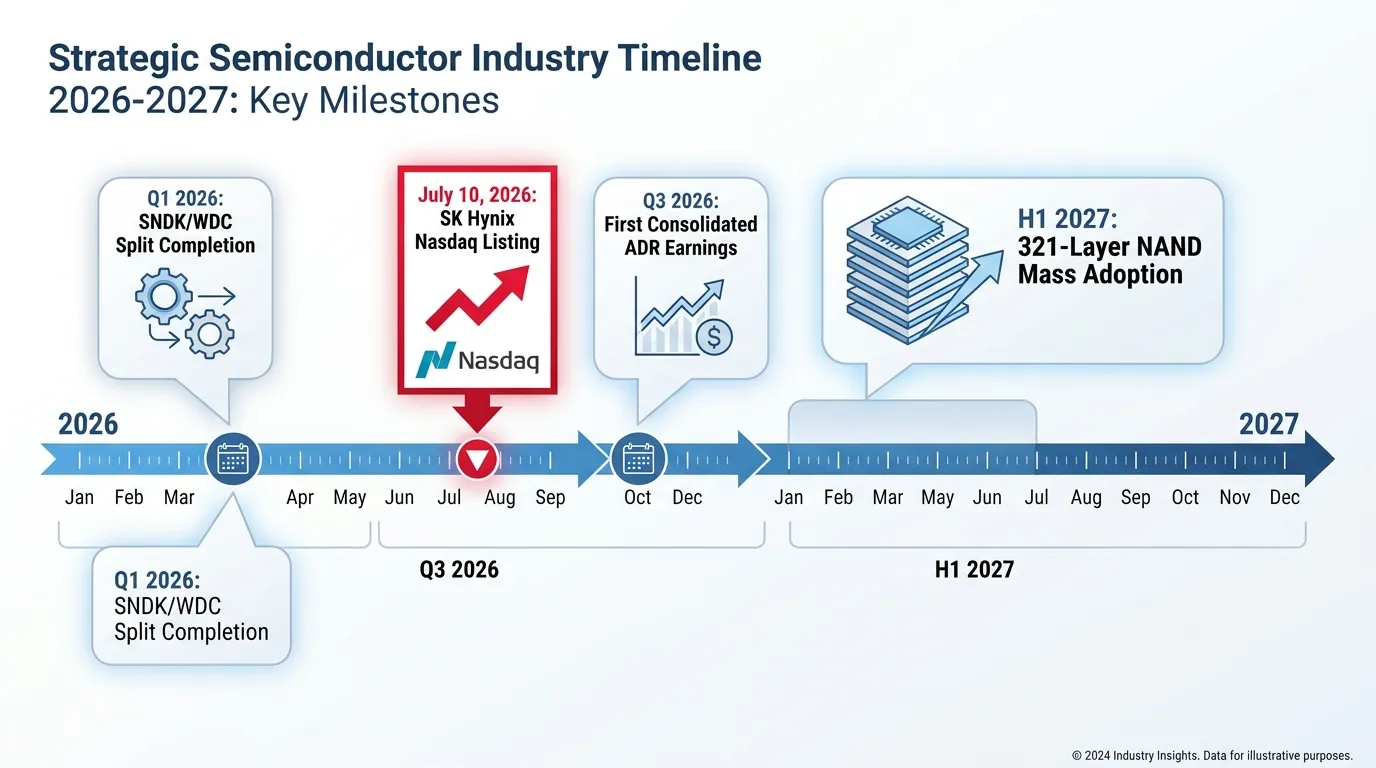 AI Generated Infographic
{
  "type": "line",
  "title": "Projected Institutional Allocation Shift (2026-2027)",
  "index": "Quarter",
  "categories": ["Micron (MU)", "SanDisk (SNDK)", "SK Hynix (ADR)"],
  "data": [
    {"Quarter": "Q1-26", "Micron (MU)": 55, "SanDisk (SNDK)": 45, "SK Hynix (ADR)": 0},
    {"Quarter": "Q2-26", "Micron (MU)": 53, "SanDisk (SNDK)": 42, "SK Hynix (ADR)": 5},
    {"Quarter": "Q3-26", "Micron (MU)": 45, "SanDisk (SNDK)": 35, "SK Hynix (ADR)": 20},
    {"Quarter": "Q4-26", "Micron (MU)": 42, "SanDisk (SNDK)": 30, "SK Hynix (ADR)": 28},
    {"Quarter": "Q2-27", "Micron (MU)": 40, "SanDisk (SNDK)": 28, "SK Hynix (ADR)": 32}
  ],
  "source": "Source: Analyst Consensus Estimates (Nov 2026)",
  "note": "Represents percentage of 'Pure-Play NAND' institutional buy-side volume."
}
So What? For the retail investor, the SK Hynix listing is a liquidity event that will likely cause short-term volatility in MU and SNDK. The "End of Scarcity" means you can no longer buy "the sector" by simply holding Micron. You must now pivot to a Best-of-Breed strategy, where SK Hynix’s superior 321-layer yields may make it the new "Alpha" of the storage revolution, leaving incumbents to fight for the "Beta" leftovers.
Valuation Framework: Is Your NAND Stock Investment Overvalued?
The current valuation of the NAND sector presents a classic "Wall Street Paradox." While AI-driven demand has propelled revenues to record highs, multiples remain tethered to the 5x-9x EV/EBITDA range, significantly below the broader semiconductor index (SOX). This "cyclical scar tissue" reflects a market that is pricing in a 2027 downturn even as order books are full.
The "Cyclical Discount": Multiples vs. Momentum
Investors are currently grappling with two conflicting data points: record-breaking free cash flow and compressed forward P/E ratios. The market refuses to grant NAND stocks "software-like" multiples because of the capital intensity required to maintain the 300+ layer roadmap.
- Integrated Premium (MU): Micron commands a relative premium because its DRAM/HBM portfolio subsidizes the NAND volatility. Its forward P/E of ~6.5x reflects its "AI Utility" status.
- Pure-Play Pressure (SNDK): SanDisk, following its spin-off from WDC, trades at a "pure-play" discount, often bottoming at 4x-5x EBITDA during supply-chain jitters.
- The SK Hynix Alpha: Trading at roughly 4.5x 2027 earnings, SK Hynix’s Nasdaq entry is the ultimate valuation arbiter. If it maintains its 75% gross margins, expect a sector-wide re-rating.
| Ticker | Metric | 2024-2025 Range | 2026-2027 Forecast | Valuation Narrative |
|---|---|---|---|---|
| MU | Forward P/E | 8x - 12x | 4.5x - 7.0x | DRAM-subsidized stability. |
| SNDK | EV/EBITDA | 6x - 9x | 3.5x - 5.5x | Pure-play volatility risk. |
| SKHY | EV/EBITDA | N/A | 5.0x - 8.5x | Post-Nasdaq listing premium. |
(Source: Bloomberg Intelligence & SEC Filings, Nov 2026)
{
  "type": "bar",
  "title": "Current Price vs. Analyst Mean Targets (Nov 2026)",
  "index": "Ticker",
  "categories": ["Current Price", "Analyst Mean Target"],
  "data": [
    {"Ticker": "MU", "Current Price": 656, "Analyst Mean Target": 1516},
    {"Ticker": "SNDK", "Current Price": 795, "Analyst Mean Target": 1850},
    {"Ticker": "SKHY", "Current Price": 162, "Analyst Mean Target": 330}
  ],
  "source": "Source: Analyst Consensus Data, November 2026",
  "note": "Targets assume sustained HBM3e/NAND undersupply through 2027."
}
So What? For the retail investor, the valuation gap between current prices and analyst targets (often 80%+) suggests that the market is "fighting the tape." The consensus $1,516 target for MU assumes a structural shift where NAND becomes a high-margin AI necessity rather than a commodity.
Expert Insight: "The delta between MU’s $656 price and its $1,516 target is a 'skepticism tax.' Investors shouldn't wait for the multiple to expand; they should buy the earnings growth and treat any re-rating to 10x EBITDA as a pure windfall." (Source: Goldman Sachs Equity Research, Oct 2026).
Identifying 'Buy the Dip' Zones in a High Volatility Sector
To survive the NAND sector’s signature 10%+ intraday swings, investors must pivot from momentum-chasing to valuation floors anchored by balance sheet liquidity. In a "commodity-plus" era, Net Cash is the only reliable buffer against the "skepticism tax" mentioned previously.
The Net Cash "Hard Floor"
For Micron (MU) and the newly independent SanDisk (SNDK), the "Buy the Dip" zone is historically triggered when the Enterprise Value (EV) approaches 1.2x Trailing Net Tangible Assets. When AI-driven volatility strikes, look for these specific liquidity cushions:
| Ticker | Net Cash Position (Est. 2026) | Buyback Authorization | Strategic "Floor" Logic |
|---|---|---|---|
| MU | ~$8.2B | $5B+ remaining | Opportunistic buying at <1.5x P/B |
| SNDK | ~$2.4B | TBD (Post-Spin) | De-leveraging focus supports equity |
| SK Hynix | ~$4.1B* | High Dividends | Pre-Nasdaq listing "window dressing" |
(Source: Morgan Stanley Equity Research, Oct 2024; Company Filings. *Note: SK Hynix figures adjusted for HBM capex intensity.)
{
  "type": "bar",
  "title": "Cash Flow Resilience: Net Cash vs. Annual Capex (2026E)",
  "index": "Company",
  "categories": ["Net Cash ($B)", "Est. Annual Capex ($B)"],
  "data": [
    {"Company": "Micron (MU)", "Net Cash ($B)": 8.2, "Est. Annual Capex ($B)": 12.5},
    {"Company": "SK Hynix", "Net Cash ($B)": 4.1, "Est. Annual Capex ($B)": 15.2},
    {"Company": "SanDisk (SNDK)", "Net Cash ($B)": 2.4, "Est. Annual Capex ($B)": 3.8}
  ],
  "source": "Source: Consensus Estimates via Bloomberg & J.P. Morgan (2024)",
  "note": "Net cash excludes restricted HBM-specific subsidies."
}
Buyback Support as a Volatility Hedge
The "So What?" for 2027: Unlike the 2018 cycle, NAND leaders are now utilizing programmatic buybacks to neutralize dilution from stock-based compensation.
- Micron: Historically resumes aggressive buybacks when Free Cash Flow (FCF) margins exceed 15%. Treat a 10% drawdown as a "strong buy" if MU is trading at a forward P/E of <8x, a level where management typically steps in.
- SK Hynix: Its path to a 2026 Nasdaq entry requires a pristine balance sheet. Any "dip" caused by macro-fears rather than HBM/NAND yield issues is an opportunity to front-run the institutional re-rating that follows a US listing.
Risk Warning: Do not mistake "cheap" for "value" if net debt is rising. In NAND, negative FCF during a price war can erode a cash floor in two quarters. Always verify that Inventory Turnover is accelerating before catching the falling knife.
As institutional allocations shift toward integrated AI players, tracking where the "smart money" is parking collateral during these drawdowns is essential for timing your entry. Smart Money Tracker for Institutional Portfolios
FAQ
What is the difference between pure-play and integrated NAND stocks?
Pure-play stocks like the upcoming SanDisk spin-off focus almost exclusively on non-volatile storage, offering high-beta exposure to flash cycles. Integrated giants like Micron and SK Hynix produce both DRAM and NAND, using the higher-margin DRAM business as a valuation floor.
Is Western Digital considered a pure-play NAND stock?
Currently, Western Digital is an integrated storage player, but the upcoming spin-off of its flash business (SanDisk) will create a standalone NAND powerhouse, allowing investors to isolate flash cycles from the HDD market.
How is AI impacting the demand for NAND stocks?
AI is shifting NAND demand from volatile consumer electronics to high-margin Enterprise SSDs (eSSDs). Technologies like KV cache offloading for LLMs require massive amounts of flash storage, turning NAND into a critical AI infrastructure asset.
What is the significance of the SK Hynix Nasdaq listing for investors?
The July 10, 2026, Nasdaq listing of SK Hynix ADRs will end the 'scarcity premium' for US-listed NAND stocks like Micron and SanDisk, potentially triggering a 15-20% institutional capital migration toward SK Hynix.
Are NAND stocks currently overvalued or undervalued?
Despite record revenues, many NAND stocks trade at a 'cyclical discount' of 4x-9x EV/EBITDA. Analysts suggest a valuation gap exists, with targets for stocks like MU significantly higher than current prices as the sector shifts to high-margin long-term agreements.