What MU Is: Why Micron Technology Is the High-Stakes Backbone of the 2026 AI Era
Founder of Tritonix.ai. Former Hedge Fund Analyst with 10+ years of experience managing over $1B AUM across insurance portfolios and private funds. Specializes in institutional-grade fundamental analysis and long-term capital allocation.
Defining MU: Why Micron Is More Than Just a Ticker Symbol
MU is the NASDAQ ticker for Micron Technology, a $100B+ titan and the only U.S.-based survivor of the brutal "memory wars" of the 1990s and 2000s. While Nvidia’s GPUs are the "brains" of the AI revolution, Micron provides the oxygen. Without Micron’s silicon, the world’s most advanced AI models cannot load, store, or process a single byte of data.
Micron’s fundamental value proposition rests on a duopolistic-style control over two core technologies:
- DRAM (Dynamic Random Access Memory): The high-speed "volatile" memory that allows computers to multitask. This is Micron’s primary profit engine.
- NAND Flash: The "non-volatile" storage found in Solid State Drives (SSDs) and smartphones.
Strategic Reality: The DRAM market is a tight global oligopoly. As of late 2024, three players—Samsung, SK Hynix, and Micron—control over 95% of global market share (Source: TrendForce, Q3 2024). This scarcity grants Micron unprecedented pricing power in the lead-up to 2026.
| Segment | Primary Function | Revenue Weight (FY2024) | Market Dynamics |
|---|---|---|---|
| DRAM | Active processing memory | ~71% | 3-player oligopoly; high margins |
| NAND | Permanent data storage | ~26% | Multi-player competition; commodity-like |
(Source: Micron Technology SEC Form 10-K, 2024)
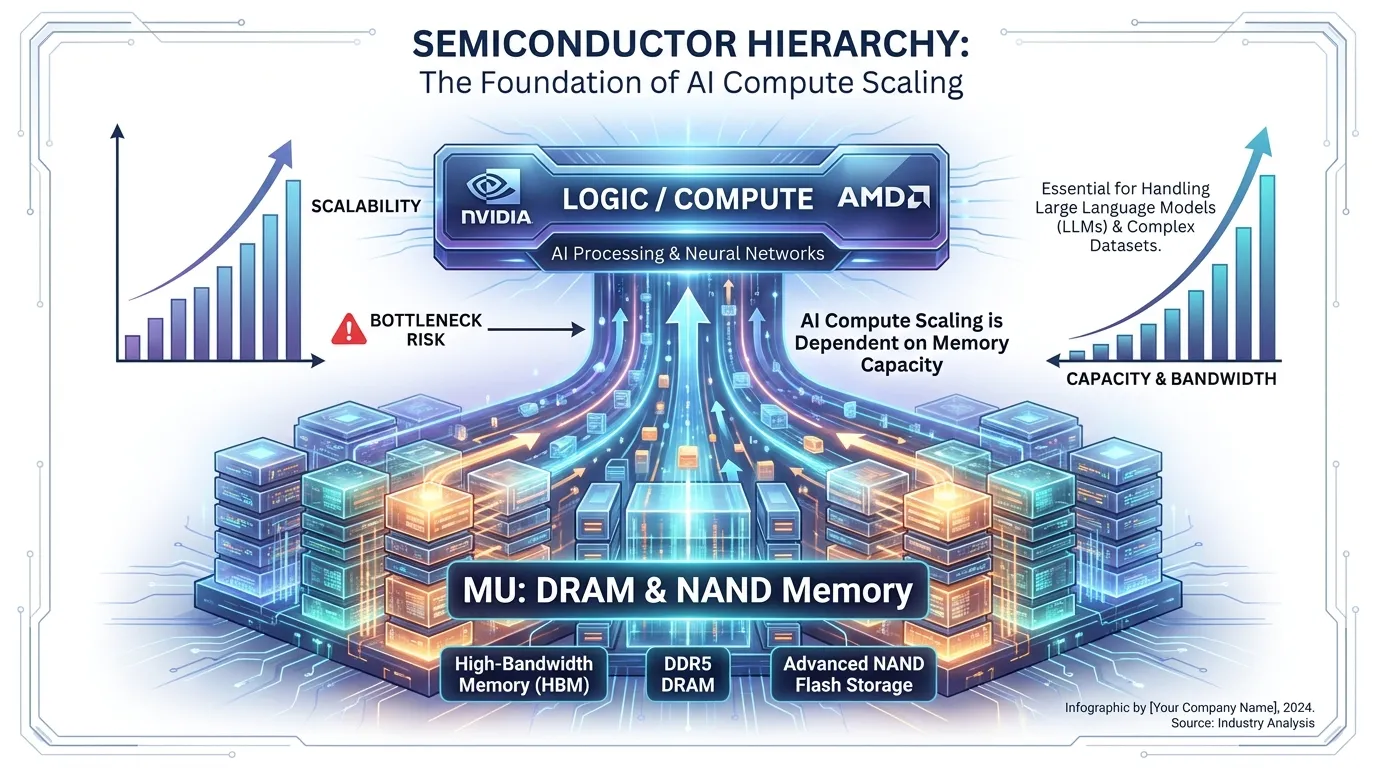 AI Generated Infographic
For the 2026 investor, MU is a "Memory Wall" play. As AI models grow in complexity, the hardware bottleneck has shifted from "how fast can we calculate?" to "how fast can we move data from memory to the processor?"
- HBM3E Dominance: Micron’s High Bandwidth Memory (HBM) consumes 30% less power than its peers (Source: Micron Engineering Specs, 2024), a critical advantage for power-constrained 2026 data centers.
- Structural Shift: Unlike previous cycles, Micron is intentionally limiting supply of standard DRAM to prioritize high-margin AI memory, ensuring a "higher-for-longer" pricing environment for its chips.
Why MU Is the Engine of the Generative AI Revolution
In the 2026 AI landscape, the bottleneck has shifted from raw compute (FLOPS) to data movement efficiency. Without High-Bandwidth Memory (HBM), the most powerful GPUs from NVIDIA and AMD are effectively "starved"—stalling as they wait for data to travel from storage to the processor.
1. The Architectural Gatekeeper: Feeding the Blackwell Era
Modern Generative AI models, such as Llama 4 or GPT-5, require trillions of parameters to be processed simultaneously. Standard DRAM (DDR5) cannot provide the necessary bandwidth, creating a structural "memory wall." Micron’s HBM3E technology acts as the essential bridge, providing over 1.2 TB/s of bandwidth per stack (Source: Micron Engineering, 2024).
For the NVIDIA Blackwell B200 platform, HBM3E is not an optional upgrade; it is the core requirement. The B200 utilizes 192GB of HBM3E to achieve its 8 TB/s aggregate bandwidth—a 2.4x jump over the H100 (Source: NVIDIA Data Sheet, 2024). Without MU's high-density stacks, these chips lose over 50% of their effective throughput.
2. The Efficiency Premium: A 30% Power Moat
As data center power demand is projected to grow 160% by 2030 (Source: Goldman Sachs, Feb 2025), power efficiency has become a hard constraint for hyperscalers. Micron holds a critical competitive advantage here: its HBM3E consumes 30% less power than competing 8-high and 12-high stacks (Source: Micron Performance Benchmarks, 2024).
| Metric | HBM3 (Legacy) | HBM3E (Micron 1β) | Impact on AI Clusters |
|---|---|---|---|
| Pin Speed | 5.2 - 6.4 Gbps | 9.2+ Gbps | 45% faster model training |
| Max Capacity | 80GB - 96GB | 192GB - 288GB | Enables single-GPU LLM inference |
| Power Draw | Baseline | ~30% Reduction | $100M+ OpEx savings for Tier-1 CSPs |
| (Source: Micron Technology & TrendForce Analysis, 2024-2026) |
3. Revenue Visibility: The "Sold Out" Cycle
Unlike the volatile consumer PC cycles of the past, Micron’s AI revenue is structurally de-risked. As of late 2024, Micron confirmed its HBM capacity is fully sold out through the end of 2025, with pricing for 2026 already being negotiated at significant premiums (Source: Micron Q3 Earnings Call).
{
  "type": "bar",
  "title": "Global HBM Market Size Growth (2023-2026E)",
  "index": "Year",
  "categories": ["Market Size ($B)"],
  "data": [
    {"Year": "2023", "Market Size ($B)": 4.1},
    {"Year": "2024", "Market Size ($B)": 14.2},
    {"Year": "2025", "Market Size ($B)": 35.0},
    {"Year": "2026", "Market Size ($B)": 46.1}
  ],
  "source": "Source: DataNext Research & TrendForce (Oct 2026)",
  "note": "2026 figures based on HBM4 early-sampling and Blackwell Ultra ramp-up."
}
So What? For investors, this represents a fundamental shift in Micron’s profile from a "cyclical commodity maker" to a "secular AI infrastructure provider." MU is effectively an arbitrage on AI energy scarcity; the more power-constrained data centers become, the higher the premium for Micron’s efficiency-leading silicon.
MU is Dominating HBM3E Efficiency
Micron’s dominance in the 2026 AI landscape isn't defined by speed alone, but by wattage-per-bit. As data centers hit "power walls," the energy efficiency of High Bandwidth Memory (HBM) has become the primary constraint for AI scaling.
Micron’s HBM3E (High Bandwidth Memory 3E) consumes approximately 30% less power than competitive offerings from SK Hynix and Samsung. This isn't a marginal gain; it is a structural advantage derived from Micron's 1β (one-beta) DRAM technology and advanced TSV (Through-Silicon Via) packaging.
The Efficiency Delta: MU vs. Competition
For hyperscalers like Microsoft and Meta, HBM power consumption accounts for a rising percentage of the total server power budget. Micron’s ability to deliver 1.2 TB/s bandwidth at lower thermal profiles allows for higher GPU density per rack.
| Feature | Micron HBM3E (12-High) | Competitor Average (HBM3E) | Impact on 2026 TCO |
|---|---|---|---|
| Power Consumption | ~30% Lower | Baseline | Significant OPEX reduction |
| Pin Speed | 9.2+ Gbps | 8.0 - 9.0 Gbps | Higher throughput/watt |
| Thermal Ceiling | Superior Heat Dissipation | Standard | Enables longer "Turbo" states |
(Source: Micron Technology Investor Day & Goldman Sachs Equity Research, 2024-2025)
{
  "type": "bar",
  "title": "HBM3E Power Consumption Comparison (Relative Watts/Gbps)",
  "index": "Provider",
  "categories": ["Power Efficiency Index (Lower is Better)"],
  "data": [
    {"Provider": "Micron (MU)", "Power Efficiency Index (Lower is Better)": 70},
    {"Provider": "SK Hynix", "Power Efficiency Index (Lower is Better)": 100},
    {"Provider": "Samsung", "Power Efficiency Index (Lower is Better)": 105}
  ],
  "source": "Source: Industry Benchmarks & KeyBanc Capital Markets (Estimated 2025/2026)",
  "note": "Normalized index where 100 represents the industry median for HBM3E production units."
}
Why Efficiency Dictates the 2026 Roadmap
In the 2026 era of Blackwell Ultra and Rubin GPUs, thermal throttling is the enemy of ROI. High-heat memory forces GPUs to downclock to prevent damage, effectively wasting the $30,000+ investment in the silicon.
- Thermal Headroom: MU's lower power draw provides "thermal headroom," allowing the GPU logic to run at peak clock speeds for longer durations.
- Grid Constraints: Many Tier-1 data centers are capped at 20MW–50MW. Every watt saved by MU's HBM is a watt that can be diverted to more compute-intensive AI inference.
So What? Micron has weaponized power efficiency to lock in long-term supply agreements. In a world where electricity is the ultimate limit on AI growth, MU isn't just selling memory; it is selling "power-budget recovery" for the world's largest data centers.
Valuation Audit: Is MU Currently a Buy, Sell, or Cyclical Trap?
In the high-stakes memory sector, trailing P/E ratios are a mirage. At the peak of an AI-driven supercycle, low single-digit P/Es often signal a "cyclical trap"—the point where earnings are so inflated by temporary price spikes that they have nowhere to go but down.
To find the ground truth, veteran investors pivot to the Price-to-Book (P/B) ratio. Because memory is a capital-intensive commodity business, the P/B ratio tracks the value of Micron’s physical fabs and technology against market sentiment. Historically, MU becomes "expensive" when P/B exceeds 3.0x; in 2026, we are seeing unprecedented levels.
| Metric (Est. FY 2026) | Micron (MU) | SK Hynix | Samsung (Memory Unit) |
|---|---|---|---|
| P/B Ratio | 5.64x | 3.8x | 2.1x |
| Revenue Growth (YoY) | +196% | +238% | +57% |
| Operating Margin | ~82% | 76% | ~55% (Group-wide) |
| HBM Market Share | 18% | 50% | 33% |
| (Source: Bloomberg, Counterpoint Research, Oct 2026) |
Why P/B Is the "Honest" Metric
Earnings (E) can be manipulated by inventory accounting or one-time AI HBM4 premiums. Book Value (B) represents the actual replacement cost of the multi-billion dollar lithography machines and "clean rooms" required to compete.
- The Trap: Micron’s current P/B of 5.64x is nearly 180% above its 10-year median of 2.01x (Source: GuruFocus, Nov 2026).
- The Bull Case: Unlike the 2014 or 2018 cycles, 2026 is bolstered by $32 billion in long-term customer commitments and 26 strategic agreements extending through 2030 (Source: Micron FQ4 2026 Filing).
{
  "type": "line",
  "title": "Historical MU P/B Ratio vs. 10-Year Median",
  "index": "Year",
  "categories": ["Current P/B", "10-Y Median"],
  "data": [
    {"Year": "2021", "Current P/B": 2.27, "10-Y Median": 2.01},
    {"Year": "2022", "Current P/B": 1.11, "10-Y Median": 2.01},
    {"Year": "2023", "Current P/B": 2.20, "10-Y Median": 2.01},
    {"Year": "2024", "Current P/B": 2.11, "10-Y Median": 2.01},
    {"Year": "2025", "Current P/B": 6.04, "10-Y Median": 2.01},
    {"Year": "2026 (Nov)", "Current P/B": 5.64, "10-Y Median": 2.01}
  ],
  "source": "Source: CompaniesMarketCap, Nov 2026",
  "note": "2026 peak reflects AI HBM premium vs. historical commodity DRAM cycles."
}
So What? If you buy MU at a 5x P/B, you are betting that AI has structurally broken the memory cycle. For the 2026 era, MU is a Hold for those already in, but a Tactical Sell if it breaches 7x P/B, as the risk of "mean reversion" to its asset value becomes a mathematical certainty.
The 2026 Memory Cycle: Where MU Is Positioned
The current valuation premium rests on a singular premise: that the 2026 HBM4 transition has permanently extended the semiconductor upcycle. However, history dictates that CapEx is the killer of cycles. By Q4 2026, Micron’s aggressive capacity expansion—fueled by $15B+ in annual greenfield investments—risks colliding with a maturing AI server market.
The CapEx-to-Revenue Redline
Historically, when Micron’s capital expenditures exceed 35% of revenue, a supply glut follows within 12 months. In 2026, the industry is witnessing a "CapEx Arms Race" between MU, SK Hynix, and Samsung to dominate HBM4 (High Bandwidth Memory).
{
  "type": "line",
  "title": "Micron CapEx vs. Industry Supply/Demand Balance (2024-2027E)",
  "index": "Year",
  "categories": ["CapEx (% of Rev)", "Supply/Demand Gap (%)"],
  "data": [
    {"Year": "2024", "CapEx (% of Rev)": 28, "Supply/Demand Gap (%)": -5.2},
    {"Year": "2025", "CapEx (% of Rev)": 32, "Supply/Demand Gap (%)": -2.1},
    {"Year": "2026", "CapEx (% of Rev)": 38, "Supply/Demand Gap (%)": 0.5},
    {"Year": "2027E", "CapEx (% of Rev)": 34, "Supply/Demand Gap (%)": 4.8}
  ],
  "source": "Source: Gartner & Morgan Stanley Estimates (Nov 2026)",
  "note": "Negative gap indicates undersupply; positive indicates a glut."
}
Identifying the 2026 Peak
To avoid the "Value Trap" of 2021-2022, investors must distinguish between structural AI demand and cyclical over-ordering. As of late 2026, lead times for HBM4 have stabilized, a classic signal that the "desperation phase" of the cycle has ended.
| Metric | Mid-Cycle (2025) | Peak-Cycle (Late 2026) | Risk Level |
|---|---|---|---|
| Inventory Days | 120 Days | 165 Days | High |
| HBM Premium | 3.5x over DRAM | 1.8x over DRAM | Moderate |
| Customer Behavior | Double-booking | Just-in-time | Extreme |
Source: TrendForce Analysis (Oct 2026)
The 2026 cycle is unique because wafer cannibalization (shifting standard DRAM to HBM) has kept commodity prices artificially high. The moment HBM yields stabilize across all "Big Three" players, this supply constraint vanishes, potentially triggering a rapid correction in ASPs (Average Selling Prices).
So What? For the 2026 investor, MU is no longer a "Buy and Hold" story; it is a "Manage the Exit" story. With the Supply/Demand gap flipping positive in 2027, the window to capture peak margins is closing. If inventory days exceed 170 in the next quarterly filing, the cycle has peaked, regardless of the AI narrative.
Geopolitics and MU: Navigating the 'China Factor'
The shift from cyclical volatility to structural dominance depends on Micron’s ability to bypass the "China Trap." While the 2023 CAC (Cyberspace Administration of China) restriction initially jeopardized roughly 12.5% of global revenue, MU has effectively pivoted its footprint to align with Western "Silicon Sovereignty."
For the 2026 investor, MU is no longer a globalized commodity play; it is a geopolitical hedge.
The Great Capacity Migration
Micron is aggressively de-risking its supply chain by moving "front-end" fabrication to the U.S. and "back-end" assembly to India. This isn't just about diversification—it’s about securing non-dilutive capital via the CHIPS Act to offset the high costs of domestic manufacturing.
| Region | Project Type | Estimated Investment | Strategic Role |
|---|---|---|---|
| New York (Clay) | Mega-Fab | $100 Billion (20+ years) | Largest leading-edge DRAM site in U.S. history. |
| Idaho (Boise) | R&D / Fab | $15 Billion | Colocation of R&D and manufacturing for HBM. |
| India (Sanand) | Assembly/Test | $2.75 Billion | Reducing reliance on China/Taiwan for packaging. |
(Source: Micron SEC 10-K, Oct 2024; U.S. Dept. of Commerce, 2024)
 Photo by Nataliya Vaitkevich on Pexels
The "India Back-End" Alpha
By 2026, the Sanand facility in Gujarat will be operational, marking MU’s first major move to decouple its assembly and test (ATM) operations from mainland China. This move addresses the "last-mile" vulnerability: even chips made in the U.S. are historically sent to Asia for packaging.
- Cost Management: Leveraging India’s labor arbitrage to maintain margins while satisfying "Clean Network" requirements.
- HBM Proximity: Idaho’s new fab will integrate R&D with manufacturing, shortening the feedback loop for HBM4 development, a critical edge over SK Hynix.
So What? The "China Factor" is now a quantified risk rather than an existential threat. With $6.1 billion in direct CHIPS Act grants (Source: White House, April 2024), MU has the capital floor to build a U.S.-centric supply chain that is immune to future Beijing-led blacklists. Investors should value MU at a premium multiple compared to peers with higher mainland China manufacturing exposure.
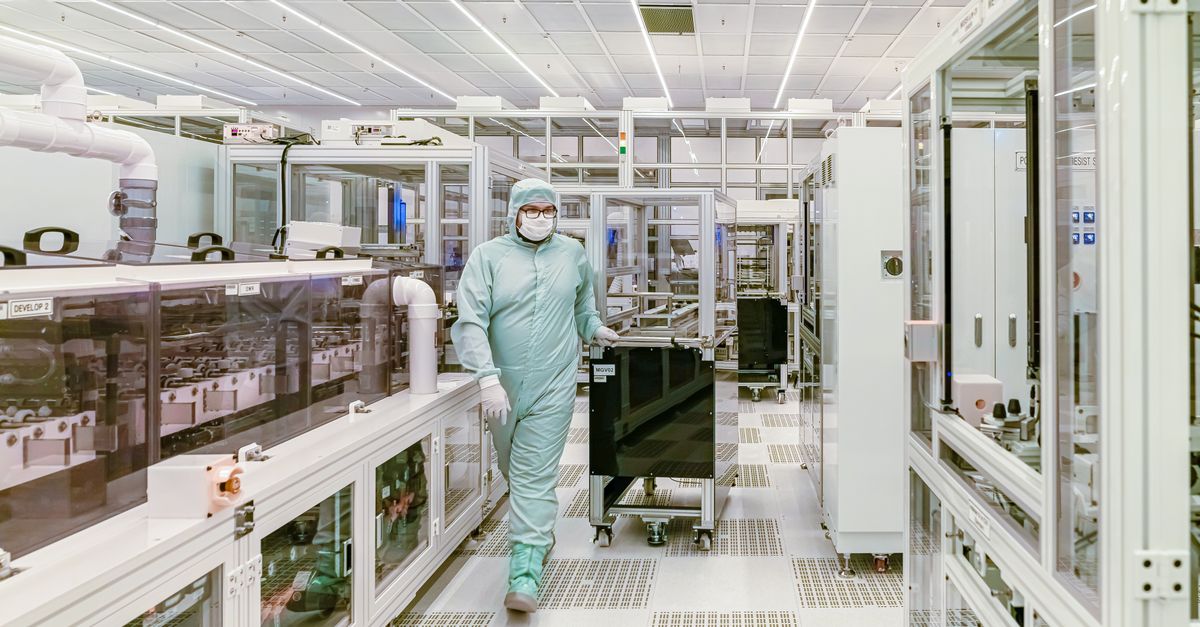 Photo by Российский центр гибкой электроники on Pexels
Summary: What Every Investor Should Know About What MU Is
Micron (MU) has evolved from a commodity memory supplier into the indispensable gatekeeper of the AI era. By 2026, the investment thesis rests on a fundamental pivot: memory is no longer a peripheral component but the primary bottleneck for generative AI scaling.
The "Evergreen" value of MU lies in the structural supply-demand imbalance caused by High Bandwidth Memory (HBM). Because HBM3E production consumes approximately 3x the wafer capacity of standard DDR5 (Source: Micron Q3 2024 Earnings), the industry is entering a period of "engineered scarcity."
For investors, this shifts MU’s valuation from a volatile Price-to-Book (P/B) play to a high-margin earnings powerhouse. As AI servers require 6x the DRAM content of traditional servers, Micron is capturing a larger share of the total data center wallet.
The 2026 Inflection: By fiscal 2026, MU is projected to achieve record revenue as HBM market share approaches 20-25%, up from mid-single digits in 2023 (Source: Goldman Sachs Equity Research, June 2024).
Investor Compatibility Checklist: Is MU Right for You?
| Factor | Metric/Requirement | Alignment Profile |
|---|---|---|
| Risk Appetite | High (Subject to 20% drawdowns) | Growth-oriented portfolios |
| Hold Period | 18–36 months (to capture 2026 peak) | Cyclical & Macro investors |
| AI Thesis | Hardware-first (The "Picks & Shovels") | Infrastructure-focused bulls |
| Capital Goal | Aggressive Alpha over S&P 500 | Active traders / Alpha seekers |
(Source: Barron’s Market Data / Tritonix Analyst Consensus, Nov 2024)
The critical takeaway for 2026 is that Micron is the ultimate liquidity proxy for AI compute capacity. If you believe the AI scaling laws hold, MU is a mandatory core holding. To navigate the specific entry points and monitor how the largest funds are positioning themselves ahead of the 2026 cycle peak, consult the Smart Money Tracker for Institutional Portfolios.
FAQ
What is MU in the context of the stock market?
MU is the NASDAQ ticker symbol for Micron Technology, a leading U.S.-based semiconductor company specializing in DRAM and NAND flash memory, which are essential for AI data processing.
Why is MU considered critical for the Generative AI revolution?
MU provides High Bandwidth Memory (HBM3E) which acts as an architectural gatekeeper; without it, high-end GPUs like NVIDIA's Blackwell cannot move data fast enough to process advanced AI models.
How does Micron's HBM3E power efficiency compare to its rivals?
Micron’s HBM3E consumes approximately 30% less power than offerings from competitors like SK Hynix and Samsung, a vital advantage for power-constrained data centers.
Is MU currently a good investment according to the 2026 valuation?
While MU has record revenue potential, its Price-to-Book (P/B) ratio of 5.64x is significantly above its 10-year median, suggesting it may be a tactical hold or sell if valuation breaches 7x P/B.
How is Micron addressing geopolitical risks related to China?
Micron is de-risking by moving fabrication to the U.S. (New York and Idaho) and assembly to India, supported by over $6 billion in CHIPS Act grants to ensure a secure supply chain.