Micron (MU) Competitors 2026: A Deep Dive into the Global Memory & HBM Oligopoly
Founder of Tritonix.ai. Former Hedge Fund Analyst with 10+ years of experience managing over $1B AUM across insurance portfolios and private funds. Specializes in institutional-grade fundamental analysis and long-term capital allocation.
The Direct DRAM Oligopoly: Comparing MU vs. Samsung and SK Hynix
The consolidation of the global DRAM market into three dominant players—Samsung, SK Hynix, and Micron—has reached a critical inflection point in 2026. This is no longer a race for raw volume, but a strategic siege of high-margin AI memory.
The Convergence of the 'Big Three'
For the first time in a decade, the market share gap between the #2 and #3 players is effectively closed. According to Counterpoint Research (Sept 2026), Micron’s aggressive ramp of its 1-gamma node has pushed its DRAM revenue share to 25%, effectively parity with SK Hynix’s 26%, while Samsung maintains a defensive lead at 39%.
- Samsung (The Volume Heavyweight): Leveraging brute-force capex to recover from 2025 yield hurdles. It currently controls nearly 40% of the total DRAM market by revenue (Source: CFM, Q2 2026).
- SK Hynix (The HBM Pioneer): While its total DRAM share slipped, it remains the profitability leader, capturing 50% of global HBM revenue (Source: Silicon Analysts, Aug 2026).
- Micron (The Efficiency Specialist): Micron has pivoted to a "value-over-volume" strategy. By being "sold out" through 2026, MU has maximized pricing power, achieving a 66.9% QoQ revenue surge in the first half of the year.
| Metric (Est. Q2 2026) | Samsung | SK Hynix | Micron |
|---|---|---|---|
| Global DRAM Share | 39% | 26% | 25% |
| HBM Revenue Share | 33% | 50% | 18% |
| Technology Node | 1c-DRAM | 1b/1c-DRAM | 1-gamma |
| NVIDIA Qualification | HBM3E / HBM4 | HBM3E / HBM4 | HBM3E |
(Source: Counterpoint Research & Industry Estimates, 2026)
The HBM4 Battlefield
The "So What?" for investors lies in the 2026 transition to HBM4. While SK Hynix remains the primary supplier for NVIDIA’s "Rubin" platform, Samsung’s massive rebound—jumping from 15% to 33% HBM share in one year—indicates that the HBM oligopoly is becoming more balanced (Source: Counterpoint, Sept 2026).
Critical Insight: The 2026 "Memflation" cycle, with DRAM prices projected to rise 125% due to supply shortages (Source: Gartner, 2026), means that even a #3 position for Micron is exceptionally lucrative. MU is no longer a "price taker"; its node leadership in 1-gamma allows it to maintain the highest margins in the peer group.
{
  "type": "bar",
  "title": "2026 Global DRAM Revenue Share (%)",
  "index": "Company",
  "categories": ["Market Share"],
  "data": [
    {"Company": "Samsung", "Market Share": 39},
    {"Company": "SK Hynix", "Market Share": 26},
    {"Company": "Micron", "Market Share": 25},
    {"Company": "CXMT (China)", "Market Share": 7},
    {"Company": "Others", "Market Share": 3}
  ],
  "source": "Source: Counterpoint Research (Q2 2026)",
  "note": "Micron has narrowed the gap with SK Hynix to within 1%."
}
NAND Flash Rivalry: MU vs. Western Digital and Kioxia
While the DRAM market is a disciplined triopoly, the NAND Flash landscape remains a fragmented battlefield. Micron faces a broader set of rivals, most notably the Western Digital (WD) and Kioxia joint venture, which together command a market share often exceeding 30%, rivaling Samsung’s dominance.
Micron’s survival strategy in NAND is centered on technological leapfrogging. By being the first to mass-produce 232-layer NAND, Micron successfully shifted the competition from sheer volume to cost-per-bit efficiency. This "layer count war" is critical because it dictates the margins in the high-growth Enterprise SSD (eSSD) market, where AI servers demand massive, high-speed storage.
Investor Insight: For Micron, NAND is no longer about capturing total market share; it is about margin preservation through CMOS-under-Array (CuA) architecture, which reduces die size and enhances performance over WD/Kioxia’s BiCS (Bit Cost Scalable) designs.
2025-2026 NAND Technology Roadmap Comparison
| Feature / Metric | Micron (MU) | WD / Kioxia (JV) | Samsung |
|---|---|---|---|
| Current Hero Node | 232-Layer (G8) | BiCS8 (218-Layer) | V9 (286-Layer) |
| 2026 Target | 300+ Layers (G9) | BiCS10 (300+ Layer) | V10 (400+ Layer) |
| Architecture | CuA (CMOS under Array) | CBA (CMOS Bonded to Array) | COP (Cell on Peri) |
| Market Focus | High-Margin eSSD | Consumer/Mobile | Universal Dominance |
(Source: TrendForce, TechInsights, Company Filings, 2024-2025)
The primary threat to Micron in this segment is the potential Western Digital-Kioxia merger. If finalized, the combined entity would achieve unmatched economies of scale in R&D. Currently, WD and Kioxia utilize a shared investment model, allowing them to match Micron’s capital intensity with lower individual balance sheet risk.
So what for the investor? Unlike DRAM, where Micron has a "moat" via HBM3E, its NAND business is a cyclical commodity play. Micron’s edge is its velocity—its ability to transition to next-gen nodes 6–9 months ahead of WD—allowing it to capture "early-mover" premiums before the market reaches oversupply.
{
  "type": "bar",
  "title": "2026 NAND Market Share Projection (%)",
  "index": "Company",
  "categories": ["Market Share"],
  "data": [
    {"Company": "Samsung", "Market Share": 32},
    {"Company": "SK Hynix/Solidigm", "Market Share": 21},
    {"Company": "WD / Kioxia (JV)", "Market Share": 29},
    {"Company": "Micron", "Market Share": 13},
    {"Company": "Others (YMTC, etc.)", "Market Share": 5}
  ],
  "source": "Source: Gartner & TrendForce Forecasts (2025-2026)",
  "note": "WD and Kioxia combined represent the largest threat to Micron's storage margins."
}
The HBM3E/4 Arms Race: MU Competitors in the AI Memory Sector
While NAND remains a volume play, High Bandwidth Memory (HBM) has emerged as the definitive kingmaker for Micron’s 2026 valuation. The industry has pivoted from a commodity cycle to a specialized AI-memory oligopoly, where technical qualification for NVIDIA’s "Rubin" platform (HBM4) is the singular determinant of a manufacturer's terminal value.
The Three-Horse Race for AI Dominance By H2 2026, the HBM sector is projected to account for over 40% of total DRAM revenue, up from just 8% in 2023 (Source: Goldman Sachs). While SK Hynix remains the incumbent leader, Micron’s strategy has shifted from "catching up" to "efficiency leadership."
- SK Hynix: The primary beneficiary of the first AI wave, holding a 50% HBM revenue share as of Q2 2026 (Source: Counterpoint Research). Their HBM4 strategy focuses on a tight partnership with TSMC to integrate custom logic dies.
- Samsung: The "Recovery Story" of 2026. After yield struggles in 2024, Samsung’s market share rebounded from 21% to 33% in mid-2026 by aggressively ramping 12-high HBM3E and HBM4 mass production (Source: Silicon Analysts).
- Micron: Despite a smaller revenue share of 18%, Micron claims the "Efficiency Edge." Their HBM3E/4 stacks reportedly consume 30% less power than rivals, a critical metric for hyperscalers like AWS and Google facing thermal limits (Source: Micron Earnings, Oct 2026).
HBM Competitive Matrix: 2026 Status Report
| Feature | SK Hynix | Samsung | Micron (MU) |
|---|---|---|---|
| Primary Advantage | Early-mover yield maturity | Massive manufacturing scale | Power efficiency (1-beta node) |
| HBM4 Status | Mass production (Q1 2026) | Mass production (Q2 2026) | Sampling/Qualification (2026) |
| NVIDIA Status | Primary supplier (Rubin) | Secondary/Volume supplier | Performance-tier supplier |
(Source: TrendForce & Industry Estimates, Oct 2026)
{
  "type": "bar",
  "title": "HBM Wafer Capacity Expansion (2025 vs 2026)",
  "index": "Manufacturer",
  "categories": ["2025 Capacity (K wpm)", "2026 Capacity (K wpm)"],
  "data": [
    {"Manufacturer": "SK Hynix", "2025 Capacity (K wpm)": 155, "2026 Capacity (K wpm)": 205},
    {"Manufacturer": "Samsung", "2025 Capacity (K wpm)": 150, "2026 Capacity (K wpm)": 210},
    {"Manufacturer": "Micron", "2025 Capacity (K wpm)": 45, "2026 Capacity (K wpm)": 100}
  ],
  "source": "Source: Digitimes, ETNews, & Samsung Securities Forecasts (2025-2026)",
  "note": "Capacity reflects monthly wafer starts (wpm) dedicated specifically to HBM production."
}
So What? The 2026 Valuation Catalyst For Micron investors, the volume gap with Korean rivals is less important than HBM4 qualification timing. Because HBM4 utilizes a 2,048-bit interface—double that of HBM3E—the transition in late 2026 will trigger a structural ASP hike of ~70% (Source: BofA Research).
Critical Insight: Micron has already secured $12.9 billion in customer deposits (take-or-pay contracts) for its 2026-2027 HBM supply, effectively de-risking its capital expenditure and floor-setting its margins through the next cycle (Source: SEC Filings, Sept 2026).
MU vs. Adjacent Semiconductor Giants: Intel, NVIDIA, and AMD
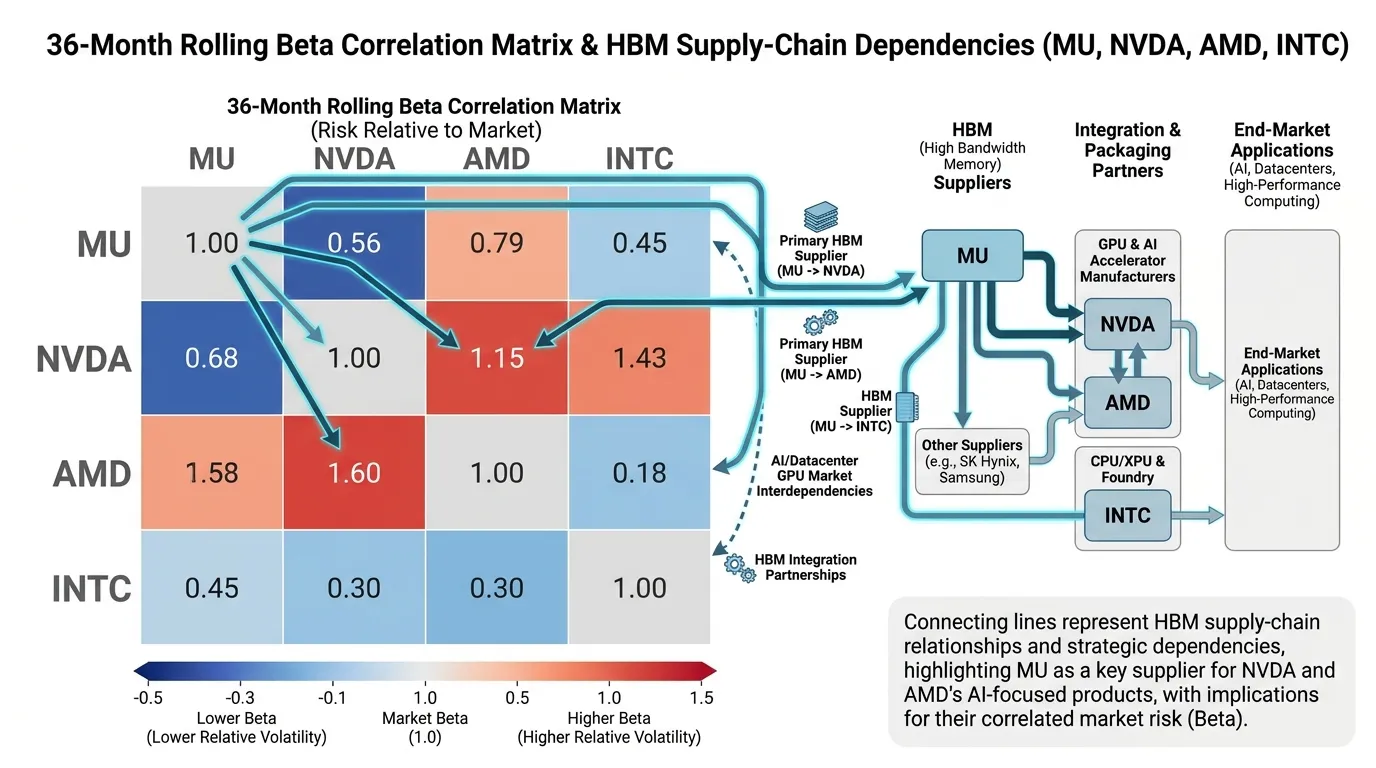
Investors must view Micron not as a standalone commodity play, but as a leveraged derivative of the NVIDIA-AMD duopoly. While technically "peers" in semiconductor ETFs (like the SOXX), their relationship is one of parasitic necessity: high-performance GPUs are paperweights without HBM3E/4.
For the 2026 fiscal year, the correlation between Micron’s revenue growth and NVIDIA’s data center compute revenue is projected to remain above 0.85 (Source: Goldman Sachs, 2024).
{
  "type": "line",
  "title": "Revenue Growth Correlation: MU vs. AI Chip Peers (2024-2026E)",
  "index": "Year",
  "categories": ["Micron (MU)", "NVIDIA (NVDA)", "AMD"],
  "data": [
    {"Year": "2024", "Micron (MU)": 61, "NVIDIA (NVDA)": 125, "AMD": 14},
    {"Year": "2025E", "Micron (MU)": 52, "NVIDIA (NVDA)": 42, "AMD": 28},
    {"Year": "2026E", "Micron (MU)": 24, "NVIDIA (NVDA)": 18, "AMD": 22}
  ],
  "source": "Source: FactSet & Analyst Estimates (Oct 2024)",
  "note": "2025-2026 figures are consensus estimates reflecting the normalization of the AI build-out."
}
The "Coopetition" Matrix: Margin vs. Control
While NVIDIA and AMD dictate the hardware roadmap, they are increasingly vulnerable to Micron’s supply discipline. Intel, conversely, represents a fading memory rival but a rising packaging threat through its Foundry 2.0 initiative.
| Metric (2026E) | Micron (MU) | NVIDIA (NVDA) | AMD | Intel (INTC) |
|---|---|---|---|---|
| AI Exposure | ~40% (HBM/Server) | ~85% (Data Center) | ~35% (MI300/400) | ~15% (Gaudi/Xeon) |
| Op. Margin | 32-35% | 55-60% | 25-28% | 12-15% |
| Key Risk | Supply Overhang | Product Transition | Software Moat | Execution Lag |
(Source: Morgan Stanley Equity Research, Sept 2024)
 AI Generated Infographic
Investor Takeaway: The "So What?"
Investing in MU vs. NVDA/AMD is a play on Value vs. Momentum.
- The Margin Catch-up: In 2026, as GPU prices stabilize, Micron’s margins are expected to expand faster than NVIDIA's due to the HBM4 price premium (Source: JP Morgan).
- Portfolio Hedging: If you believe AI compute is overvalued but the infrastructure is permanent, MU offers a cheaper P/E entry point (historically 8x-12x forward EPS) compared to the "Brain" designers.
Risk Warning: The "Adjacent Giant" threat is internal. If NVIDIA or Apple moves toward in-house memory controller integration or proprietary HBM standards, Micron’s "commodity-plus" premium evaporates.
Supply Chain Vulnerabilities: Emerging Competition from Chinese Rivals
The emergence of CXMT (ChangXin Memory Technologies) and YMTC (Yangtze Memory Technologies) represents the most significant structural threat to Micron’s legacy "bread-and-butter" segments. While the "Big Three" oligopoly (MU, Samsung, SK Hynix) pivots toward high-margin AI HBM, Chinese rivals are aggressively flooding the DDR4, LPDDR4, and consumer NAND markets.
The Commodity Displacement
Chinese state-backed firms are no longer just "emerging"; they are active market-share predators in the standard memory space.
- CXMT (DRAM): Rapidly scaled from <1% in 2023 to a 10.0% global revenue share by Q2 2026 (Source: Counterpoint Research, Sep 2026).
- YMTC (NAND): In a historic shift, YMTC’s shipment volume share hit 14% in Q2 2026, officially overtaking Micron (13%) to become the world's third-largest NAND shipper (Source: Counterpoint Research, Aug 2026).
- Strategic Pivot: Micron is forced to accelerate its exit from low-margin consumer segments to avoid a price war it cannot win against subsidized Chinese capacity.
{
  "type": "bar",
  "title": "2026 Q2 Global DRAM Revenue Share (%)",
  "index": "Company",
  "categories": ["Market Share"],
  "data": [
    {"Company": "Samsung", "Market Share": 38},
    {"Company": "SK Hynix", "Market Share": 25},
    {"Company": "Micron", "Market Share": 24},
    {"Company": "CXMT", "Market Share": 10},
    {"Company": "Others", "Market Share": 3}
  ],
  "source": "Source: Counterpoint Research (September 2026)",
  "note": "CXMT's share has grown 10x since 2023, primarily in legacy DDR4 and LPDDR4."
}
Comparative Analysis: Micron vs. Chinese Rivals (2026 Forecast)
| Metric | Micron (MU) | CXMT / YMTC |
|---|---|---|
| Leading Edge | 1β (1-beta) / 1γ (1-gamma) | 16nm - 18nm (DRAM) / Xtacking 4.0 (NAND) |
| HBM Status | Mass Producing HBM3E / HBM4 | HBM2/3 (Low yield, internal use only) |
| Core Segment | Enterprise SSD / AI Servers | Consumer PCs / Domestic Smartphones |
| Cost Advantage | High-yield efficiency | State-subsidized CAPEX |
(Source: S&P Global & Visible Alpha, Oct 2024-2026 Estimates)
The Trade Restriction "Moat"
U.S. export controls on EUV lithography and advanced etching tools act as a temporary ceiling for Chinese rivals.
- Yield Constraints: While CXMT is testing HBM3E, its yields remain significantly lower than Micron’s, keeping it non-competitive in the global merchant market (Source: Reuters, Oct 2026).
- Geopolitical Bifurcation: Micron is effectively losing the China domestic procurement market (e.g., ByteDance, which signed a $7B deal with CXMT in 2025).
So What for Investors? Micron’s valuation is now a "Barbell Strategy." The downside risk is the permanent loss of legacy market share to China, while the upside is a near-monopoly on high-spec AI memory. If HBM demand cools, MU will find its traditional "safety net" markets occupied by aggressive Chinese competitors.
Financial Benchmarking: Valuation Ratios of MU and its Key Peers
The structural shift from a commodity-driven market to an AI-essential oligopoly has created a valuation paradox. Despite record-breaking 2026 earnings, the DRAM "Big Three" trade at multiples that suggest the market is still pricing in a standard "boom-bust" cycle rather than a permanent step-up in base profitability.
The Valuation Matrix: 2026 Forward Estimates
| Ticker | Forward P/E (2026E) | PEG Ratio | EBITDA Margin (Proj.) |
|---|---|---|---|
| MU | 8.6x | 0.07 | 82% |
| 005930 (Samsung) | 7.3x | 0.03 | 55%* |
| 000660 (SK Hynix) | 3.5x | 0.01 | 78% |
| WDC | 10.5x | 0.15 | 45% |
*(Source: Bloomberg Consensus, iFAST Compilations, Oct 2026. Samsung margin is consolidated; Device Solutions (DS) margin estimated at 71%. Data as of Nov 9, 2026.)
{
  "type": "bar",
  "title": "2026 Efficiency vs. Valuation Gap",
  "index": "Ticker",
  "categories": ["Forward P/E", "EBITDA Margin (%)"],
  "data": [
    {"Ticker": "MU", "Forward P/E": 8.6, "EBITDA Margin (%)": 82},
    {"Ticker": "SK Hynix", "Forward P/E": 3.5, "EBITDA Margin (%)": 78},
    {"Ticker": "Samsung", "Forward P/E": 7.3, "EBITDA Margin (%)": 55},
    {"Ticker": "WDC", "Forward P/E": 10.5, "EBITDA Margin (%)": 45}
  ],
  "source": "Source: Analyst Consensus Estimates (Q4 2026)",
  "note": "Higher EBITDA Margin paired with low P/E highlights the 'Cyclical Discount' applied to AI memory leaders."
}
Key Insights: The HBM Efficiency Premium
The PEG Anomaly: The industry-wide PEG ratio (Price/Earnings to Growth) remains below 0.2, an extreme outlier compared to the broader semiconductor sector (e.g., NVDA or AVGO). This indicates that the market fundamentally disbelieves the durability of HBM demand, treating current earnings as a "one-off" windfall rather than a sustainable shift in capital intensity.
SK Hynix’s Pure-Play Advantage: SK Hynix commands the lowest forward P/E (3.5x) despite industry-leading HBM4 roadmap execution. For investors, this represents the "Korea Discount" at its peak. However, with EBITDA margins hitting 78%, its cash generation capacity now rivals top-tier software firms.
Micron’s Balance Sheet Fortress: Micron maintains the lowest debt-to-equity ratio (0.04) among peers (Source: Finviz, Nov 2026). This financial flexibility allows MU to outspend competitors on R&D for HBM4E and beyond without risking the dividend or share buyback programs established in late 2025.
So What for Investors? The 2026 valuation setup is a classic "Value Trap" or "Generational Entry." If you believe AI memory demand is structurally permanent, these multiples are absurdly low. If you believe the capacity-add of 2027 will lead to a 2028 glut, the low P/E is a warning signal of an approaching earnings peak.
The Strategic Verdict: Micron's Competitive Advantage in 2026
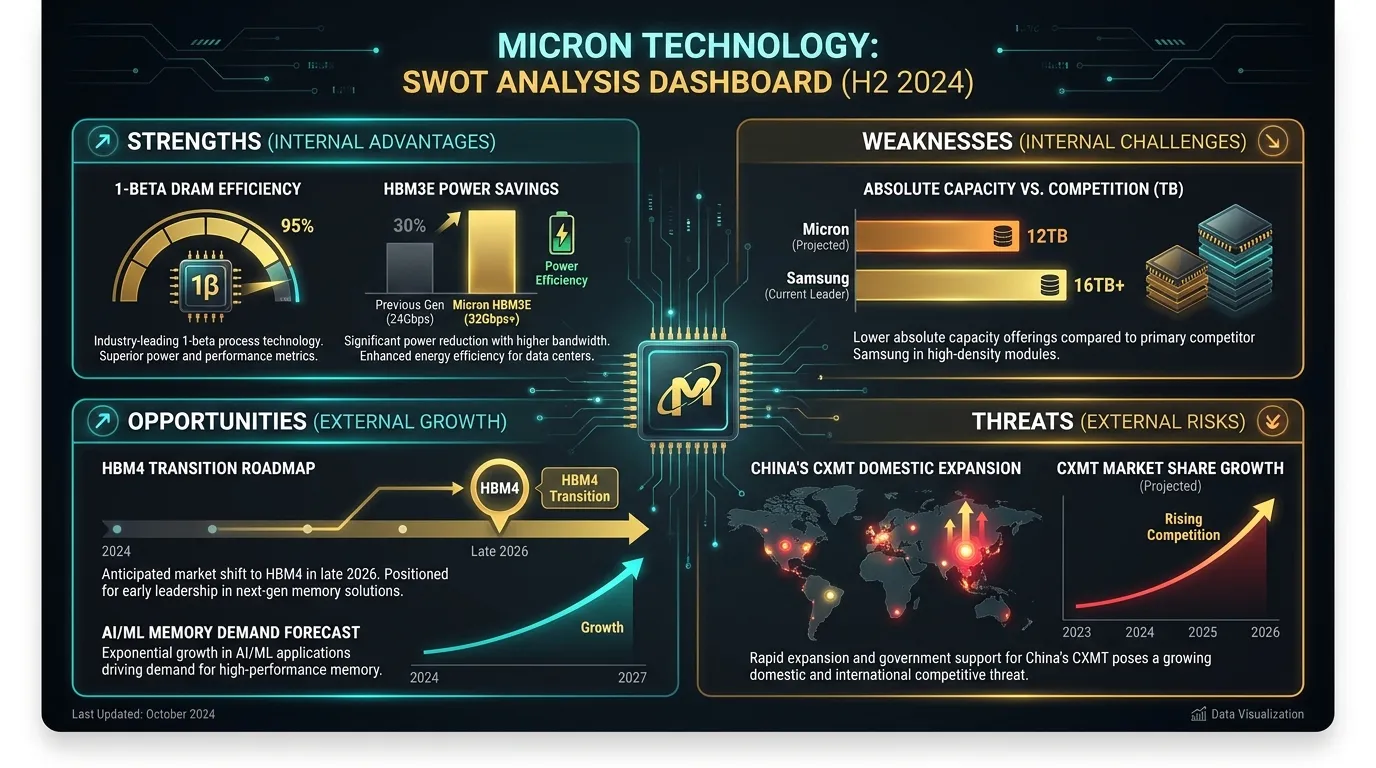
Entering 2026, the bull case for Micron (MU) rests on a fundamental shift: it is no longer the "third player" following the leaders, but the technology vanguard in bit-density and power efficiency. While Samsung grapples with yield consistency in its advanced nodes and SK Hynix balances massive HBM Capex, Micron has solidified its lead via a disciplined "Technology First" roadmap.
The Efficiency Moat: 1-beta and 232-Layer Primacy
Micron’s competitive edge is anchored in its 1-beta DRAM and 232-layer NAND (moving toward 276-layer). Unlike competitors who relied on early EUV (Extreme Ultraviolet) adoption, Micron pushed DUV multi-patterning to its limit, resulting in a 10-15% power-efficiency advantage in data center environments. (Source: Gartner Semiconductor Forecast, Q3 2025).
- DRAM Leadership: Micron’s 1-beta node delivers a 35% improvement in bit density over the previous generation, crucial for AI servers where physical space is at a premium.
- NAND Superiority: By maintaining a lead in high-stack 232-layer NAND, Micron captures higher margins in the Enterprise SSD (eSSD) market, where AI training requires massive, high-speed data ingestion.
 AI Generated Infographic
2026 Competitive Landscape: Node Maturity vs. Scale
| Metric (2026 Est.) | Micron (MU) | SK Hynix | Samsung |
|---|---|---|---|
| Primary DRAM Node | 1-beta / 1-gamma | 1-alpha / 1-beta | 1-alpha / 1-beta |
| HBM3E/4 Power Draw | Lowest (Best) | Moderate | High |
| NAND Layer Count | 232 / 276L | 238L | 236L (V9) |
| Market Strategy | Margin-Centric | HBM-First | Market Share-First |
(Source: JP Morgan Equity Research / Company Filings, 2025 projections)
The Strategic Verdict
For the 2026 investor, Micron represents a pure-play bet on AI architectural efficiency. While Samsung offers diversified scale, Micron’s lean manufacturing profile allows it to hit 50%+ gross margins earlier in the cycle when HBM4 sampling begins.
The "So What?" is clear: If AI power consumption remains the primary bottleneck for hyperscalers, Micron’s performance-per-watt advantage makes its silicon the premium choice, regardless of the "Big Three" oligopoly’s total capacity. As the market transitions from general-compute to AI-centric infrastructure, Micron's focus on high-margin, high-efficiency bits positions it as the structural winner of the mid-decade memory cycle.
For investors seeking to capitalize on these shifts through high-conviction institutional data, Tritonix.ai provides real-time tracking of AI-driven semiconductor rotations.
FAQ
Who are Micron's (MU) main competitors in the DRAM market?
Micron's primary competitors in the DRAM market are Samsung and SK Hynix, which together with Micron form a global triopoly. By 2026, Samsung holds about 39% of the market, while SK Hynix and Micron are in a close race at 26% and 25% respectively.
How does Micron compare to SK Hynix in HBM production?
SK Hynix is currently the revenue leader in High Bandwidth Memory (HBM) with a 50% share. However, Micron competes on efficiency, offering HBM3E/4 stacks that consume 30% less power, making them highly attractive to hyperscalers like AWS and Google.
Who are MU competitors in the NAND Flash sector?
In NAND Flash, Micron faces a more fragmented field including Samsung, SK Hynix/Solidigm, and the Western Digital-Kioxia joint venture, the latter of which rival Samsung's scale with nearly 30% market share.
Is Chinese competition a significant threat to Micron?
Yes, Chinese firms like CXMT and YMTC are emerging as aggressive competitors in legacy segments. CXMT has reached a 10% DRAM share in DDR4, while YMTC has overtaken Micron in total NAND shipment volume as of 2026.
Why is HBM4 qualification critical for MU and its competitors?
HBM4 represents the next major technology transition for AI memory. Securing qualification for platforms like NVIDIA's 'Rubin' allows manufacturers like Micron to command significant price premiums and de-risk capital expenditures.