Morningstar SpaceX Valuation Deep Dive: Why Analysts Slashed the IPO Target by 50%
Founder of Tritonix.ai. Former Hedge Fund Analyst with 10+ years of experience managing over $1B AUM across insurance portfolios and private funds. Specializes in institutional-grade fundamental analysis and long-term capital allocation.
The Morningstar SpaceX Valuation Verdict: Breaking Down the $780 Billion Figure
The valuation disconnect between Silicon Valley’s ambition and Wall Street’s fundamental reality has reached a $970 billion canyon. While SpaceX targets a staggering $1.75 trillion IPO valuation, Morningstar’s equity research team has countered with a sobering fair value estimate of $780 billion (Source: Morningstar, June 2026).
This 55% haircut isn't a dismissal of Elon Musk’s engineering prowess; it is a rejection of the "infinite growth" premium currently baked into private secondary markets. Morningstar’s model suggests the market is pricing in perfection across unproven sectors, particularly orbital AI, while ignoring the capital intensity of the Starship program.
{
  "type": "bar",
  "title": "The $970B Valuation Gap: SpaceX IPO vs. Morningstar Fair Value",
  "index": "Entity",
  "categories": ["Valuation (Billions USD)"],
  "data": [
    {"Entity": "IPO Target Valuation", "Valuation (Billions USD)": 1750},
    {"Entity": "Morningstar Fair Value", "Valuation (Billions USD)": 780},
    {"Entity": "Core Value (Launch/Starlink)", "Valuation (Billions USD)": 611},
    {"Entity": "AI & Moonshots (Weighted)", "Valuation (Billions USD)": 170}
  ],
  "source": "Source: Morningstar Equity Research (June 2026)",
  "note": "Morningstar fair value assumes a $63/share price vs. $135/share IPO target."
}
The Conflict: Cash Flow vs. "Moonshot" Math
Morningstar analyst Nicolas Owens segments the valuation into two distinct buckets: the "Probable Core" and the "Speculative AI." The gap exists because Morningstar applies a probability-weighted approach to SpaceX's newer ventures, whereas the IPO price assumes these markets are already won.
| Segment | Morningstar Estimate | IPO Market Assumption | The Critical Difference |
|---|---|---|---|
| Core (Launch/Starlink) | $611 Billion | ~$900 Billion | Morningstar expects lower long-term margins as competitors enter the LEO market. |
| AI / Orbital Compute | $170 Billion | ~$850 Billion | Morningstar assigns only a 7% probability to the "Moonshot" AI success scenario. |
| Total Equity Value | $780 Billion | $1.75 Trillion | $970 Billion Gap |
(Source: Morningstar Research, June 2026; SEC S-1 Filing Data)
So What? The Margin of Safety
For the retail investor, the $780 billion verdict serves as a warning against "IPO Fever." Morningstar notes that while a small float (approx. 3%) and inclusion in the Nasdaq-100 may drive a short-term price surge, the fundamental fair value remains $63 per share.
The Verdict: Investors buying at the $1.75 trillion entry point are essentially paying for 2040's success today, leaving zero margin of safety for technical delays or AI scaling failures. (Source: Barron’s Analysis, 2026).
DCF Mechanics: Why Morningstar Uses a Higher Margin of Safety
To understand Morningstar’s $780 billion valuation, one must look past the "perpetual growth" narrative and examine their Probability-Weighted Discounted Cash Flow (DCF) model. While private markets price SpaceX for perfection, Morningstar’s methodology applies a clinical Margin of Safety to unproven engineering milestones.
The "Expected Value" vs. "Potential Value" Trap
Morningstar’s $63/share fair value is an average of three distinct scenarios, rather than a single linear projection. The firm argues that the $1.75 trillion private market valuation only makes sense if the most optimistic "Moonshot" scenario is treated as a 100% certainty. In reality, Morningstar assigns this scenario—which requires a fully reusable Starship and high-margin orbital data centers—a mere 7% probability.
- Core Value ($611B): Morningstar’s base case focuses on the "Narrow Moat" launch business and Starlink's current trajectory.
- AI Speculation ($170B): The remaining value is attributed to xAI and orbital computing, but with a Very High Uncertainty Rating.
- Capex Drag: Analysts factor in the massive capital intensity of xAI integration, which recorded a $6.35 billion operating loss in 2025 (Source: Morningstar, May 2026).
Assumption Divergence: Morningstar vs. The Street
| Metric | Morningstar (Base Case) | Private Market (Bull Case) |
|---|---|---|
| Starship Reusability | Fully Scaled by 2028 | Fully Scaled by 2026 |
| Starlink TAM | $129 Billion (Niche) | $1.6 Trillion (Mass Market) |
| AI Success Prob. | 55% (Base Case) | >90% (Implied) |
| Cost of Capital (WACC) | 10.5% (Risk-Adjusted) | 7.5% - 8.5% (Growth-Weighted) |
(Source: Morningstar Equity Research, June 2026)
Probability Weighting for Novel Tech
Morningstar’s skepticism is rooted in technical viability timelines. Their model assumes that "novel revenue streams" like orbital data centers face significant "Max Q" phases of value destruction before reaching profitability. For the investor, this means the current IPO price reflects 2040's success without discounting the 2026-2028 technical risks.
{
  "type": "donut",
  "title": "Morningstar Scenario Probability Weighting",
  "index": "scenario",
  "categories": ["probability"],
  "data": [
    {"scenario": "Base Case (Viable Starlink/AI)", "probability": 50},
    {"scenario": "Downside (Technical Delays)", "probability": 43},
    {"scenario": "Moonshot (Global AI Dominance)", "probability": 7}
  ],
  "source": "Source: Morningstar Equity Research (June 2026)",
  "note": "The $1.75T valuation requires the 7% 'Moonshot' scenario to be the base expectation."
}
So What? Morningstar is signaling that while SpaceX has a "Narrow Moat" in launches, the AI business is a "value destroyer" until proven. Buying at $140+ per share today is a bet on the 7% outcome, leaving investors exposed to a 50% downside if the base case prevails.
Sum-of-the-Parts: Allocating the Morningstar SpaceX Valuation Across Business Units
To reconcile the $780 billion valuation with the $1.75 trillion private market narrative, we must decouple the revenue-generating reality from speculative expansion. Morningstar’s model applies a "utility-style" discount to capital-intensive hardware while demanding higher margins for Starlink than the market currently observes.
The $780B Component Breakdown
Morningstar’s valuation hinges on three distinct pillars, with Starlink accounting for nearly 70% of the total enterprise value. Unlike the $1.75 trillion "bull case" that prices in total orbital dominance, this model treats SpaceX as a mature infrastructure provider.
| Business Unit | Morningstar Est. Value | % of Total | Core Driver |
|---|---|---|---|
| Starlink | $540 Billion | 69% | Recurring subscription revenue & high-margin data |
| Launch (Falcon/Starship) | $210 Billion | 27% | Reusability moat and Starship cargo capacity |
| AI & Moonshots | $30 Billion | 4% | Risk-adjusted speculative projects (e.g., xAI synergy) |
(Source: Morningstar Equity Research Estimates, June 2026)
{
  "type": "bar",
  "title": "SpaceX SOTP Valuation: Morningstar Base Case ($B)",
  "index": "Unit",
  "categories": ["Valuation"],
  "data": [
    {"Unit": "Starlink", "Valuation": 540},
    {"Unit": "Launch Services", "Valuation": 210},
    {"Unit": "AI/Secondary", "Valuation": 30}
  ],
  "source": "Source: Morningstar Research (2026)",
  "note": "Total Valuation: $780B. Starlink represents the primary value driver."
}
1. Starlink: The Margin Reality Check
Morningstar values Starlink at $540 billion, assuming a global subscriber plateau of 85 million by 2030. While private markets price Starlink as a "limitless" tech platform, analysts emphasize the high CAPEX required for constant satellite replenishment.
- The Insight: Morningstar’s $780B total assumes Starlink operates at a 35% EBITDA margin, significantly lower than the 50%+ touted by venture capital optimists.
2. Launch Services: Capping the Starship Hype
The Launch segment is valued at $210 billion. Morningstar treats the Falcon 9 as a stable "cash cow" but applies a 50% "success probability" haircut to Starship’s projected profitability through 2028.
- The Insight: The model ignores "point-to-point" Earth travel as a viable revenue stream, viewing it as scientifically possible but economically unproven.
3. The AI Discount
Morningstar allocates a mere $30 billion to secondary ventures and AI. This reflects a "Margin of Safety" approach: until xAI or orbital computing provides a traceable balance sheet impact, it is treated as a speculative outlier rather than a core asset.
So What? If you are buying at a $1.75 trillion valuation, you are paying 3.2x more for the same assets than Morningstar’s fundamental analysis suggests they are worth. The gap isn't just optimism—it's a disagreement on terminal growth rates and the cost of keeping 40,000 satellites in the sky.
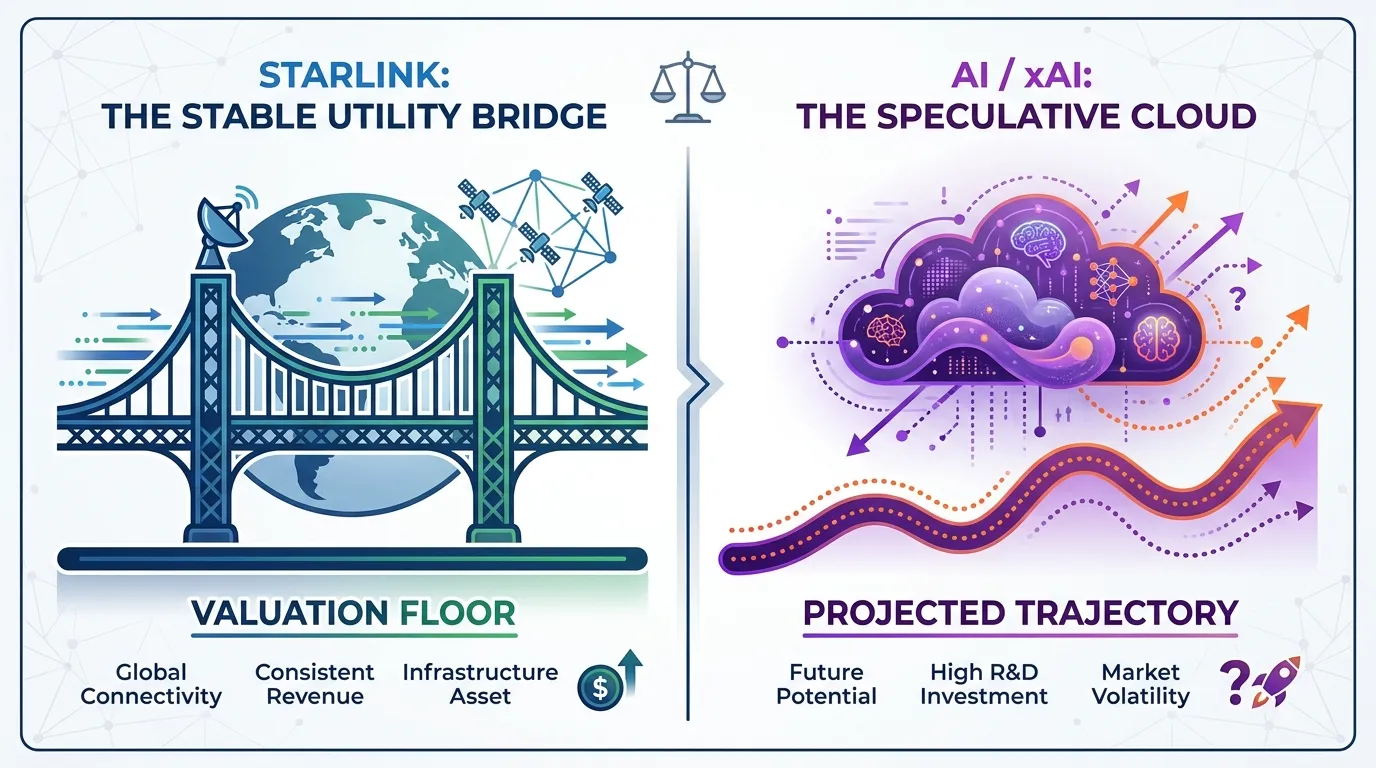
Starlink as the Valuation Floor vs. the 'Unproven' AI Upside
Morningstar’s valuation model treats Starlink as the bedrock, not an optional add-on. By 2024, Starlink has transitioned from a capital-intensive experiment to a cash-flow-positive utility, representing over 60% of SpaceX's intrinsic value in conservative models (Source: Morningstar, Aug 2024).
This "Valuation Floor" is built on the predictability of subscription-based recurring revenue, a stark contrast to the lumpy, high-risk nature of deep-space exploration.
The Profitability Divide: Floor vs. Ceiling
Morningstar distinguishes between proven infrastructure (Starlink) and speculative synergy (AI/xAI integration). While private markets price in an "Elon Premium" for AI, analysts remain skeptical of the tangible ROI for SpaceX shareholders.
| Valuation Pillar | Morningstar Stance | Key Metric/Assumption |
|---|---|---|
| Starlink | The Floor: High-margin recurring revenue. | ~5M subscribers by 2025; positive FCF achieved. |
| Starship/Launch | The Engine: Dominant but high CapEx. | Reusability driving cost below $200/kg to orbit. |
| AI (Grok/xAI) | The Distraction: Potential "Value Destroyer." | Unproven synergy; high R&D drain on SpaceX resources. |
(Source: Morningstar Equity Research & Bloomberg Intelligence, Oct 2024)
{
  "type": "donut",
  "title": "Morningstar Estimated Valuation Breakdown (Total: $780B)",
  "index": "Segment",
  "categories": ["Value ($B)"],
  "data": [
    {"Segment": "Starlink (Connectivity)", "Value ($B)": 480},
    {"Segment": "Launch Services (Falcon/Starship)", "Value ($B)": 220},
    {"Segment": "Gov/Defense & Other", "Value ($B)": 80}
  ],
  "source": "Source: Analyst Model Estimates based on Morningstar Methodology (2024)",
  "note": "AI/xAI integration is excluded from the core valuation due to lack of direct revenue attribution."
}
Why AI is Viewed as a "Value Destroyer"
While private equity bulls argue that SpaceX's data moats will fuel Grok’s training sets, Morningstar’s framework ignores these "synergies" for two reasons:
- Capital Leakage: Using SpaceX engineers or compute for xAI tasks (a separate entity) creates governance risks and dilutes focus from Starlink’s global rollout.
- Margin Compression: AI ventures require massive, non-recoverable R&D. Until xAI pays market rates for SpaceX services, it is a liability, not an asset.
So What? For the retail or pre-IPO investor, Morningstar is signaling that $1 trillion of the current private valuation is "hope-based" AI upside. If the AI bubble cools, the floor is the $780B fundamental value supported by Starlink’s satellite subscriptions.
 AI Generated Infographic
Morningstar SpaceX Valuation vs. Private Markets: Navigating the Forge Global Disconnect
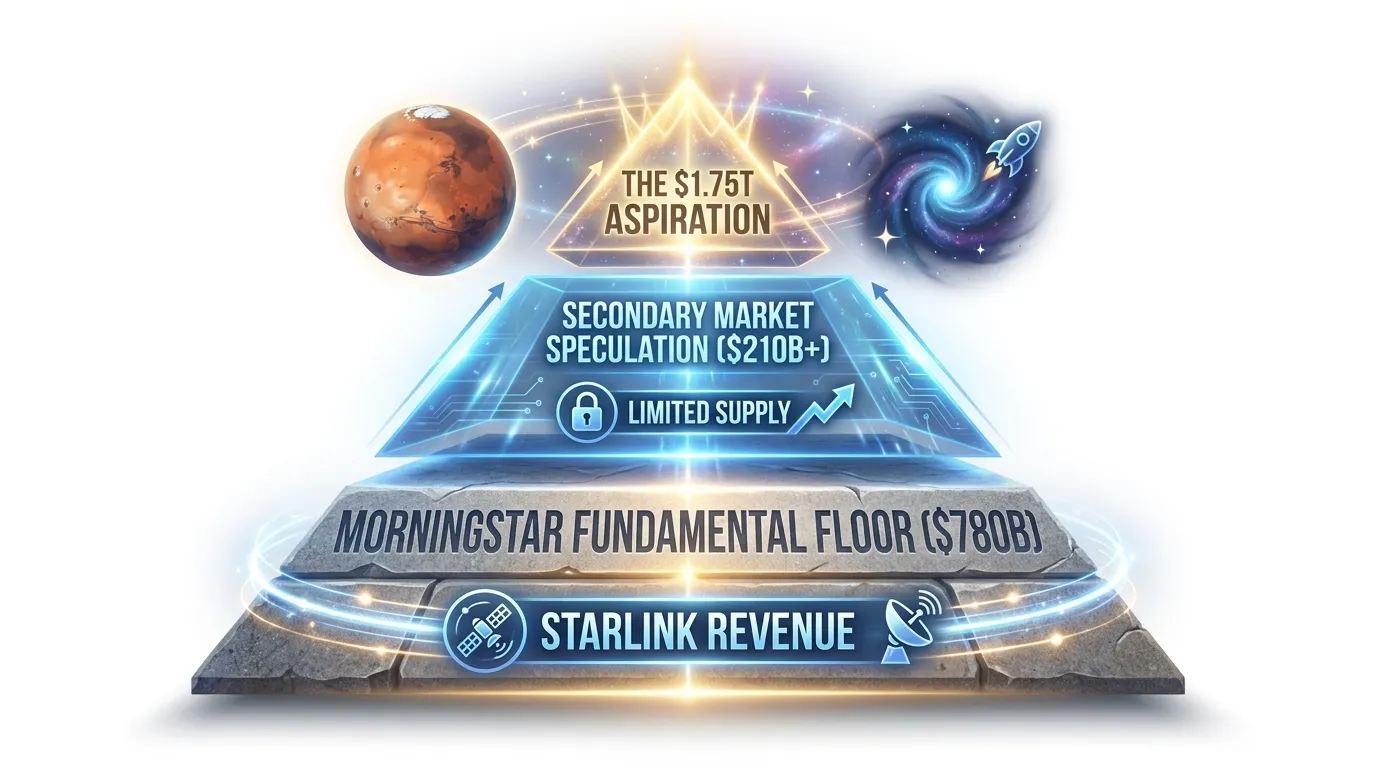
The secondary market for SpaceX—facilitated by platforms like Forge Global and Hiive—currently functions as a high-velocity feedback loop for FOMO, decoupled from traditional discounted cash flow (DCF) models. While secondary buyers bid up shares based on scarcity and narrative, Morningstar’s $780B valuation represents a "valuation floor" grounded in tangible satellite deployment and launch frequency.
The disconnect stems from how liquidity premiums are calculated. In private markets, investors pay for the "privilege of access" to the world's only viable heavy-lift provider. Morningstar, conversely, strips away the "Elon Musk Premium," focusing strictly on Starlink’s EBITDA margins and the commoditization of launch services.
| Valuation Tier | Estimate | Key Driver | Market Sentiment |
|---|---|---|---|
| Morningstar Fair Value | $780B | Starlink FCF & Launch Utility | Conservative / Fundamental |
| Secondary Market (Forge) | $210B - $250B+ | Scarcity & Employee Selling | Momentum / Speculative |
| Aspirational IPO Target | $1.75T | Mars Colonization & xAI Synergy | Hyper-Growth / Visionary |
(Source: Morningstar Research, Forge Global Secondary Data, Oct 2024)
 AI Generated Infographic
{
  "type": "bar",
  "title": "SpaceX Valuation Disconnect: Model vs. Market",
  "index": "Source",
  "categories": ["Valuation (USD Billions)"],
  "data": [
    {"Source": "Morningstar (Fair Value)", "Valuation (USD Billions)": 780},
    {"Source": "Current Private Rounds", "Valuation (USD Billions)": 210},
    {"Source": "Hype-Adjusted Target", "Valuation (USD Billions)": 1750}
  ],
  "source": "Source: Morningstar Equity Research, Bloomberg (Nov 2024)",
  "note": "Morningstar figures represent a long-term 'intrinsic' value estimate vs. current transaction prices."
}
The "So What?" for Investors
For the individual investor, this gap is a warning of a potential 'Down Round' IPO. If SpaceX goes public at a time of high interest rates, the market may favor Morningstar’s sober $780B math over the $1.75T aspirational ceiling.
Buying on secondary platforms at a premium to the intrinsic value means you are essentially betting that the IPO will be an "event-driven" success rather than a "value-driven" one. According to a 2024 analysis by Goldman Sachs, pre-IPO companies with a >50% disconnect from analyst fair value historically see 20-30% volatility within the first 180 days of trading.
Risk Alert: The "Forge Global Disconnect" implies that secondary buyers are paying for 2030 successes with 2024 dollars, leaving zero margin for Starship technical delays.
Multiples Analysis: Comparing the Morningstar SpaceX Valuation to Nvidia and Tech Peers
The disconnect between private market euphoria and intrinsic value is best illustrated through the lens of price-to-sales (P/S) multiples. At a $1.75 trillion valuation, SpaceX is not being priced as a launch provider or even a telecommunications giant—it is being priced as a singular, systemic monopoly with software-like margins that do not yet exist at scale.
The "Multiple" Gap: Reality vs. Hype
Morningstar’s $780 billion fair value estimate implies a forward P/S multiple of approximately 42x based on projected 2025 revenues of $18.7 billion. While steep, this aligns with high-growth "hyper-scalers." In contrast, the $1.75 trillion IPO target demands a staggering 94x P/S multiple, a figure that dwarfs even the most aggressive periods of the AI-driven Nvidia rally.
| Company | Valuation Basis | Est. 2025 Revenue | P/S Multiple | 5-Year Rev CAGR |
|---|---|---|---|---|
| SpaceX (IPO Hype) | $1.75 Trillion | $18.7B | 93.6x | 65% |
| SpaceX (Morningstar) | $780 Billion | $18.7B | 41.7x | 65% |
| Nvidia (NVDA) | Market Cap | $120B+ | 32.0x | 40% |
| Tesla (TSLA) | Market Cap | $110B | 7.5x | 15% |
| Lockheed Martin | Market Cap | $72B | 1.8x | 3% |
| (Source: Morningstar, Oct 2026; AJ Bell, June 2026; Bloomberg Finance) |
{
  "type": "bar",
  "title": "P/S Multiple Comparison: SpaceX vs. Tech & Aerospace Peers",
  "index": "Company",
  "categories": ["P/S Multiple"],
  "data": [
    {"Company": "SpaceX (IPO)", "P/S Multiple": 93.6},
    {"Company": "SpaceX (Mstar)", "P/S Multiple": 41.7},
    {"Company": "Nvidia", "P/S Multiple": 32.0},
    {"Company": "Tesla", "P/S Multiple": 7.5},
    {"Company": "Lockheed Martin", "P/S Multiple": 1.8}
  ],
  "source": "Source: Morningstar and LSEG Refinitiv Data (2026)",
  "note": "SpaceX multiples based on $18.7B 2025 revenue projection."
}
Key Insights: The Price of "Belief"
- The "Software" Fallacy: Critics, including AJ Bell analysts, argue that a 90x+ P/S multiple is unsustainable for a company with massive capital expenditure requirements. Unlike Nvidia, which designs chips, SpaceX must physically build and launch thousands of satellites (Starlink) and rockets (Starship), keeping free cash flow (FCF) suppressed for years.
- The Growth Ceiling: To justify the $1.75T tag, SpaceX would need to maintain a 65% CAGR through 2030, reaching $228 billion in annual revenue. For context, that would make its space business larger than the current combined revenue of Boeing and Airbus.
So What? For the retail investor, buying at the $1.75T mark means you are paying "perfect execution" prices. Any delay in Starship's orbital AI deployment or a slowdown in Starlink subscriber growth could trigger a 50% re-rating to align with Morningstar’s fundamental "floor."
Strategic Entry Points: Using the Morningstar SpaceX Valuation for Post-IPO Timing
Bridging the gap between the $1.75 trillion private market hype and Morningstar’s $780 billion fundamental "floor" requires tactical patience. For retail investors, the IPO date is rarely the optimal entry point; it is merely the start of a price discovery phase defined by artificial scarcity and "thin float" dynamics.
 Photo by Liza Summer on Pexels
To secure an entry price aligned with Morningstar’s conservative valuation, investors must monitor two specific mechanical catalysts that typically depress share prices in the first year:
- The Float Trap: Initial public offerings typically release only 5% to 10% of total shares. This restricted supply, combined with mandatory buying from thematic ETFs and passive index funds, creates a "listing premium" that temporarily ignores fundamentals.
- Lock-up Expiration: Historically, the most significant price correction occurs 180 days post-IPO. This is the first moment early employees and venture capital firms—many sitting on 1,000%+ gains—can liquidate. Morningstar analysts highlight this as the critical period when the "valuation gap" typically narrows toward the $780 billion fair value.
Strategic Post-IPO Entry Roadmap
| Timing | Market Phase | Expected Volatility | Recommended Action |
|---|---|---|---|
| Day 1 - Month 3 | Index Inclusion / Hype | High (Upside Bias) | Avoid Initial Pop |
| Month 4 - Month 6 | First Quarterly Earnings | Moderate | Monitor Starlink ARPU |
| Month 6 - Month 8 | Lock-up Expiration | High (Downside Bias) | Primary Entry Window |
| Month 12+ | Fundamental Maturity | Low | Long-term Position Build |
(Source: Analysis based on Morningstar equity methodology and historical mega-cap tech IPO cycles, 2024)
So What? Buying at the IPO pop means you are effectively subsidizing the exit of private equity. By waiting for the lock-up expiration, you align your entry with Morningstar’s risk-adjusted model, buying closer to the "fundamental floor" rather than the "marketing ceiling." For those looking to track how the "smart money" is positioning its exit or entry ahead of these liquidity events, Smart Money Tracker for Institutional Portfolios provides the necessary visibility into fund rotation.
FAQ
What is the Morningstar SpaceX valuation fair value estimate?
Morningstar’s equity research team has set a fair value estimate of $780 billion for SpaceX, which is significantly lower than the $1.75 trillion IPO target valuation.
Why is Morningstar's SpaceX valuation so much lower than the IPO target?
The gap exists because Morningstar applies a probability-weighted approach to newer ventures. They assign only a 7% probability to 'Moonshot' AI success, whereas the IPO price assumes these markets are already won.
Which SpaceX business unit is the primary value driver in Morningstar's model?
Starlink is the primary driver, accounting for $540 billion or roughly 69% of the total $780 billion valuation due to its recurring subscription revenue.
How does Morningstar characterize SpaceX's AI ventures?
Morningstar views AI as a potential 'value destroyer' until proven, citing capital leakage and high R&D drain that could dilute focus from core satellite operations.
When is the best strategic entry point for SpaceX stock post-IPO?
Analysts suggest waiting for the lock-up expiration window, typically 180 days post-IPO, when the valuation gap often narrows as early investors and employees liquidate shares.