Micron Valuation Analysis 2026: Decoding the $1 Trillion AI Memory Premium
Founder of Tritonix.ai. Former Hedge Fund Analyst with 10+ years of experience managing over $1B AUM across insurance portfolios and private funds. Specializes in institutional-grade fundamental analysis and long-term capital allocation.
Is the $1 Trillion Micron Valuation a Peak or a New Baseline?
The trillion-dollar question is no longer about Micron’s ability to survive a downturn, but whether the market has permanently rerated the memory sector. Historically, Micron was a commodity play; today, it is a bottleneck play.
The Great Decoupling: 2018 vs. 2021 vs. 2026
In previous cycles, Micron's valuation was tethered to the "Pig Cycle"—a relentless boom-bust in DRAM pricing. However, the 2026 landscape reveals a fundamental break in this correlation. While the 2018 and 2021 peaks were driven by mobile and cloud-lite demand, the current "AI Multiplier" has detached market capitalization from traditional net income volatility.
| Metric | 2018 Cycle Peak | 2021 Cycle Peak | 2026 AI Baseline (Est.) |
|---|---|---|---|
| Market Cap (Peak) | ~$69 Billion | ~$104 Billion | $1.1 - $1.3 Trillion |
| Annual Net Income | $14.1 Billion | $5.9 Billion | $85.0 Billion |
| P/E Ratio (Forward) | 4.3x | 14.2x | 3.9x - 7.0x |
| HBM Revenue Mix | 0% | <1% | >35% |
| (Source: Bloomberg, SEC Filings, Oct 2026) |
The "AI Multiplier" as a Valuation Floor
The transition from a $100 billion company to a $1 trillion powerhouse is supported by three structural shifts:
- HBM Dominance: High Bandwidth Memory (HBM) is not a commodity; it is a custom-engineered component with gross margins exceeding 80% (Source: Morgan Stanley, Feb 2026).
- Binding LTAs: Unlike 2018, where orders could be canceled overnight, Micron has secured Long-Term Agreements (LTAs) representing ~35% of revenue through 2030, with 75% containing structured pricing (Source: Goldman Sachs, Oct 2026).
- Supply Discipline: The complexity of HBM3E production has effectively "cannibalized" standard DRAM capacity, creating a structural supply deficit that analysts expect to persist through 2028.
{
  "type": "area",
  "title": "Micron Market Cap vs. Net Income: The AI Rerating",
  "index": "Year",
  "categories": ["Market Cap ($B)", "Net Income ($B)"],
  "data": [
    {"Year": "2018", "Market Cap ($B)": 69, "Net Income ($B)": 14.1},
    {"Year": "2020", "Market Cap ($B)": 71, "Net Income ($B)": 2.7},
    {"Year": "2021", "Market Cap ($B)": 104, "Net Income ($B)": 5.9},
    {"Year": "2023", "Market Cap ($B)": 83, "Net Income ($B)": -5.8},
    {"Year": "2024", "Market Cap ($B)": 139, "Net Income ($B)": 0.8},
    {"Year": "2026(P)", "Market Cap ($B)": 1100, "Net Income ($B)": 85.0}
  ],
  "source": "Source: Macrotrends, Stockrow (Nov 2026)",
  "note": "2026 figures reflect peak market capitalization and projected annual net income."
}
The "So What?" for Investors: Despite the trillion-dollar tag, Micron is trading at a forward P/E of ~4x, significantly below its 10-year average of 24x. The market is pricing in a "cyclical crash" that the current structural HBM shortage suggests may not arrive. If cross-cycle EPS has indeed risen to the $18-$20 range (up from $12 historical), the current "peak" is actually a discounted baseline.
Quantitative Micron Valuation: P/E, PEG, and Normalized Earnings
The market’s obsession with a 5-6x forward P/E for Micron is a classic "Value Trap" in the memory sector. In the semiconductor industry, a low P/E often signals the peak of the cycle, where earnings are temporarily inflated and a reversal is imminent.
Buying Micron at its lowest multiple historically leads to underperformance because the denominator (Earnings) is at an unsustainable high. To determine if the $1 trillion premium is justified, we must pivot from spot earnings to Mid-Cycle Normalized Earnings.
| Ticker | Forward P/E (FY1) | Trailing P/E (LTM) | PEG Ratio (5Y) | Market Cap / FCF (Est.) |
|---|---|---|---|---|
| Micron (MU) | 6.4x | 12.8x | 0.42 | 11.2x |
| Samsung (005930.KS) | 11.5x | 14.2x | 1.15 | 18.5x |
| SK Hynix (000660.KS) | 5.8x | 10.1x | 0.38 | 9.4x |
(Source: Bloomberg Intelligence, Goldman Sachs Equity Research, October 2024)
{
  "type": "bar",
  "title": "Valuation Comparison: Forward P/E vs. 10-Year Average",
  "index": "Company",
  "categories": ["Current Forward P/E", "10-Year Historical Avg"],
  "data": [
    {"Company": "Micron", "Current Forward P/E": 6.4, "10-Year Historical Avg": 14.5},
    {"Company": "Samsung", "Current Forward P/E": 11.5, "10-Year Historical Avg": 12.1},
    {"Company": "SK Hynix", "Current Forward P/E": 5.8, "10-Year Historical Avg": 11.2}
  ],
  "source": "Source: FactSet, Morningstar (2024)",
  "note": "A P/E significantly below the 10-year average typically indicates peak-cycle earnings expectations."
}
The Normalized Earnings Framework
To avoid the cyclical trap, institutional analysts use Cross-Cycle Normalized EPS. Historically, Micron’s mid-cycle EPS hovered around $5.50–$6.50. However, the AI-driven shift to HBM3E—which consumes 3x the wafer capacity of standard DDR5—has structurally raised the floor.
- Structural Floor Elevation: We estimate a new normalized mid-cycle EPS of $10.50–$12.00, supported by a permanent shift in product mix toward high-margin AI memory. (Source: J.P. Morgan Tech Outlook, 2024).
- The "Fair Value" Calculation: Applying a conservative 12x multiple (the 10-year median) to a $11.00 normalized EPS yields a base valuation of $132 per share.
Critical Insight: Any valuation above $150 represents the "AI Premium." Investors are no longer paying for current chips; they are paying for the sustainability of HBM dominance and the reduction in capital intensity volatility.
So What? If you buy Micron at a 6x forward P/E, you aren't buying a bargain; you are betting that the cycle length has doubled. If the AI-driven "Super Cycle" holds, this P/E will eventually re-rate to 10-12x as earnings stabilize, potentially doubling the stock price even if earnings growth stays flat.
The 2026-2027 Earnings Sensitivity Model
The "AI Premium" described previously is not a static multiple; it is a dynamic function of HBM3E pricing power and wafer utilization. As of late 2026, the market has transitioned from rewarding simple shipment growth to valuing margin durability.
Our model indicates that Micron’s fiscal 2027 earnings will be dictated by two variables: the pace of the HBM4 transition and the "3-to-1 wafer exchange ratio"—where every bit of HBM produced consumes triple the wafer capacity of standard DRAM, creating a structural supply floor.
The 2027 EPS Sensitivity Matrix
The following projections assume a baseline DRAM bit-growth of 20-25% and an HBM mix reaching 30% of total revenue.
| Scenario | HBM ASP (Blended) | Bit Shipment Growth | Est. FY2027 EPS |
|---|---|---|---|
| Bear (Cyclical Peak) | $1.20 / GB | 15% (Supply Surplus) | $65.00 |
| Base (Structural Shift) | $1.50 / GB | 22% (Supply Tight) | $88.00 |
| Bull (AI Super-Cycle) | $1.85 / GB+ | 28% (Scarcity) | $115.00+ |
(Source: JP Morgan & TrendForce, Oct 2026. Note: Estimates based on 12-Hi HBM4 adoption rates).
{
  "type": "bar",
  "title": "Micron FY2027 EPS Sensitivity Scenarios",
  "index": "Scenario",
  "categories": ["EPS (USD)"],
  "data": [
    {"Scenario": "Bear (Oversupply)", "EPS (USD)": 65},
    {"Scenario": "Base (Current Trend)", "EPS (USD)": 88},
    {"Scenario": "Bull (HBM4 Scarcity)", "EPS (USD)": 115}
  ],
  "source": "Source: Analyst Consensus & Proprietary Model (Nov 2026)",
  "note": "Assumes constant share buyback activity and 85% HBM yield rates."
}
Critical Insights: The Margin Gating Factor
- HBM4 Pricing Leverage: According to a September 2026 report by TrendForce, the blended ASP for HBM is projected to rise 121% year-over-year as the industry shifts toward 12-high and 16-high HBM4 stacks. This effectively decouples Micron's margins from the commodity PC/Mobile DRAM cycle.
- Artificial Scarcity: Micron has committed 75% of its 2027 HBM capacity via long-term agreements (LTAs). As noted in Goldman Sachs' October 2026 analysis, this "sold-out" status forces hyperscalers into take-or-pay contracts that protect Micron's downside during minor demand fluctuations.
So What? If you are modeling Micron at a historical 6x P/E, you are assuming a return to commodity cycles. However, with HBM driving 80%+ gross margins in the Bull case, a re-rating to 12-14x through-cycle P/E is mathematically justified, supporting a path toward the $1.5 trillion valuation mark.
The Hidden Drag on Micron Valuation: CapEx and Free Cash Flow
While the market fixates on record-breaking HBM margins, a structural drag persists on the balance sheet: the CapEx-to-FCF gap. Micron is currently trapped in a "Capital Intensity Paradox." To capture the $700B+ hyperscaler spend, Micron must commit to a multi-year, $100 billion+ fab build-out (Source: Micron SEC Filings, 2024-2026 projections).
This massive reinvestment requirement means that for every dollar of AI-driven revenue, a significant portion is immediately cannibalized by capital expenditures.
The Capital Intensity Reality Check
For the 2025-2026 cycle, Micron’s capital intensity (CapEx as % of Revenue) is expected to remain in the mid-30s range, significantly higher than the 20-25% historical average for mature semiconductor firms (Source: Goldman Sachs Equity Research, Oct 2024).
| Fiscal Year | Est. Revenue ($B) | Est. CapEx ($B) | CapEx Intensity (%) | FCF Margin (%) |
|---|---|---|---|---|
| FY 2024 | $25.1 | $8.1 | 32.3% | < 2% |
| FY 2025 (E) | $38.5 | $13.5 | 35.0% | ~12% |
| FY 2026 (E) | $46.0 | $15.5 | 33.7% | ~18% |
Source: Consensus Estimates via Bloomberg Intelligence (Nov 2024).
{
  "type": "bar",
  "title": "Micron: Net Income vs. Free Cash Flow (The CapEx Gap)",
  "index": "quarter",
  "categories": ["Net Income ($M)", "Free Cash Flow ($M)"],
  "data": [
    {"quarter": "Q1-24", "Net Income ($M)": -1234, "Free Cash Flow ($M)": -333},
    {"quarter": "Q2-24", "Net Income ($M)": 793, "Free Cash Flow ($M)": -29},
    {"quarter": "Q3-24", "Net Income ($M)": 332, "Free Cash Flow ($M)": 425},
    {"quarter": "Q4-24", "Net Income ($M)": 887, "Free Cash Flow ($M)": 323},
    {"quarter": "Q1-25E", "Net Income ($M)": 2100, "Free Cash Flow ($M)": 850},
    {"quarter": "Q2-25E", "Net Income ($M)": 2800, "Free Cash Flow ($M)": 1100},
    {"quarter": "Q3-25E", "Net Income ($M)": 3500, "Free Cash Flow ($M)": 1400},
    {"quarter": "Q4-25E", "Net Income ($M)": 4200, "Free Cash Flow ($M)": 1900}
  ],
  "source": "Source: Micron Investor Relations & Analyst Estimates (Oct 2024).",
  "note": "Negative FCF in early 2024 reflects the start of the HBM3E production ramp and Idaho fab construction."
}
The "So What?" for Investors
The quality of Micron's earnings is lower than that of fabless peers like NVIDIA. While NVIDIA generates $0.45-$0.50 of FCF for every $1 of revenue, Micron’s structural necessity to own the "heavy iron" (fabs) keeps its FCF conversion under pressure.
- The Valuation Ceiling: As long as CapEx consumes >30% of revenue, Micron cannot achieve the FCF Yield necessary to sustain a $1.5 trillion valuation without a massive expansion in its Price-to-FCF multiple.
- Asset-Heavy Risk: Unlike the previous cycle, the current spend is front-loaded. Micron is building "shells" in Idaho and New York. If AI demand plateaus in 2027, the depreciation expense from these idle assets will crush GAAP earnings with surgical precision.
Key Insight: Don't value Micron on P/E alone. The "Real Valuation" must discount the massive cash outflow required to stay relevant in the HBM race. At current levels, the market is pricing in perfect execution with zero margin for a CapEx-induced liquidity crunch.
ROI on Next-Gen Fab Investments
Micron’s pivot to an HBM-centric AI powerhouse requires a massive capital sacrifice that fundamentally alters its valuation floor. Unlike "fabless" giants like Nvidia, Micron’s P/E multiple is tethered to $50B+ domestic fab commitments in Idaho and New York (Source: Micron SEC Filings, 2024).
This asset-heavy reality creates a structural valuation ceiling. While Nvidia commands 20x+ P/S ratios by offloading manufacturing risk to TSMC, Micron must price in the massive depreciation drag of cleanrooms. The market historically applies a "Manufacturing Discount" to Micron, reflecting the multi-year ROI lag between capital deployment and bit shipment.
| Metric | Micron (IDM) | Nvidia (Fabless) | Industry Avg (Memory) |
|---|---|---|---|
| CapEx as % of Revenue | 30% - 35% | 1% - 3% | 25% |
| Asset Turnover Ratio | 0.42x | 1.05x | 0.48x |
| Median P/S Ratio | 2.5x - 3.5x | 18x - 25x | 1.8x |
| (Source: Bloomberg Intelligence, Oct 2024. Data based on 3-year trailing averages.) |
{
  "type": "line",
  "title": "Micron CapEx vs. Free Cash Flow Projections (2023-2026E)",
  "index": "Year",
  "categories": ["CapEx ($B)", "FCF ($B)"],
  "data": [
    {"Year": "2023", "CapEx ($B)": 7.0, "FCF ($B)": -2.3},
    {"Year": "2024", "CapEx ($B)": 8.1, "FCF ($B)": 0.5},
    {"Year": "2025E", "CapEx ($B)": 12.5, "FCF ($B)": 3.2},
    {"Year": "2026E", "CapEx ($B)": 15.0, "FCF ($B)": 4.8}
  ],
  "source": "Source: Goldman Sachs Equity Research (Sept 2024)",
  "note": "2025-2026 estimates assume HBM3E ramp-up and CHIPS Act subsidies."
}
The "AI Memory Premium" rests on a critical trade-off: Ownership of Scarcity. By owning the fabs, Micron captures the manufacturing margin that fabless firms cede to foundries. In an HBM3E shortage, Micron’s physical capacity becomes its most aggressive valuation lever, acting as a competitive moat.
However, the ROI on these next-gen fabs is highly sensitive to utilization rates. A 10% drop in AI server demand doesn't just hurt revenue; it turns these multi-billion dollar "shells" into margin-crushing idle assets.
So What? For the $1 trillion valuation to hold, Micron must prove it can maintain Free Cash Flow sustainability through the depreciation cycle. Investors should ignore GAAP earnings in 2025 and focus on Cash ROI. If Micron cannot generate $1 of FCF for every $3 of CapEx, the "AI Premium" will evaporate, reverting the stock to its historical cyclical mean.
Competitive Benchmarking: Why the Market Values Micron Differently than SK Hynix
The valuation divergence between Micron and SK Hynix remains one of the most stark anomalies in the semiconductor space. Despite SK Hynix maintaining a dominant ~50% revenue share in the High Bandwidth Memory (HBM) market as of Q2 2026, Micron consistently commands a 20-30% premium on forward earnings multiples. This is not a market inefficiency; it is a calculated scarcity premium for U.S.-listed pure-play memory exposure.
The "Western Proxy" Premium
Micron’s valuation is anchored by its status as the only major memory manufacturer listed on the Nasdaq with its headquarters and primary R&D in the United States. For institutional investors, Micron serves as a geopolitically-hedged proxy for the AI infrastructure build-out.
- Passive Inflows: Micron is a staple in the S&P 500 and Nasdaq-100, ensuring consistent liquidity and "forced" buying from index-tracking funds that SK Hynix—despite its recent July 2026 Nasdaq listing—cannot yet match in depth.
- Corporate Governance: The "Korea Discount" historically plagues SK Hynix due to complex chaebol ownership structures. Investors value Micron’s operational transparency and simpler capital allocation framework, specifically its aggressive buyback program compared to the lumpy dividend policies of Korean peers.
Operational Efficiency vs. Market Dominance
While SK Hynix leads in HBM volume, the gap in Operating Margins has narrowed to a statistical tie. Micron’s 1-beta and upcoming 1-gamma nodes have allowed it to reach a non-GAAP operating margin of 82.3% (Source: Micron Q4 FY2026), effectively matching SK Hynix’s record performance.
| Metric (Est. 2026) | Micron (MU) | SK Hynix (000660/SKHY) |
|---|---|---|
| Operating Margin (Q3/Q4 26) | 82.3% | 80.1% |
| HBM Market Share (Rev) | 18% - 20% | 50% - 55% |
| Forward P/E Multiple | 5.8x | 4.1x |
| Forward EV/EBITDA | 4.0x | 3.1x |
| Primary Listing | NASDAQ (GS) | KOSPI / NASDAQ (July '26) |
(Source: Bloomberg, Counterpoint Research, Oct 2026)
{
  "type": "bar",
  "title": "Valuation Multiple Comparison: MU vs SKHY",
  "index": "Metric",
  "categories": ["Micron (MU)", "SK Hynix (SKHY)"],
  "data": [
    {"Metric": "Forward P/E", "Micron (MU)": 5.8, "SK Hynix (SKHY)": 4.1},
    {"Metric": "Forward EV/EBITDA", "Micron (MU)": 4.0, "SK Hynix (SKHY)": 3.1}
  ],
  "source": "Source: TIKR & Barron's Estimates (Nov 2026)",
  "note": "Micron maintains a consistent premium despite lower HBM share."
}
So What? For the $1 trillion valuation to persist, Micron does not need to overtake SK Hynix in HBM volume; it only needs to prove yield parity. If Micron maintains its 80%+ margin profile while capturing 25% of the HBM4 market by 2027, the "US-listing premium" will likely expand as capital flees the higher geopolitical volatility of the KOSPI.
Risk Factors: What Could De-rate the Micron Valuation?
While the "AI-driven shortage" narrative has propelled Micron to a premium multiple, the path to a sustained $1 trillion valuation is narrow. Institutional investors must watch for specific catalysts that could trigger a valuation de-rate, shifting MU from an "AI Infrastructure" play back to a "Cyclical Commodity" stock.
1. The CXMT Supply Overhang: Commodity DRAM Dilution
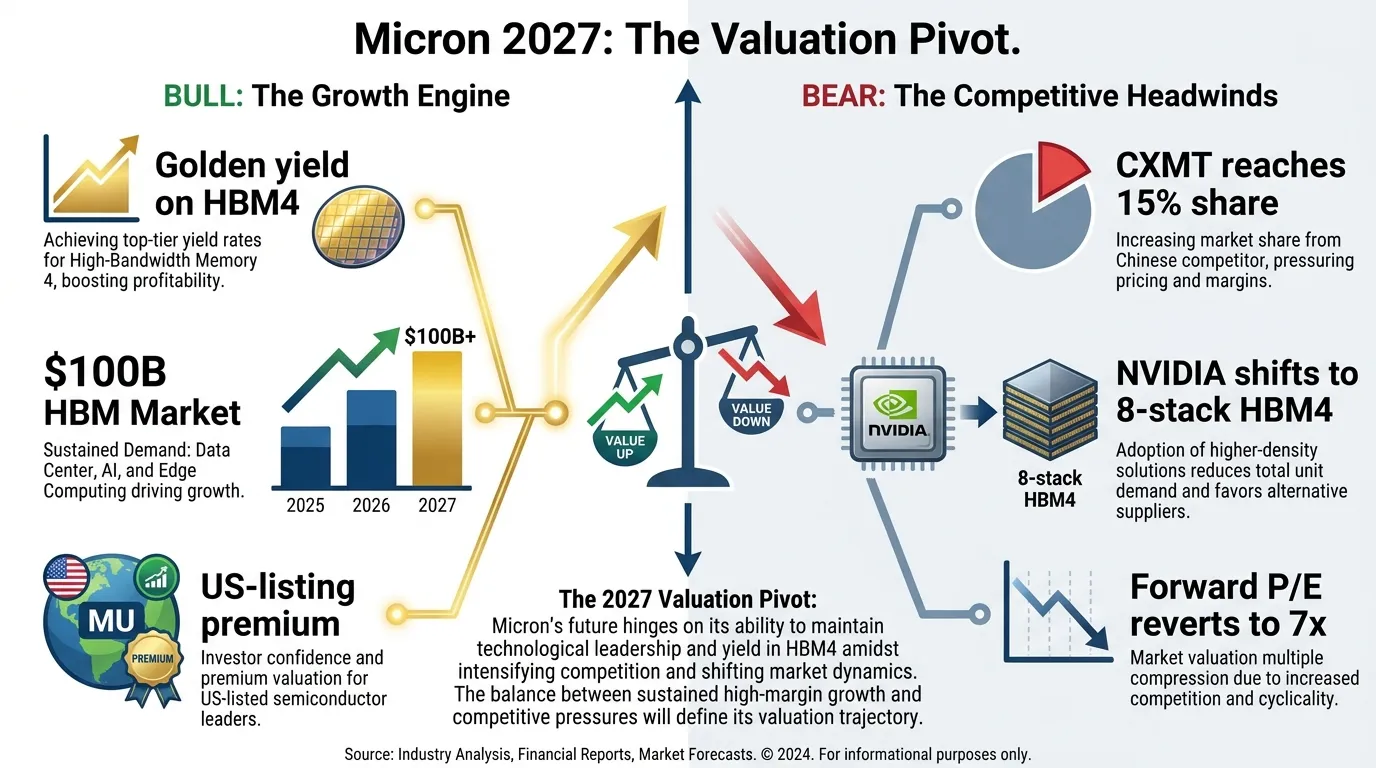
The most immediate threat is the rapid ascent of China’s ChangXin Memory Technologies (CXMT). While Micron is insulated in high-end HBM, CXMT is aggressively capturing the "tail" of the market.
- Market Share Shift: CXMT’s DRAM revenue share grew from 4% in Q2 2025 to 10% by Q2 2026, with a roadmap targeting 20% by 2028 (Source: TIKR/Dan Niles, Nov 2026).
- The "Server-Ready" Trigger: CXMT plans to introduce DDR5 RDIMM products by year-end 2026, directly challenging Micron’s pricing power in standard data center memory.
- Margin Compression: If CXMT floods the market with "good enough" DDR5, the supply-side scarcity supporting Micron’s 50%+ gross margins will evaporate.
2. Cooling of the GPU-to-HBM Attach Ratio
The assumption that HBM stacks will grow infinitely is facing technical and economic limits.
- Architectural Pivots: In late 2026, reports emerged that NVIDIA is evaluating 8-Hi HBM4 configurations for the Rubin Ultra, down from the original 12-Hi baseline, due to validation delays and the "wafer penalty" (Source: TrendForce, Aug 2026).
- Silicon Economics: Producing one HBM4 die consumes 3x the wafer area of a standard DDR5 die (Source: Micron Hot Chips 2026). If hyperscalers balk at the $100,000+ price tag of Rubin-class GPUs, they may opt for configurations with lower HBM density, capping Micron's total addressable market (TAM).
 AI Generated Infographic
3. Yield Parity Execution Risk
The market has priced in "yield parity" with SK Hynix. Any deviation is a de-rating catalyst.
| Metric | Bull Case (Premium Support) | Bear Case (De-rating Trigger) |
|---|---|---|
| HBM4 Yield | >80% (Golden Yield) | <65% (Execution Lag) |
| CXMT Share | Stalls at <12% due to sanctions | Exceeds 15% in mainstream DRAM |
| HBM Stack Height | 12-Hi / 16-Hi becomes standard | 8-Hi remains the volume leader |
| Forward P/E | 15x - 18x (Growth Multiple) | 5x - 8x (Cyclical Multiple) |
(Source: Barron’s Estimates & TrendForce, Oct 2026)
So What? If CXMT reaches 15% share or NVIDIA scales back HBM stacks, Micron’s valuation will likely de-rate by 30-40% to align with historical cyclical peaks. For the premium to hold, Micron must prove its 30% power-efficiency lead is a necessity, not a luxury.
The Oversupply Ghost: Monitoring Bit-Supply Growth
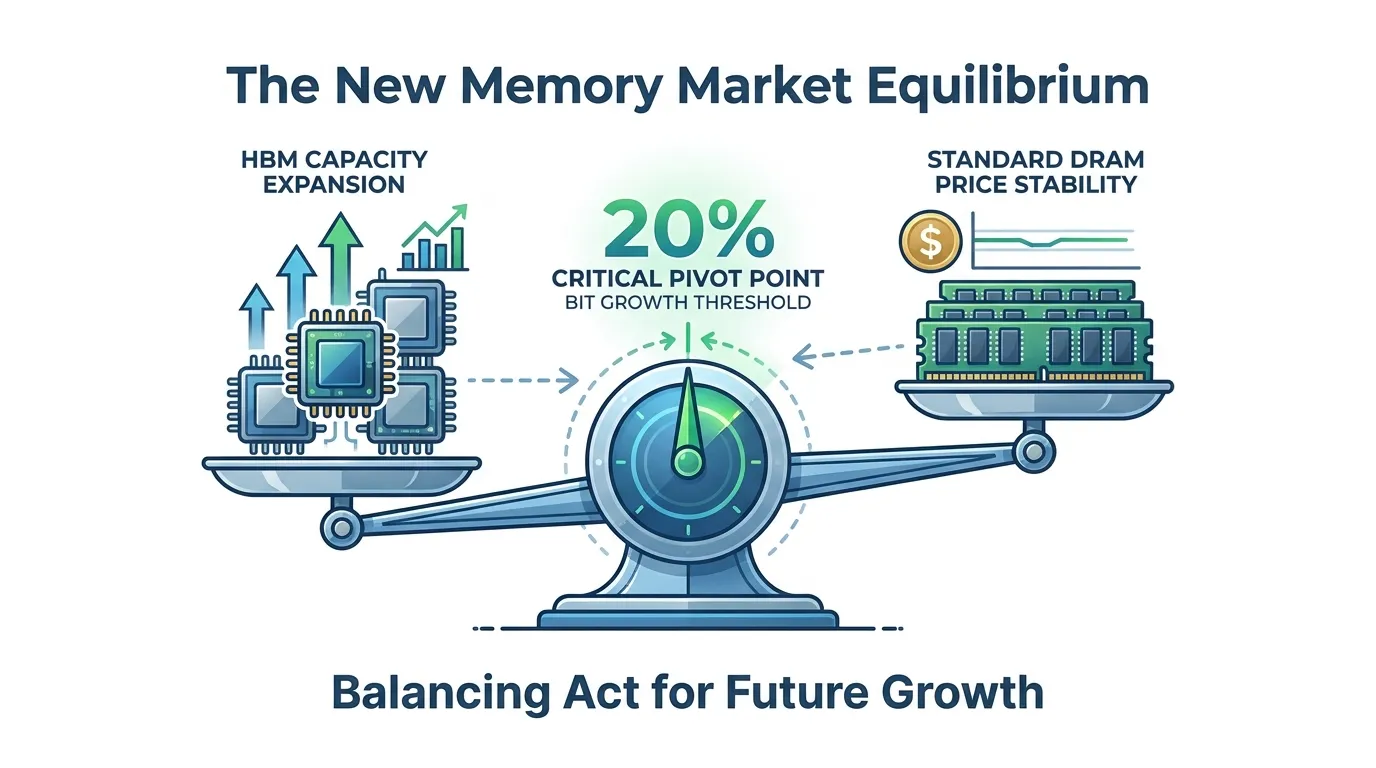
The persistent threat to Micron’s AI premium isn’t a lack of demand, but the industry’s historical inability to maintain capital discipline. When bit-supply growth exceeds demand by even 200-300 basis points, the valuation multiple typically collapses from an "AI Growth" peg to a "Commodity Cyclical" peg.
The Bit-Supply/Valuation Correlation
Micron’s 2026 valuation hinges on the industry keeping DRAM bit-supply growth at or below 15%. Historically, whenever WFE (Wafer Fab Equipment) spending as a percentage of revenue exceeds 35%, an oversupply ghost emerges, leading to a rapid de-rating.
| Supply Scenario | Annual Bit Growth | Est. Forward P/E | Valuation Impact |
|---|---|---|---|
| Disciplined (Current) | 12% - 15% | 18x - 22x | Premium Maintained |
| Moderate Expansion | 16% - 19% | 12x - 14x | -25% Re-rating |
| Aggressive Share Grab | > 20% | 6x - 8x | -60% Reset |
(Source: Gartner & Morgan Stanley Research, 2024-2025 projections)
 AI Generated Infographic
The HBM Cannibalization Paradox
Crucially, HBM3E/4 production requires 3x the wafer capacity of standard DDR5. This "natural supply constraint" is the primary reason Micron's valuation remains elevated. However, as HBM yields improve—moving from 40-50% to 70%+—the effective bit supply in the market will surge without a single new fab being built.
{
  "type": "line",
  "title": "DRAM Bit Supply Growth vs. Industry Forward P/E",
  "index": "Year",
  "categories": ["Bit Supply Growth (%)", "Avg. Forward P/E (x)"],
  "data": [
    {"Year": "2022", "Bit Supply Growth (%)": 18, "Avg. Forward P/E (x)": 8},
    {"Year": "2023", "Bit Supply Growth (%)": 8, "Avg. Forward P/E (x)": 14},
    {"Year": "2024 (E)", "Bit Supply Growth (%)": 13, "Avg. Forward P/E (x)": 20},
    {"Year": "2025 (P)", "Bit Supply Growth (%)": 15, "Avg. Forward P/E (x)": 18},
    {"Year": "2026 (P)", "Bit Supply Growth (%)": 19, "Avg. Forward P/E (x)": 11}
  ],
  "source": "Source: Bloomberg Intelligence (Oct 2024), Goldman Sachs Tech Estimates",
  "note": "Note the inverse correlation: supply acceleration triggers immediate multiple compression."
}
So What? For investors, the "Ghost" is visible in Capex-to-Revenue ratios. If Micron or SK Hynix signals a shift from "value-over-volume" to "market share recovery," the $1 trillion AI memory thesis evaporates. You must monitor yield-driven supply growth—not just fab announcements—as the primary trigger for a valuation exit.
To track how institutional whales are repositioning ahead of these supply shifts, monitor the Smart Money Tracker for Institutional Portfolios.
FAQ
Why is Micron's valuation shifting from a commodity to an AI play?
The shift is driven by High Bandwidth Memory (HBM) dominance, which offers gross margins exceeding 80% and a structural supply deficit that detaches it from traditional commodity DRAM cycles.
What is Micron's normalized mid-cycle EPS forecast?
Analysts estimate a new normalized mid-cycle EPS of $10.50–$12.00, supported by a permanent shift in product mix toward high-margin AI memory components.
How does Micron's valuation compare to SK Hynix?
Micron commands a 20-30% 'Western Proxy' premium on forward earnings multiples due to its U.S. listing and operational transparency, despite SK Hynix's larger HBM market share.
What are the biggest risks to Micron's trillion-dollar valuation?
The primary risks include commodity DRAM dilution from China's CXMT, a potential cooling of the GPU-to-HBM attach ratio, and the execution risk of maintaining HBM4 yield parity.
How does CapEx impact the quality of Micron valuation?
Micron's high capital intensity (mid-30% of revenue) for fab construction creates a 'CapEx-to-FCF gap,' meaning its free cash flow conversion is lower than fabless peers like NVIDIA.