KO Stock Price, Dividend, and Valuation After Coca-Cola's Q3 Raise
Founder of Tritonix.ai. Former Hedge Fund Analyst with 10+ years of experience managing over $1B AUM across insurance portfolios and private funds. Specializes in institutional-grade fundamental analysis and long-term capital allocation.
KO stock's last official close and the run toward $100
The Coca-Cola Company, listed on the New York Stock Exchange under the ticker KO, printed an official cash close of $98.79 on Tuesday, November 17, 2026. The session finished $0.69, or 0.69%, below Monday's close of $99.48, according to Yahoo Finance.
The tape was tight. KO opened at $98.79, traded between $98.53 and $99.61, and settled unchanged from the open. Volume was 19.03 million shares, above the 16.6 million three-month average and close to the 19.25 million 10-day average on Yahoo Finance's key statistics.
That close sits just 1.8% below the $100.56 52-week high, which was the November 16 session peak. The 52-week low of $67.27 was the January 7, 2026 intraday print, when KO closed at $67.54. From that low, the stock has advanced about 47%.
KO is no longer a depressed staple. It is trading within a few dollars of a 52-week high after a roughly 40% rebound over the past year.
Yahoo Finance puts the 52-week change at 39.68%, versus 12.08% for the S&P 500 over the same window. The official close a year earlier, on November 17, 2025, was $70.68. From the December 31, 2025 close of $69.91, the year-to-date gain is about 41%.
The rally has left KO well above its trend averages. Yahoo's 50-day moving average is $91.05 and the 200-day is $83.47, so the November 17 close sits about 8.5% and 18.4% above those lines. Traders mapping the November 16 high against those averages can mark the same official prints in Tritonix AI's technical analysis tools.
The post-earnings path matters as much as the year-to-date move. KO closed at $91.18 on October 27, the day Coca-Cola reported third-quarter results, down 1.6% from $92.70 the prior session. From that print to November 17, the stock added about 8.4%.
{
  "type": "line",
  "title": "KO Official Closes from Year-End 2025 to November 17, 2026",
  "index": "Date",
  "categories": ["Close (US$)"],
  "data": [
    {"Date": "Dec 31", "Close (US$)": 69.91},
    {"Date": "Jan", "Close (US$)": 74.81},
    {"Date": "Feb", "Close (US$)": 81.56},
    {"Date": "Mar", "Close (US$)": 76.05},
    {"Date": "Apr", "Close (US$)": 78.76},
    {"Date": "May", "Close (US$)": 79.01},
    {"Date": "Jun", "Close (US$)": 81.27},
    {"Date": "Jul", "Close (US$)": 87.59},
    {"Date": "Aug", "Close (US$)": 88.67},
    {"Date": "Sep", "Close (US$)": 86.08},
    {"Date": "Oct", "Close (US$)": 94.08},
    {"Date": "Nov 17", "Close (US$)": 98.79}
  ],
  "source": "Source: Yahoo Finance official monthly closes for December 2025 through October 2026, and the official NYSE cash close on November 17, 2026.",
  "note": "November 17 is the last official U.S. cash close, not a month-end settlement. The 52-week high of $100.56 was the November 16, 2026 session peak."
}
| Metric | Official print | As of |
|---|---|---|
| Last close | $98.79 | Nov 17, 2026 |
| Day change | -$0.69 (-0.69%) | Nov 17, 2026 |
| Session range | $98.53–$99.61 | Nov 17, 2026 |
| Volume / 3-month average | 19.03M / 16.6M | Nov 17, 2026 |
| 52-week range | $67.27–$100.56 | Low Jan 7; high Nov 16 |
| 50-day / 200-day average | $91.05 / $83.47 | Yahoo Finance |
| Market capitalization | $427.95B | Nov 17, 2026 |
Source: Yahoo Finance official NYSE close and key statistics as of the November 17, 2026 cash session.
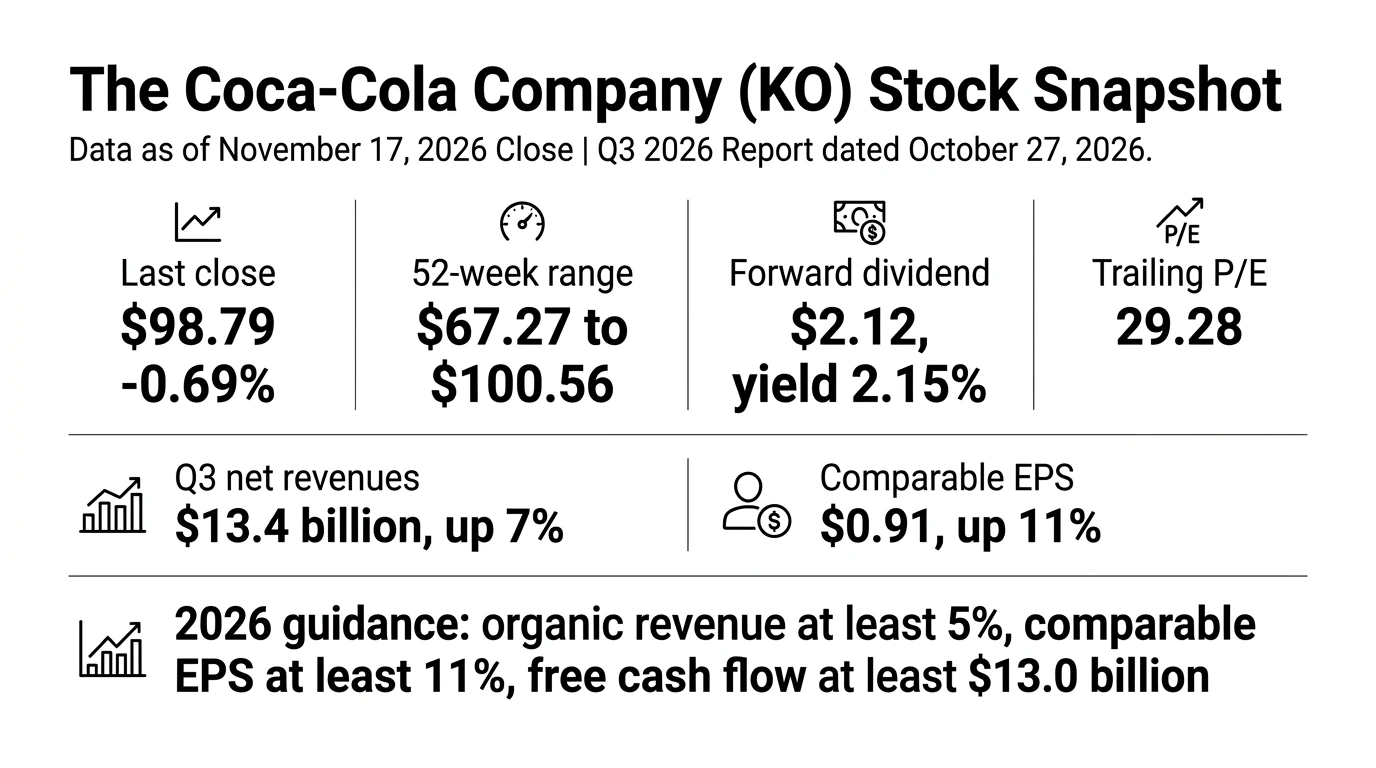
AI generated infographic of KO stock's official November 17, 2026 close, dividend yield, and raised 2026 guidance.
What Coca-Cola's third-quarter results actually showed
Coca-Cola reported third-quarter 2026 results on October 27, 2026, in an investor release covering the period ended October 2, 2026. Net revenues grew 7% to $13.4 billion. Organic revenues, a non-GAAP measure, also grew 7%.
That organic gain came from a 7% increase in concentrate sales and 1% price/mix. Currency added about 1 point to reported revenue, while acquisitions and divestitures subtracted about 1 point. Concentrate sales ran 2 points ahead of unit case volume because of shipment timing.
Unit case volume rose 5%. Operating income grew 12%, and comparable currency-neutral operating income rose 8%. Reported operating margin widened to 33.4% from 32.0%, and comparable operating margin to 32.9% from 31.9%. The company said the comparable margin gain included currency tailwinds, offset in part by higher marketing investment and operating expenses.
GAAP earnings per share grew 8% to $0.93. Comparable EPS grew 11% to $0.91. Both figures included a 2-point currency tailwind. Year-to-date cash from operations was $12.5 billion, and year-to-date free cash flow was $11.4 billion.
CNBC reported that the $0.91 comparable EPS beat the LSEG consensus of $0.88, and that revenue of $13.4 billion beat the $12.92 billion estimate. Net income attributable to shareholders was $4.01 billion, or $0.93 a share, up from $3.70 billion, or $0.86, a year earlier.
The beat was real, but the more important move was the third straight raise of full-year guidance.
Management lifted 2026 organic-revenue growth to at least 5%, from about 5%. Comparable EPS growth was raised to at least 11%, from 9% to 10%, and that outlook still includes an approximately 3% currency tailwind and a 1% headwind from acquisitions and divestitures. Comparable currency-neutral EPS excluding acquisitions and divestitures was raised to at least 9% growth, from 7% to 8%.
Free cash flow guidance rose to at least $13.0 billion, from about $12.4 billion. That figure is built on at least $15.2 billion of operating cash flow and about $2.2 billion of capital expenditures. The underlying effective tax-rate assumption was trimmed to 19.7% from 19.9%.
Regional volume versus price/mix
The global 5% volume increase was not evenly distributed. Latin America and Asia Pacific each grew unit cases 6%. Europe, Middle East & Africa grew 5%. North America was even. Bottling Investments volume rose 8%.
Latin America was the standout on the P&L. Reported net revenues there jumped 25%, with organic revenues up 16%, helped by 7% price/mix and a 9-point currency tailwind. North America grew reported and organic revenues only 3%, with 1% price/mix against flat volume.
Asia Pacific shows the other side of the mix. Volume grew 6%, but price/mix fell 2% and currency was a 3-point drag, so reported revenue rose just 4%. EMEA grew reported revenue 4% and organic revenue 7%, with volume up 5% and a 3-point drag from acquisitions and divestitures.
| Segment | Volume | Organic revenue | Reported revenue | Price/mix |
|---|---|---|---|---|
| Consolidated | 5% | 7% | 7% | 1% |
| Latin America | 6% | 16% | 25% | 7% |
| Asia Pacific | 6% | 6% | 4% | -2% |
| Europe, Middle East & Africa | 5% | 7% | 4% | 1% |
| North America | 0% | 3% | 3% | 1% |
| Bottling Investments | 8% | 12% | 13% | 3% |
Source: The Coca-Cola Company third-quarter 2026 earnings release, period ended October 2, 2026. Figures are year-over-year percent changes.
The category mix still looks healthy even with a muted U.S. volume print. Sparkling soft drinks grew 5%. Trademark Coca-Cola grew 5%, and Coca-Cola Zero Sugar grew 16% across all geographic segments. Water, sports, coffee, and tea grew 5%, with water up 8% and sports drinks down 3%. Juice, value-added dairy, and plant-based beverages were even.
CNBC noted that North America volume would have grown if not for Fourth of July timing, and that demand in the home market was otherwise lackluster. A concentrate business can still post organic growth with flattish developed-market cases, but only if emerging-market volume and pricing remain intact.
The dividend, payout, and cash-return case
On February 19, 2026, Coca-Cola's board approved the company's 64th consecutive annual dividend increase. The company release raised the quarterly rate about 4%, to $0.53 from $0.51, or $2.12 annualized versus $2.04 in 2025.
The same announcement said Coca-Cola returned $8.8 billion in dividends in 2025 and $101.9 billion since January 1, 2010. That history is the core of the KO income case: a high-margin concentrate model funding a rising cash payout for more than six decades.
The next installment is already on the calendar. Yahoo Finance, citing Morningstar data, lists a $0.53 cash dividend with an ex-dividend date of December 1, 2026, and a payment date of December 15, 2026. Earlier 2026 ex-dates were March 13, June 15, and September 15, each at $0.53.
At the November 17 close, the forward annual dividend of $2.12 implies a 2.15% yield. The trailing rate of $2.10 yields 2.11%. Both sit below Yahoo's 2.82% five-year average yield. The payout ratio is 61.95% of trailing earnings.
The dividend streak is intact, but the yield is no longer doing the valuation work. The stock's re-rating has compressed the income cushion.
Coverage is not the weak point. Yahoo Finance shows trailing twelve-month operating cash flow of $16.23 billion, and the company has already generated $11.4 billion of free cash flow through the first three quarters. Income-oriented holders, however, are being asked to accept a yield well below KO's own five-year average in exchange for the recent price appreciation.
How KO stock is valued versus history and PepsiCo
Yahoo Finance's current valuation snapshot, tied to the November 17 close, shows a market capitalization of $427.95 billion and an enterprise value of $452.17 billion. Trailing P/E is 29.28, forward P/E is 28.50, and the PEG ratio is 2.71. The stock also trades at 8.38 times trailing sales and 11.42 times book, with an EV/EBITDA of 23.28.
Those multiples have expanded with the price. In the same Yahoo table, the September 30, 2025 snapshot showed a trailing P/E of 23.52, a forward P/E of 20.60, and a price-to-sales ratio of 6.08. Investors are now paying a richer claim on a business whose trailing diluted EPS is $3.39 and whose trailing revenue is $51.05 billion.
The comparison with PepsiCo is stark. On the same official date, PEP closed at $142.02, down 3.01%. Its trailing P/E was 18.29 and its forward P/E was 16.97. PEP's forward dividend yield was 4.17%, and its 52-week change was -1.57%. KO has been the winner on price and the more expensive stock on almost every common multiple.
| Metric | KO | PEP |
|---|---|---|
| Official close, Nov 17, 2026 | $98.79 | $142.02 |
| Day change | -0.69% | -3.01% |
| Trailing P/E | 29.28 | 18.29 |
| Forward P/E | 28.50 | 16.97 |
| Forward dividend yield | 2.15% | 4.17% |
| 52-week change | 39.68% | -1.57% |
| Market capitalization | $427.95B | $199.55B |
| Trailing operating margin | 32.17% | 16.05% |
| 5-year beta | 0.27 | 0.32 |
Source: Yahoo Finance key statistics for KO and PEP, tied to official November 17, 2026 closes.
The quality gap is real. Coca-Cola is a capital-light brand-and-concentrate company; PepsiCo is a broader food-and-beverage manufacturer. KO's operating margin and lower beta help explain why a premium can persist. The issue is scale. A nearly 60% trailing-earnings premium, after a 40% 52-week advance, leaves a thinner expected return if growth merely meets the raised guide.
A 29 times earnings multiple on a mid-single-digit organic grower works only if the multiple holds. Any disappointment in volume, currency, or guidance would now cut through less margin of safety.
What would change the Coca-Cola thesis
The bull case is straightforward. Global unit cases are still growing, Coca-Cola Zero Sugar is running at 16% volume growth, and the company said it gained value share in total nonalcoholic ready-to-drink beverages. Management has now raised 2026 comparable EPS and free-cash-flow guidance again. Profitability remains high: trailing profit margin is 28.65%, and return on equity is 40.59%.
Institutional sponsorship is deep. Yahoo Finance's holders page shows 68.13% of shares held by institutions and 9.91% by insiders, with 4,730 institutions in the register. The September 30, 2026 snapshot lists Berkshire Hathaway at 400 million shares, or 9.30%, a stake worth about $39.5 billion at the November 17 close.
BlackRock held 323.93 million shares, or 7.53%. Vanguard Capital Management held 253.49 million, or 5.89%, and State Street held 168.52 million, or 3.92%. Investors tracking those 13F-style positions can review them alongside other large-cap staple filings in Tritonix AI's institutional smart-money tools.
Short interest is not a pressure point. Shares short fell to 47.24 million as of October 30, 2026, or 1.11% of float, from 53.16 million a month earlier. The short ratio was 2.8 days of average volume.
The first risk is North America. Volume was flat in the company's largest profit pool, and price/mix there was only 1%. If holiday timing fades as an explanation and U.S. cases slip, the quality-growth narrative gets narrower. Asia Pacific already showed the companion risk: 6% volume with negative 2% price/mix.
Currency is the second swing factor. The raised comparable EPS guide still embeds an approximately 3% tailwind. A reversal would not erase organic growth, but it would make the "at least 11%" bar harder to clear and would remove a support that has already been visible in the multiple.
A third issue is structure. The 2026 outlook assumes the pending sale of African bottling operations closes in the fourth quarter, subject to regulatory approvals. That deal is already reflected as about a 2% headwind to comparable net revenues and a 1% headwind to comparable EPS. The company said it will not give full-year 2027 guidance until it reports fourth-quarter earnings.
Calendar math will also distort the next print. Coca-Cola noted that fourth-quarter 2026 financial results will include six fewer days than the year-earlier quarter, even though unit-case volume is measured on average daily sales. Comparing reported revenue without that adjustment would overstate any apparent slowdown.
Input costs and marketing spend remain ordinary but material risks. Comparable margins expanded in the third quarter even as the company increased marketing investment. If media spend has to stay elevated to recruit consumers, or if North American input costs rebound, the operating-leverage story flattens.
The thesis breaks if North America volume deteriorates, if the currency tailwind fades, or if investors decide a 29 times earnings staple should de-rate once the guidance raises are fully in the price.
None of those risks makes The Coca-Cola Company a weak franchise. They do change the setup at $98.79. The system is executing, raising its guide, and still compounding a 64-year dividend. The stock, however, is asking investors to pay up for that quality after a sharp re-rating. At this close, the burden of proof has shifted from whether the system can grow to whether the multiple can keep expanding from here.
FAQ
What is KO stock, and what was its last official close?
KO is the NYSE ticker for The Coca-Cola Company. On Tuesday, November 17, 2026, KO printed an official cash close of $98.79, down $0.69, or 0.69%, from $99.48, according to Yahoo Finance. The 52-week range is $67.27 to $100.56.
What is KO's dividend yield, and when is the next ex-dividend date?
At the November 17, 2026 close, Yahoo Finance lists a forward annual dividend of $2.12, or a 2.15% yield, and a trailing dividend of $2.10, or 2.11%. The next $0.53 quarterly dividend has an ex-date of December 1, 2026, and a payment date of December 15, 2026. On February 19, 2026, Coca-Cola announced its 64th consecutive annual dividend increase, raising the quarterly rate to $0.53 from $0.51.
How did Coca-Cola perform in the third quarter of 2026?
In results released October 27, 2026, Coca-Cola reported net revenues of $13.4 billion, up 7%, and organic revenues also up 7%. Unit case volume grew 5%. GAAP EPS rose 8% to $0.93, and comparable EPS rose 11% to $0.91. The company raised 2026 guidance to at least 5% organic revenue growth, at least 11% comparable EPS growth, and at least $13.0 billion of free cash flow.
Is KO stock expensive compared with PepsiCo?
On the same official date, Yahoo Finance showed KO at a trailing P/E of 29.28 and a forward P/E of 28.50, versus 18.29 and 16.97 for PepsiCo, which closed at $142.02. KO's forward dividend yield was 2.15%, compared with 4.17% for PEP. KO's 52-week change was 39.68%, while PEP's was -1.57%. The premium can be justified by KO's higher margins, but it leaves less room for error after the rally.
Who are the largest institutional holders of KO stock?
As of the September 30, 2026 snapshot on Yahoo Finance, Berkshire Hathaway held 400 million shares, or 9.30%. BlackRock held 323.93 million shares (7.53%), Vanguard Capital Management held 253.49 million (5.89%), and State Street held 168.52 million (3.92%). Institutions held 68.13% of shares, and insiders held 9.91%.