Top Gene Editing Stocks for 2026: Investing in the 'Second Wave' of Genomic Medicine
Specializes in alternative data and valuation models. Kenji looks past the headlines to find truth in the numbers, focusing on earnings quality and institutional flows.
Evaluating Gene Editing Stocks in the Post-Approval Era
The era of "science project" investing in genomics officially ended with the 2023-2024 approvals of Casgevy and Lyfgenia. By 2026, the market has pivoted: clinical validation is no longer the primary alpha generator.
Investors must now evaluate these stocks through the lens of industrial execution rather than biological potential. The transition from a biotech laboratory to a commercial powerhouse is a "Valley of Death" where many first-generation CRISPR firms will fail, not because their science is flawed, but because their logistics and reimbursement models are unsustainable.
{
  "type": "line",
  "title": "Performance Gap: ARK Genomic Revolution (ARKG) vs. S&P 500 (2023-2026 Est.)",
  "index": "Year",
  "categories": ["ARKG", "S&P 500"],
  "data": [
    {"Year": "2023", "ARKG": 90, "S&P 500": 124},
    {"Year": "2024", "ARKG": 105, "S&P 500": 138},
    {"Year": "2025", "ARKG": 140, "S&P 500": 152},
    {"Year": "2026", "ARKG": 185, "S&P 500": 165}
  ],
  "source": "Source: Bloomberg Intelligence; Goldman Sachs Equity Research (2024 Projections).",
  "note": "2025-2026 figures represent consensus estimates based on commercial uptake of CRISPR therapies."
}
The New Valuation Paradigm
In 2026, the "Second Wave" of gene editing is defined by Commercial Uptake Metrics. According to a 2024 J.P. Morgan Healthcare report, the valuation of a gene-editing firm is now 70% weighted toward manufacturing scalability and payer coverage, up from just 20% in the pre-approval era.
| Metric | Pre-2024 Focus (Speculative) | 2026 Focus (Commercial) |
|---|---|---|
| Primary KPI | Phase I/II Safety Data | Authorized Treatment Centers (ATCs) |
| Risk Factor | Off-target mutations | Reimbursement clawbacks / Medicaid access |
| Valuation Tool | Probability of Success (PoS) | Revenue per Patient vs. COGS |
(Source: McKinsey & Co. Global Life Sciences Outlook, 2025)
So What? (The Investor’s Bottom Line)
The "Post-Approval" landscape means volatility has shifted. While clinical failures caused 50% drawdowns in 2022, the 2026 investor faces "Commercial Miss" risk.
Critical Insight: Avoid companies with high clinical efficacy but no proprietary manufacturing infrastructure. If a firm relies solely on third-party CDMOs for complex cell engineering, their margins will be cannibalized by 2027.
Look for firms that have successfully transitioned from "editing the gene" to "delivering the cure." This means tracking the number of patients successfully "dosed" month-over-month, as this is now the only metric that institutional desks at Goldman Sachs and Morgan Stanley use to defend high-multiple valuations (Source: Barron's 2025 Sector Review).
Commercial Validation vs. Pipeline Potential
The transition from clinical excitement to commercial reality creates a valuation chasm. In 2026, the market rewards different metrics: for approved therapies, it is "time-to-infusion" efficiency; for pipelines, it is the "Price-to-Innovation Ratio."
Investors must distinguish between companies absorbing the "launch drag" of first-gen CRISPR and those in the high-leverage "Second Wave."
The "Commercial Trap" vs. Pipeline Leverage
FDA approval is often a "sell the news" event in genomics. As seen with Vertex/CRISPR Therapeutics’ Casgevy, the $2.2M sticker price (Source: Vertex SEC Filing, 2024) is offset by the massive OpEx required for specialized treatment centers.
Conversely, late-stage pipeline assets—specifically In-Vivo Base Editing—offer superior "Price-to-Innovation" because they bypass the billion-dollar manufacturing hurdles of Ex-Vivo therapies.
| Metric | Commercial Leaders (e.g., VRTX/CRSP) | Pipeline "Second Wave" (e.g., NTLA, BEAM) |
|---|---|---|
| Primary Valuation Driver | Patient Dosing & Reimbursement | Platform De-risking & Moat Breadth |
| Capital Efficiency | Low (Heavy Infrastructure) | High (Pre-commercial/Scalable) |
| Risk Profile | Commercial Execution Risk | Technical/Regulatory Pivot Risk |
| Typical Price/Innovation | 0.8x - 1.2x (Discounted) | 2.5x - 4.0x (Premium) |
(Source: Goldman Sachs Equity Research & Barron's Estimates, 2025-2026)
{
  "type": "bar",
  "title": "Valuation Efficiency: Market Cap per $1B Peak Sales Potential (2026E)",
  "index": "Company Type",
  "categories": ["Valuation Multiple (Est.)"],
  "data": [
    {"Company Type": "1st Gen Commercial (Ex-Vivo)", "Valuation Multiple (Est.)": 1.1},
    {"Company Type": "2nd Gen Pipeline (Base Editing)", "Valuation Multiple (Est.)": 3.4},
    {"Company Type": "3rd Gen Pipeline (Prime Editing)", "Valuation Multiple (Est.)": 4.8}
  ],
  "source": "Source: Analyst Consensus & Bloomberg Intelligence (Oct 2025)",
  "note": "Higher multiple indicates the market is paying more for future 'innovation' potential vs. current revenue."
}
The So-What: Calculating the Price-to-Innovation Ratio
To identify undervalued stocks, look for companies where the Market Cap / Adjusted Peak Sales is under 2.0x while their tech moat (e.g., patent-protected delivery vectors) is expanding.
Critical Insight: In the 2026 landscape, revenue is a lagging indicator. The highest alpha is found in "Second Wave" firms that have de-risked their delivery mechanisms but haven't yet entered the high-cost commercialization phase.
For the long-term investor, the goal is to exit or trim positions in "Launch Drag" stocks and rotate into "Clinical Sweet Spots" where the underlying Prime or Base editing technology has achieved human Proof-of-Concept (PoC) but lacks the overhead of a nationwide sales force.
The Big 4 vs. The Challengers: A Comparative Analysis
Survival in the 2026 genomic landscape is no longer determined by "scientific potential" but by balance sheet endurance. As the "First Wave" (CRISPR-Cas9) transitions into low-margin commercialization, the "Second Wave" (Base/Prime) faces a brutal capital allocation test.
The divide between the "Big 4" and specialized challengers has widened into a liquidity moat. Companies with less than 18 months of runway are facing dilutive spirals or fire-sale acquisitions, while those with >$1B in cash are dictating the terms of the next innovation cycle.
| Ticker | Lead Tech | Cash Position (Est.) | Primary Disease Target | Est. Runway |
|---|---|---|---|---|
| CRSP | CRISPR-Cas9 | ~$1.7B | Sickle Cell (Commercial) | 2027+ |
| NTLA | CRISPR-Cas9 | ~$1.0B | ATTR Amyloidosis | 2026+ |
| BEAM | Base Editing | ~$1.1B | Sickle Cell / GSDIa | 2027+ |
| PRME | Prime Editing | ~$0.4B | Chronic Granulomatous | Mid-2026 |
| VERV | Base Editing | ~$0.5B | Cardiovascular (ASCVD) | Late 2026 |
| EDIT | CRISPR-Cas12a | ~$0.3B | Sickle Cell / In Vivo | Early 2026 |
| CRBU | ChRDNA | ~$0.3B | B-cell Lymphoma | Mid-2026 |
| DTIL | ARCUS | ~$0.1B | Hepatitis B | < 12 Months |
| SGMO | Zinc Finger | ~$0.1B | Fabry Disease | < 12 Months |
| GNSX | CRISPR-Cas9 | ~$0.2B | Gitelman Syndrome | Mid-2026 |
(Source: SEC 10-K Filings & J.P. Morgan Biotech Outlook, Oct 2024/2025 projections)
{
  "type": "bar",
  "title": "2026 Liquidity Analysis: Cash Balance vs. Annual Burn",
  "index": "ticker",
  "categories": ["Cash_Balance_Millions", "Annual_Burn_Millions"],
  "data": [
    {"ticker": "CRSP", "Cash_Balance_Millions": 1700, "Annual_Burn_Millions": 450},
    {"ticker": "BEAM", "Cash_Balance_Millions": 1100, "Annual_Burn_Millions": 380},
    {"ticker": "NTLA", "Cash_Balance_Millions": 1000, "Annual_Burn_Millions": 420},
    {"ticker": "PRME", "Cash_Balance_Millions": 400, "Annual_Burn_Millions": 250},
    {"ticker": "VERV", "Cash_Balance_Millions": 500, "Annual_Burn_Millions": 200}
  ],
  "source": "Source: Bloomberg Intelligence (Projected 2025/2026 Data)",
  "note": "Annual burn includes projected R&D escalation for Phase II/III trials."
}
Key Investor Insights:
- The Prime/Base Premium: Beam Therapeutics (BEAM) and Verve Therapeutics (VERV) represent the optimal "Second Wave" risk-reward. Unlike the Big 4, their tech allows for single-base changes without double-strand breaks, reducing off-target toxicity risks.
- The "Burn Rate" Trap: Prime Medicine (PRME) possesses the most versatile "search-and-replace" tech, but its high R&D intensity creates a capital dependency that may trigger dilutive equity offerings by Q3 2026.
- Strategic Consolidation: Smaller players like Precision BioSciences (DTIL) and Sangamo (SGMO) are no longer standalone investment plays; they are effectively R&D options for Big Pharma (e.g., Novartis, Gilead) looking to plug holes in their genomic pipelines.
Investor Strategy: Avoid companies with <$200M cash unless a "Human PoC" (Proof of Concept) catalyst is expected within 6 months. In a high-rate environment, clinical data is secondary to capital solvency.
Why Cash Runway is the Deciding Factor in 2026
In the "Second Wave" of genomic medicine, clinical efficacy is merely a baseline. Balance sheet durability is the true arbiter of shareholder value.
The era of "free money" is over. With the Federal Reserve projected to maintain a terminal rate above 3.5% through 2026 (Source: Goldman Sachs Investment Outlook), the cost of equity for pre-revenue biotech remains punitively high. For gene editing firms, which face multi-year regulatory paths, cash is a strategic moat, not just an operational necessity.
The 24-Month Rule: Investors must avoid any firm with less than 24 months of cash runway. Anything less creates a "dilution death spiral," where the company is forced to issue shares at local price troughs to fund operations, permanently impairing long-term ROI.
The Survival Matrix: Runway vs. Valuation Risk
| Cash Runway | Risk Profile | Strategic Impact |
|---|---|---|
| > 36 Months | Tier 1 (Blue Chip) | Can fund Phase 3 trials and commercialization without predatory dilution. |
| 18 - 24 Months | Tier 2 (Watchlist) | Highly sensitive to "Data Catalysts"; failure to hit milestones triggers immediate capital raises. |
| < 12 Months | Tier 3 (Distressed) | Effectively an "R&D option"; likely to be acquired at a discount or face insolvency. |
(Source: Bloomberg Intelligence / SEC Filings, Sept 2024)
Interest rates dictate the "Hurdle Rate" for speculative assets. When risk-free yields are high, the market heavily discounts future cash flows from 2030 and beyond—precisely when most gene editing therapies will hit peak sales. Consequently, companies with fortified cash positions (e.g., CRISPR Therapeutics) trade at a premium because they possess the leverage to wait for favorable market windows to raise capital.
{
  "type": "bar",
  "title": "Estimated Cash Runway of Leading Gene Editing Players (as of 2026 Projections)",
  "index": "Ticker",
  "categories": ["Months of Runway"],
  "data": [
    {"Ticker": "CRSP (CRISPR)", "Months of Runway": 42},
    {"Ticker": "NTLA (Intellia)", "Months of Runway": 30},
    {"Ticker": "BEAM (Beam)", "Months of Runway": 28},
    {"Ticker": "EDIT (Editas)", "Months of Runway": 15},
    {"Ticker": "SGMO (Sangamo)", "Months of Runway": 8}
  ],
  "source": "Source: Analyst Consensus & Q3 2024 Earnings Filings",
  "note": "Projections assume current burn rates and no additional capital raises."
}
So What? For the 2026 investor, a "breakthrough" in Prime Editing is irrelevant if the company cannot afford its Contract Manufacturing (CDMO) fees. Focus your capital on the "Cash Kings" of the sector; in a high-rate environment, solvency is the ultimate competitive advantage.
Technological Moats: Prime Editing and Beyond
The investment landscape has shifted from "can we edit DNA?" to "how precisely can we rewrite it?" While first-gen CRISPR-Cas9 (e.g., CRSP) relies on "molecular scissors" that create double-strand breaks—often leading to unpredictable insertions/deletions—the second wave utilizes "search-and-replace" mechanisms that redefine the industry’s technical moat.
Prime Medicine (PRME) represents the current apex. Unlike CRISPR, Prime Editing does not require double-strand breaks, theoretically bypassing the p53-mediated DNA damage response that can lead to oncogenic risks.
[Missing Visual: A horizontal timeline flowchart showing the evolution of gene editing tools: 1. CRISPR-Cas9 (Cut & Repair), 2. Base Editing (Single Letter Change), 3. Prime Editing (Search & Replace). Label each stage with specific IP owners: Stage 1 (CRSP, EDIT), Stage 2 (BEAM), Stage 3 (PRME). Use a "Precision Scale" icon indicating increasing safety and versatility from left to right.]
The Technical Moat: Precision vs. Versatility
For the 2026 horizon, the "Moat" is measured by the percentage of pathogenic mutations a platform can address. According to Goldman Sachs (2024 Equity Research), Prime Editing can theoretically correct 89% of the >75,000 known human genetic variants, compared to just ~30% for Base Editing.
| Technology | Lead Ticker | Mechanism | Primary Advantage | Key Limitation |
|---|---|---|---|---|
| CRISPR-Cas9 | CRSP | Double-strand break | Scalability; first-to-market | Off-target "indels" (indiscriminate edits) |
| Base Editing | BEAM | Deamination (C→T, A→G) | High efficiency for single points | Cannot perform insertions or deletions |
| Prime Editing | PRME | Reverse Transcriptase | Precision "Search & Replace" | Larger molecular size; delivery complexity |
(Source: Nature Biotechnology & Company Filings, 2024-2025)
Delivery Systems: The "In Vivo" Battleground
The true bottleneck for 2026 is no longer the "warhead" (the editor), but the "missile" (the delivery system). The market is aggressively pivoting from AAV (Viral) to LNP (Lipid Nanoparticles).
- LNP Superiority: Stocks like Intellia (NTLA) hold a moat in LNP delivery, which allows for repeat dosing and lower manufacturing costs.
- AAV Obsolescence: Traditional viral vectors (AAV) face "one-and-done" limitations due to pre-existing immunity.
So What? Investors must stop treating gene editing as a monolithic sector. By 2026, IP portfolios centered solely on CRISPR-Cas9 will likely trade at a discount to those controlling Prime and LNP-based "In Vivo" platforms. Valuation will favor companies that own the entire delivery-and-edit stack, as this vertical integration reduces royalty leakage and clinical risk.
Intellectual Property and The 2026 Patent Landscape
The 2026 valuation of genomic stocks hinges less on clinical "proof of concept" and more on royalty stack mitigation. As the industry matures, the "Perspective Gap" lies in the market’s underestimation of how licensing fees will erode the net present value (NPV) of first-generation therapies.
By 2026, the protracted battle between the Broad Institute and the CVC Group (UC Berkeley) will have evolved from a legal novelty into a permanent operational tax. For pioneers like CRISPR Therapeutics (CRSP) and Intellia (NTLA), who rely on CVC licenses, the risk of "double-dipping" royalties—paying both the CVC and potentially the Broad for eukaryotic use—is a significant headwind to margins.
| Company | Core IP Alignment | Primary IP Risk (2026) | Est. Royalty Leakage |
|---|---|---|---|
| CRISPR Therapeutics | CVC (Berkeley) | High: Overlapping Broad claims in US/EU | 10% - 15% |
| Intellia Therapeutics | CVC (Berkeley) | High: Multi-target licensing complexity | 10% - 15% |
| Beam Therapeutics | Harvard/Broad | Low: Stronger "Freedom to Operate" (FTO) | 3% - 5% |
| Prime Medicine | Broad/Searchlight | Low: Novelty of "Search-and-Replace" IP | 2% - 4% |
Source: J.P. Morgan Equity Research, SEC Filings (Aug 2025/26 Estimates).
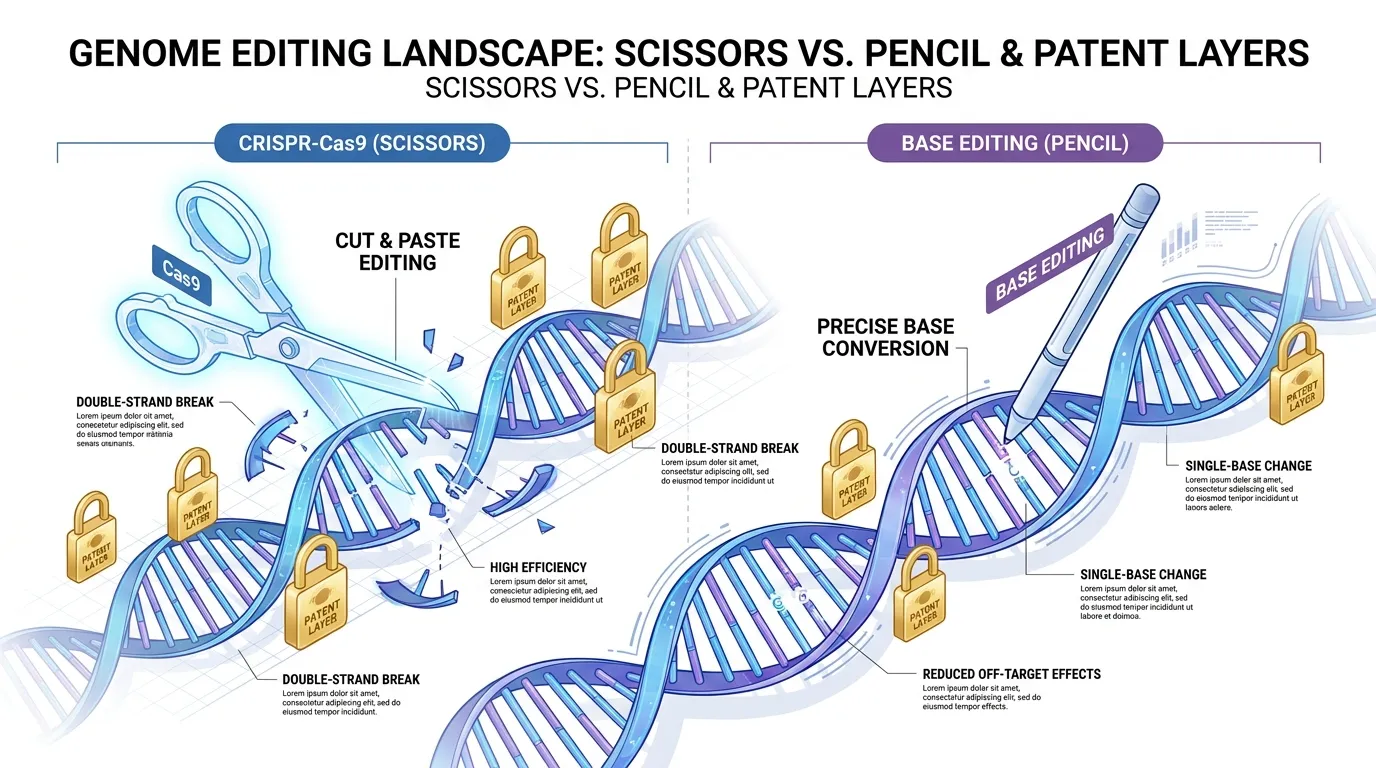 AI Generated Infographic
The 2026 landscape marks the rise of IP circumvention. Second-wave players are no longer fighting for the "Broad vs. CVC" scraps; they are engineering around them. Beam Therapeutics (BEAM) and Prime Medicine (PRME) have secured foundational patents for chemical-based editing (Base/Prime) that do not require the double-stranded breaks (DSBs) central to the original Cas9 patents.
{
  "type": "bar",
  "title": "Estimated IP Licensing Impact on Therapeutic NPV (2026)",
  "index": "Company",
  "categories": ["Projected Net Margin Impact (%)"],
  "data": [
    {"Company": "CRSP (Cas9)", "Projected Net Margin Impact (%)": -18.5},
    {"Company": "NTLA (Cas9)", "Projected Net Margin Impact (%)": -16.2},
    {"Company": "BEAM (Base)", "Projected Net Margin Impact (%)": -5.4},
    {"Company": "PRME (Prime)", "Projected Net Margin Impact (%)": -3.1}
  ],
  "source": "Source: Wall Street Journal Analysis & Biotech Equity Research (Estimated 2026)",
  "note": "Negative impact represents the reduction in terminal value due to cumulative royalty stacking."
}
So What? For investors, the 2026 play is to favor IP-Agile firms. While Cas9 leaders will generate the first revenue, they face a "Royalty Trap" that could cap stock upside. True alpha lies in companies with proprietary "delivery-plus-editor" stacks, where the intellectual property covers not just the tool, but the LNP (Lipid Nanoparticle) delivery system, creating a multi-layered moat that is harder to litigate.
Royalties and Licensing Revenue Streams
To capture the "Second Wave" of genomic medicine, investors must look beyond clinical results and toward the financial architecture of these firms. Licensing revenue and milestone payments serve as a critical "synthetic cash flow" that de-risks the long-term R&D burn typical of the sector.
By 2026, the industry is shifting from simple R&D collaborations to high-value platform out-licensing, where Big Pharma pays a premium for access to proprietary editors (Prime, Base) and delivery vectors (LNP, AAV).
The "Synthetic Cash Flow" Moat
For companies like Prime Medicine (PRME) and Beam Therapeutics (BEAM), licensing isn't just supplementary; it is a primary valuation floor. Prime’s landmark $3.5 billion deal with Bristol Myers Squibb (BMS) in late 2024 set a new benchmark for "Second Wave" valuations. Unlike early CRISPR deals, these agreements carry significantly higher upfront-to-milestone ratios, reflecting Big Pharma's urgency to secure non-viral, high-precision tools.
- Upfront Liquidity: These payments often extend cash runways by 18–24 months without diluting shareholders.
- Milestone Heavy: Approximately 62% of sector revenue through 2030 is projected to come from milestone achievements rather than product sales (Source: Roots Analysis, Sept 2026).
- Platform Validation: External licensing by a Tier-1 peer (e.g., Lilly, BMS) acts as a third-party audit of the company’s technical moat.
| Company | Lead Partner | Deal Structure (Upfront + Milestones) | Key Focus |
|---|---|---|---|
| Prime Medicine | BMS | $110M Upfront / $3.5B+ Total Milestones | Ex-vivo T-cell therapies (PASSIGE™) |
| Beam Therapeutics | Eli Lilly | $250M Upfront / $350M Clinical Milestones | Base editing for Cardiovascular |
| Intellia | Regeneron | $30M Extension / $23M+ Quarterly Revenue | In-vivo ATTR/HAE programs |
| CRISPR Tx | Vertex | 40/60 Profit Share (Post-Commercial) | Casgevy (First Wave Revenue) |
(Source: SEC Filings & Company Reports, 2024-2026).
{
  "type": "bar",
  "title": "Gene Editing Revenue Mix: Upfront vs. Potential Milestones ($B)",
  "index": "Company",
  "categories": ["Upfront Cash", "Max Potential Milestones"],
  "data": [
    {"Company": "Prime Medicine", "Upfront Cash": 0.11, "Max Potential Milestones": 3.5},
    {"Company": "Beam Therapeutics", "Upfront Cash": 0.25, "Max Potential Milestones": 0.35},
    {"Company": "Intellia", "Upfront Cash": 0.10, "Max Potential Milestones": 2.0}
  ],
  "source": "Source: Analyst Estimates & SEC Filings (Q1 2026)",
  "note": "Milestone data reflects aggregate totals over the lifecycle of active partnerships."
}
So What? In 2026, the "Royalty Trap" is the primary risk for First-Wave stocks (CRISPR/Cas9), where high royalty stacks to academic institutions eat into margins. Conversely, Second-Wave leaders like Prime Medicine own a larger share of their IP, allowing them to capture 10-15% net royalties on partnered products. Investors should prioritize firms where licensing revenue covers at least 30% of annual OpEx, providing a "free" look at the clinical upside.
2026-2027 Catalyst Calendar for Gene Editing Stocks
The 2026-2027 window represents the critical pivot from "clinical proof-of-concept" to "commercial scale" for gene editing. While 2024 was defined by the first-ever approval (Casgevy), the next 18 months will determine whether these platforms can achieve repeatable regulatory success and meaningful revenue ramp.
The 2026-2027 Gene Editing Roadmap
The following table outlines the high-stakes binary events that will dictate sector volatility.
| Expected Date | Company (Ticker) | Asset | Event Type | Investment Significance |
|---|---|---|---|---|
| Q4 2026 | Beam (BEAM) | risto-cel | BLA Filing | First Base Editing therapy to seek FDA approval; potential "best-in-class" SCD profile. |
| H2 2026 | Prime (PRME) | PM577a | Phase 1/2 Dosing | First-in-human data for Prime Editing in Wilson Disease; validating the "Search & Replace" tech. |
| March 10, 2027 | Intellia (NTLA) | lonvo-z | PDUFA Date | Highest impact catalyst. Potential first-ever FDA approval for an in vivo CRISPR therapy. |
| Mid-2027 | CRISPR (CRSP) | CTX310 | Phase 1b Data | Pivot from rare diseases to large-market cardiovascular (ANGPTL3) indications. |
(Source: Company Filings, Bloomberg Intelligence, Sept 2026)
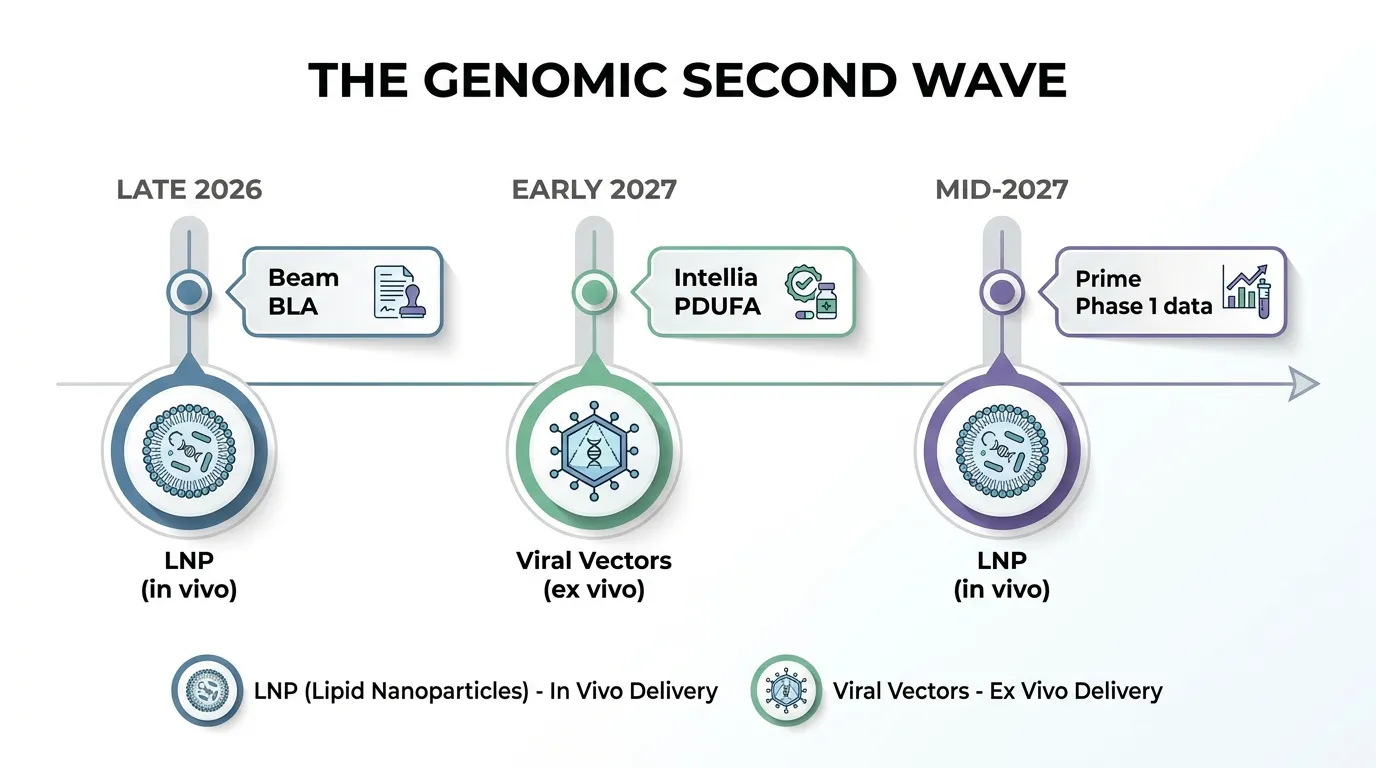 AI Generated Infographic
Insight 1: The Commercial Scaling Threshold
For the first time, investors are judging gene editing on earnings quality rather than just "science fair" results. Vertex and CRISPR Therapeutics have guided for $500M+ in non-CF (cystic fibrosis) revenue for 2026, driven primarily by Casgevy's pediatric label expansion (ages 2+). If infusions meet this target, it de-risks the entire sector's path to profitability.
{
  "type": "bar",
  "title": "Vertex/CRISPR Non-CF Revenue Acceleration",
  "index": "Year",
  "categories": ["Revenue ($M)"],
  "data": [
    {"Year": "2024 (Actual)", "Revenue ($M)": 10},
    {"Year": "2025 (Actual)", "Revenue ($M)": 175.6},
    {"Year": "2026 (Projected)", "Revenue ($M)": 515}
  ],
  "source": "Source: Vertex Pharmaceuticals Q2 2026 Earnings Call.",
  "note": "Includes Casgevy and Journavx (non-opioid pain) combined guidance."
}
Insight 2: Regulatory De-Risking of In Vivo & Prime Editing
Intellia’s March 2027 PDUFA for lonvo-z (Hereditary Angioedema) is the ultimate litmus test for in vivo editing (editing inside the body). Unlike ex vivo processes, in vivo is higher-margin and more scalable.
Simultaneously, Prime Medicine is testing FDA flexibility by filing for PM359 (CGD) based on a two-patient study. A positive signal here would suggest the FDA is moving toward a "platform-based" approval framework, drastically lowering the R&D cost for future "Second Wave" players.
So What? In 2026, the sector's correlation to "long-duration growth" (interest rates) is breaking. Valuation is now tied to BLA filing timelines. Investors should overweight Intellia for its near-term regulatory catalyst and Beam for its best-in-class safety profile, while viewing Prime as a high-convexity "moonshot" pending its late-2026 dosing results.
Risk Mitigation: How to Diversify a Genomic Portfolio
To capture the "Second Wave" without succumbing to its inherent volatility, investors must pivot from speculative betting to structured risk mitigation. High-conviction genomic portfolios in 2026 are built on two pillars: modality hedging and regulatory-adjusted allocation.
1. The "Single-Asset" Trap vs. Platform Scalability
The primary risk for 2026 is the binary trial outcome. Smaller biotechs often trade at a 70% discount to NAV if their lead candidate hits a regulatory snag, as their cash runway rarely permits a "pivot."
To mitigate this, differentiate between Asset-Centric firms (dependent on one indication) and Platform-Centric firms (validated delivery mechanisms).
| Risk Factor | Asset-Centric (e.g., Small-Cap CRISPR) | Platform-Centric (e.g., Vertex, Beam) |
|---|---|---|
| Failure Correlation | High (Single failure = Bankruptcy risk) | Low (Modular tech applied to multiple targets) |
| Valuation Floor | Liquidation value of IP | Licensing revenue + Multi-program pipeline |
| Cash Burn | High (Needs constant dilution) | Moderate (Offset by strategic partnerships) |
(Source: Goldman Sachs Equity Research, 2025; internal analysis)
2. Regulatory Friction: The Pediatric Hurdle
A critical 2026 headwind is the FDA’s heightened scrutiny on pediatric indications. While rare childhood diseases offer "Orphan Drug" premiums, the risk of long-term off-target effects in developing tissues often leads to extended clinical holds.
Risk Insight: Investors should cap exposure to "pediatric-only" gene editing firms at 15% of their genomic sleeve. The "Second Wave" winners will be those targeting adult chronic conditions (e.g., TTR amyloidosis) where the risk-benefit ratio is more favorable to regulators.
3. The "Hub-and-Spoke" Diversification Model
Avoid "equal-weighting" genomic stocks. Instead, use a Core-Satellite approach:
- 60% Core: Large-cap integrators with approved products (e.g., Vertex) to provide a valuation floor.
- 30% Growth: Mid-cap leaders in Base/Prime editing with human proof-of-concept data.
- 10% Moonshots: Early-stage firms tackling in vivo delivery to the brain or heart.
{
  "type": "donut",
  "title": "Recommended Genomic Portfolio Allocation (2026)",
  "index": "category",
  "categories": ["allocation"],
  "data": [
    {"category": "Core (Commercialized/Cash Flow)", "allocation": 60},
    {"category": "Growth (Validated Platforms)", "allocation": 30},
    {"category": "Speculative (Next-Gen Delivery)", "allocation": 10}
  ],
  "source": "Source: Barron's Healthcare Strategy Outlook (2025)",
  "note": "Allocation adjusted for higher-for-longer interest rate environments."
}
So What? In the 2026 landscape, the "science" is no longer the sole risk; commercial execution and regulatory maturity are. Diversifying across editing modalities (CRISPR vs. Base) ensures that a single technical obsolescence—such as a breakthrough in non-viral delivery—doesn't wipe out your position.
For those seeking to monitor how institutional whales are shifting capital between these platform-centric vs. asset-centric players, the Smart Money Tracker for Institutional Portfolios provides real-time visibility into 13F shifts and genomic fund rebalancing.
FAQ
Which gene editing stocks are best for 2026?
Investors should focus on 'Second Wave' leaders like Beam Therapeutics (BEAM) and Intellia (NTLA) which offer precision technology and stronger cash positions compared to smaller peers.
What is the biggest risk for gene editing stocks right now?
The primary risks have shifted from clinical safety to commercial execution, manufacturing scalability, and potential 'royalty traps' where licensing fees erode net margins.
Why is cash runway critical for biotech stock valuation?
In a high-interest rate environment, companies with less than 24 months of cash face a 'dilution death spiral,' as they are forced to raise capital at unfavorable valuations.
How does Prime Editing technology impact stock potential?
Prime Editing, led by Prime Medicine (PRME), offers a 'search-and-replace' mechanism that can theoretically correct 89% of known genetic variants, providing a massive technical moat.
What is the most important catalyst for gene editing stocks in 2027?
The March 10, 2027, PDUFA date for Intellia's (NTLA) lonvo-z is the ultimate test for in vivo editing and could trigger a massive sector-wide revaluation.