International Business Machines Stocks in 2026: Ticker, Valuation, and the Post-Selloff Case
Founder of Tritonix.ai. Former Hedge Fund Analyst with 10+ years of experience managing over $1B AUM across insurance portfolios and private funds. Specializes in institutional-grade fundamental analysis and long-term capital allocation.
What International Business Machines stocks represent in November 2026
When investors search for International Business Machines stocks, they are usually looking for a live read on the common shares of International Business Machines Corporation, not a museum tour of the old hardware franchise. The listed security is straightforward: one class of common stock, trading on the New York Stock Exchange under the ticker IBM, with headquarters in Armonk, New York, and a corporate history that runs back to the 1911 incorporation of the company’s predecessor.
StockAnalysis shows the shares closing at $244.73 on November 10, 2026, up $0.31, or 0.13%, on volume of about 2.97 million shares. That session’s range was $242.70 to $246.00. The same day was the ex-dividend date for IBM’s $1.69 quarterly cash dividend, which is why the unadjusted November 9 close of $246.11 and the November 10 close are not directly comparable without the dividend adjustment.
At that close, StockAnalysis put IBM’s market capitalization at about $231.3 billion, with 945.12 million shares outstanding and a float of 943.18 million. Trailing twelve-month revenue was $69.87 billion, net income was $11.17 billion, and earnings per share were $11.72. Those figures frame a large-cap technology-services name that still behaves like a cash-returning industrial franchise as much as it behaves like an AI software story.
International Business Machines stocks are a single NYSE-listed common share class, and the November 10, 2026 close of $244.73 already reflected the stock going ex-dividend.
Ownership is institutionally heavy. StockAnalysis reports that institutions own 66.72% of the shares, insiders own 0.09%, and short interest is about 19.91 million shares, or 2.11% of the share count, equal to 3.52 days of average trading volume. That is not a crowded short, but it is also not a retail-dominated tape. Investors who want to see how large funds are actually positioned in names like IBM can cross-check holdings through Tritonix’s institutional smart money tools rather than inferring sponsorship from the share count alone.
The 52-week range still dominates any discussion of the stock. CNBC and the Financial Times place the 52-week high at $332.46 on June 2, 2026, and the 52-week low at $199.19 on July 23, 2026. At the November 10 close, IBM was roughly 26% below that high and about 23% above the July low. StockAnalysis also shows a 52-week price change of -20.12% and a five-year beta of 0.77.
How the July 2026 selloff still shapes the share price
The reason International Business Machines stocks trade so far below their early-summer peak is not only the third quarter. On July 14, 2026, IBM published preliminary second-quarter results and a letter from chairman and chief executive Arvind Krishna. CNBC reported that the shares plunged 25%, the worst session in records going back to 1968 and steeper than the 23.7% drop on October 19, 1987.
The miss was about timing more than franchise decay. CNBC, citing FactSet, said IBM reported adjusted earnings of $2.93 a share on revenue of $17.2 billion, below estimates of $3.01 and $17.86 billion. In his letter to investors, Krishna said revenue was up 1%, with software up 5%, consulting flat, and infrastructure down 7%. He wrote that clients, late in June, shifted capital spending toward servers, storage, and memory to secure supply-constrained infrastructure, hitting IBM Z and Transaction Processing. The company, he said, “faltered,” did not adapt quickly enough, and watched “numerous large deals” slip.
The July 14, 2026 drop reset the valuation of International Business Machines stocks; the later third-quarter beat has not fully unwound that reset.
The tape since then has been a recovery with a ceiling. IBM shares worked back through the low $200s after the July 23 low, then jumped to a close of $251.46 on October 21, 2026, the day of the third-quarter report, according to StockAnalysis price history. They reached $258.28 on October 29 and printed an intraday high of $259.87 on November 2, before fading back to the mid-$240s. That path is consistent with a market that was willing to reward a cleaner quarter, but not willing to re-rate the stock as if the July shock had never happened.
{
  "type": "line",
  "title": "IBM Closing Price After the Mid-2026 Reset",
  "index": "Date",
  "categories": ["Close"],
  "data": [
    {"Date": "2026-09-30", "Close": 219.93},
    {"Date": "2026-10-08", "Close": 226.61},
    {"Date": "2026-10-15", "Close": 234.12},
    {"Date": "2026-10-21", "Close": 251.46},
    {"Date": "2026-10-29", "Close": 258.28},
    {"Date": "2026-11-02", "Close": 252.51},
    {"Date": "2026-11-06", "Close": 245.00},
    {"Date": "2026-11-09", "Close": 246.11},
    {"Date": "2026-11-10", "Close": 244.73}
  ],
  "source": "StockAnalysis / S&P Global Market Intelligence, unadjusted session closes through November 10, 2026",
  "note": "October 21 is the third-quarter earnings date. November 10 is also the ex-dividend date for the $1.69 quarterly dividend."
}
The software-led mix behind International Business Machines stocks
The investment case for International Business Machines stocks is now a mix argument. IBM is priced as a software-led hybrid-cloud and enterprise-AI platform, with a still-large consulting arm and a cyclical infrastructure franchise built around IBM Z and distributed systems.
IBM’s October 21, 2026 earnings release still anchors the fundamentals. For the quarter ended September 30, 2026, revenue was $17.103 billion, up 4.7% as reported and 5.6% in constant currency from $16.331 billion a year earlier. Gross profit was $9.714 billion, and the GAAP gross margin was 56.8%, down 50 basis points. GAAP income from continuing operations was $2.199 billion, or $2.31 a diluted share, while operating (non-GAAP) earnings were $2.95 a share. Reuters, citing LSEG, said that beat estimates of $16.82 billion and $2.86. The beat was real; the decision to keep full-year constant-currency revenue growth at 4% to 5% is why the multiple did not expand more.
The segment table shows where the growth, and the profit, actually sit.
| Segment | Q3 2026 revenue | Reported YoY | Constant currency | Segment profit margin |
|---|---|---|---|---|
| Software | $7.804B | 8.2% | 8.7% | 35.0% |
| Consulting | $5.335B | 0.2% | 1.8% | 12.2% |
| Infrastructure | $3.707B | 4.2% | 4.9% | 19.3% |
| Financing | $0.192B | -3.9% | -3.3% | 56.1% |
| Total revenue | $17.103B | 4.7% | 5.6% | — |
Source: IBM third-quarter 2026 results. Total revenue includes $66 million of “Other.”
Software is the engine. It contributed about 46% of quarterly revenue and a 35.0% segment margin, far above consulting’s 12.2%. Inside software, Hybrid Cloud (Red Hat) rose 11%, Data rose 19% (20% in constant currency), and Transaction Processing rose 9% (10% in constant currency) after the second-quarter stumble. Automation was the soft spot, down 3%.
In the third-quarter earnings discussion, management raised its full-year software growth outlook to about 7% to 8%, with roughly 7% as the revised base case. That is the number investors in International Business Machines stocks should underwrite, or reject, because software is what supports both the margin structure and the cash available for dividends.
{
  "type": "donut",
  "title": "IBM Third-Quarter 2026 Revenue Mix",
  "index": "Segment",
  "categories": ["Revenue ($ billions)"],
  "data": [
    {"Segment": "Software", "Revenue ($ billions)": 7.804},
    {"Segment": "Consulting", "Revenue ($ billions)": 5.335},
    {"Segment": "Infrastructure", "Revenue ($ billions)": 3.707},
    {"Segment": "Financing", "Revenue ($ billions)": 0.192},
    {"Segment": "Other", "Revenue ($ billions)": 0.066}
  ],
  "source": "IBM third-quarter 2026 earnings release, quarter ended September 30, 2026",
  "note": "Figures are reported revenue in billions of dollars. Software was about 46% of the $17.103 billion total."
}
Infrastructure looks healthier than the July letter implied, but the mix is uneven. Hybrid Infrastructure rose 8%, yet IBM Z fell 20% (19% in constant currency) as the company laps the z17 launch, while Distributed Infrastructure jumped 31% (32% in constant currency). Consulting, at $5.335 billion, was essentially flat and remains the drag on the growth rate. A software-led rerating of International Business Machines stocks requires consulting to stop being a dead weight, even if it never becomes the high-margin segment.
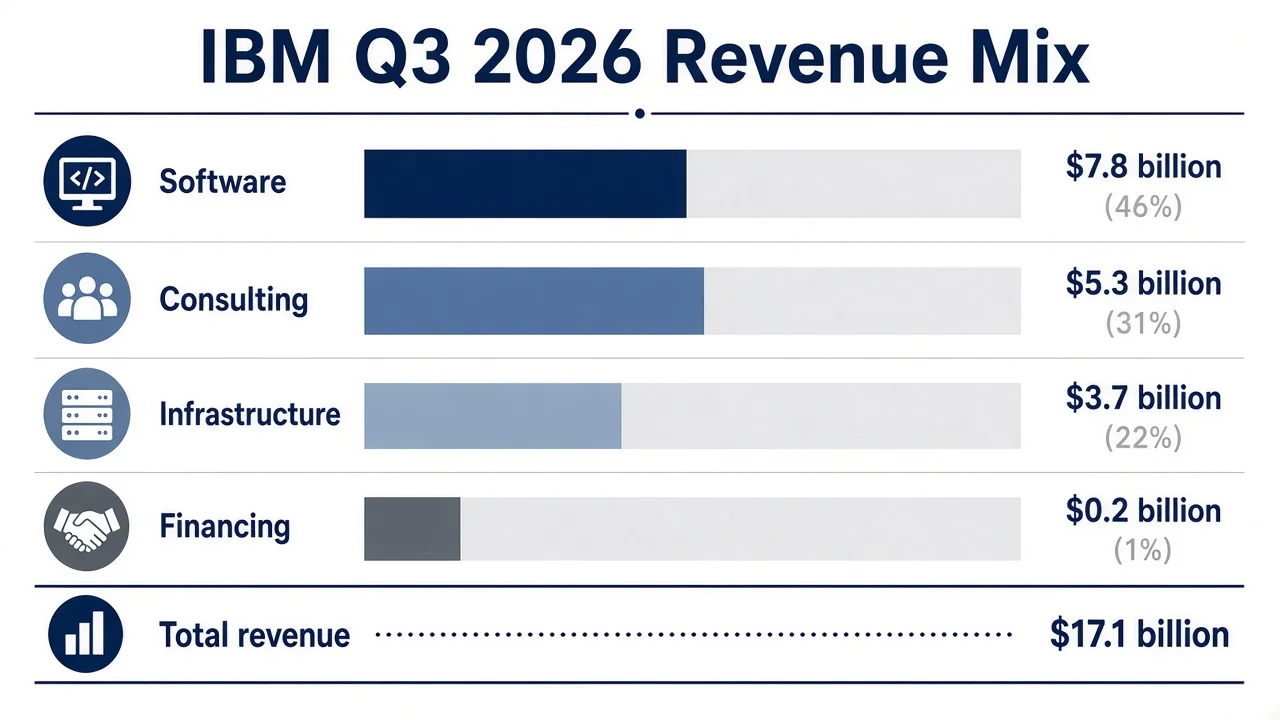 AI generated infographic of IBM's third-quarter 2026 revenue mix across Software, Consulting, Infrastructure, and Financing.
Cash, debt, and the dividend that supports the stock
International Business Machines stocks have long been held as much for the dividend as for earnings growth, and the cash statement still supports that habit, with caveats. In the third quarter, IBM generated $4.025 billion of operating cash flow and $3.027 billion of free cash flow, up $0.7 billion year over year. It returned $1.596 billion to shareholders in dividends. For the first nine months, operating cash flow was $11.791 billion and free cash flow was $7.787 billion, up $0.6 billion from a year earlier, while dividends totaled $4.762 billion.
The board approved a regular quarterly cash dividend of $1.69 a share, payable December 10, 2026, to stockholders of record on November 10, 2026. With that payment, IBM will have paid consecutive quarterly dividends every year since 1916. IBM’s dividend history shows the quarterly rate stepping from $1.68 in March 2026 to $1.69 for the June, September, and December payments, or $6.76 annualized.
At the November 10 close of $244.73, that dividend equates to a yield of 2.76%. StockAnalysis lists a trailing payout ratio of 57.66% of earnings and 43.59% of free cash flow, along with 30 years of dividend growth and dividend growth of only 0.60% year over year. This is a reliable, slowly rising coupon, not a high-growth income story.
The dividend on International Business Machines stocks is well covered by free cash flow, but the annual increase is modest and the balance sheet is doing more work than the yield alone suggests.
The balance sheet is the other half of the equity story. IBM ended the third quarter with $11.1 billion of cash, restricted cash, and marketable securities, down $3.4 billion from year-end 2025. Debt, including $12.7 billion of IBM Financing debt, totaled $63.8 billion, up $2.6 billion year to date. The company invested $11.4 billion in acquisitions this year, and goodwill rose to $74.916 billion from $67.717 billion at year-end 2025. Stockholders’ equity was $35.537 billion, or a book value of about $37.60 a share on the 945.12 million shares outstanding.
A current ratio of 0.85 looks tight until the liability mix is unpacked. Current deferred income alone was $15.164 billion at September 30, 2026, a prepaid software-and-services obligation rather than unpaid suppliers. Leverage is still real, but the headline ratio overstates operational strain. Investors should also be careful with the GAAP earnings jump: diluted continuing-operations earnings rose 26% to $2.31, but the effective tax rate fell to 11.9% from 28.2%. Operating (non-GAAP) earnings, up 11% to $2.95, are the cleaner run-rate.
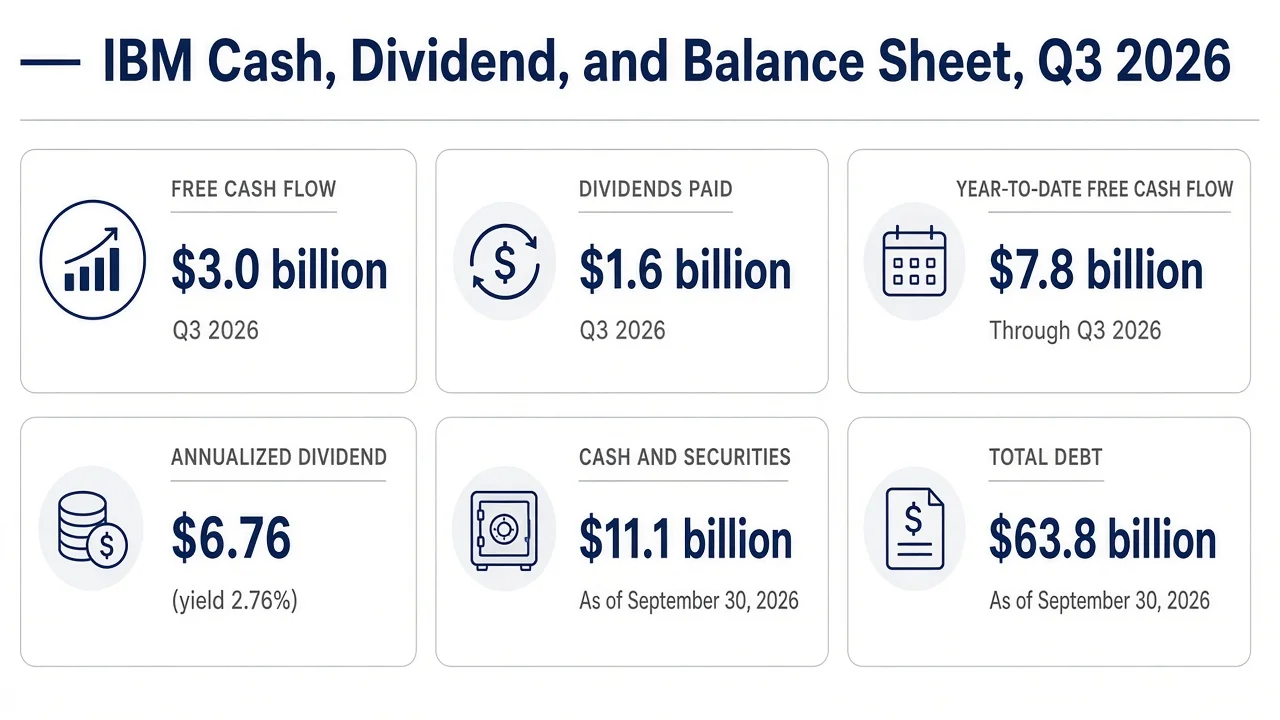 AI generated infographic of IBM's third-quarter cash generation, dividend, and year-to-date acquisition spending.
| Cash and capital item | Amount | Period |
|---|---|---|
| Free cash flow | $3.027B | Q3 2026 |
| Dividends paid | $1.596B | Q3 2026 |
| Free cash flow | $7.787B | First nine months of 2026 |
| Dividends paid | $4.762B | First nine months of 2026 |
| Acquisitions, net of cash | $11.364B | First nine months of 2026 |
| Cash, restricted cash, and marketable securities | $11.1B | Sept. 30, 2026 |
| Total debt, including Financing debt | $63.8B | Sept. 30, 2026 |
Source: IBM third-quarter 2026 results.
Management now expects full-year free cash flow to increase by more than $1 billion year over year, while keeping constant-currency revenue growth in a 4% to 5% range, with currency expected to be neutral. That is a cash-first guide. If IBM delivers it, the dividend remains comfortable. If acquisition integration or another software-deal slip absorbs the incremental cash, the payout is still covered, but the valuation argument gets thinner.
Valuation: what investors are paying after the reset
The practical question for buyers of International Business Machines stocks is whether $244.73 is a repaired price or a value trap beneath a shattered high. On StockAnalysis figures tied to that area of the tape, the shares traded at a trailing price-to-earnings ratio of about 20.9, a forward price-to-earnings ratio of about 18.7, a price-to-sales ratio of 3.31, a price-to-book ratio of 6.50, and a price-to-free-cash-flow ratio of 15.77. Enterprise value was about $287.2 billion, or roughly 17.3 times EBITDA and 19.6 times free cash flow.
| Valuation measure | Figure | Context |
|---|---|---|
| Share price (Nov. 10, 2026 close) | $244.73 | Ex-dividend session |
| Market capitalization | $231.3B | 945.12 million shares |
| Trailing P/E | 20.9 | On $11.72 TTM EPS |
| Forward P/E | 18.7 | StockAnalysis |
| Price-to-book | 6.50 | Book value $37.60 |
| Dividend yield | 2.76% | $6.76 annualized |
| Average analyst target | $259.30 | 25 analysts, Buy |
Source: StockAnalysis IBM statistics and IBM price history, as of the November 10, 2026 close.
Those multiples are not crisis valuations. A 20.9 times earnings multiple on a company guiding to 4% to 5% constant-currency revenue growth, with a PEG ratio of 2.87, is the multiple of a quality compounder, not of a broken stock. The $259.30 average target from 25 analysts, a consensus Buy, implied only about 6% upside from the November 10 close. The market is offering a modest rerate if software growth holds, and almost none if it does not.
At about 21 times trailing earnings and 6% implied upside to the average target, International Business Machines stocks are priced for a durable software recovery, not for a return to the June high.
A structured pass on earnings quality, cash conversion, and peer multiples is easier when filings, quotes, and holdership sit in one AI investment research workflow instead of being assembled from scattered terminals. The work still has to answer a single question: is the July shock a one-quarter execution miss, or evidence that AI infrastructure spending can keep crowding out IBM’s software and mainframe pipeline?
The bull case is already visible in the third-quarter mix. Software accelerated, Transaction Processing rebounded, Data grew 19%, distributed infrastructure was very strong, free cash flow rose, and management had enough confidence to lift the software outlook. The bear case is also visible: consulting is stagnant, Automation declined, IBM Z is in a down year, goodwill and debt rose with $11.4 billion of acquisitions, and the stock has already given back the post-earnings bounce from the high $250s.
The risks that would change the thesis
The first risk is another slide in software deal timing. Krishna’s July letter made clear that a handful of large transactions, and a late-quarter shift into hardware capex, can move an otherwise solid quarter. If Transaction Processing or Hybrid Cloud fades again, the raised 7% to 8% software outlook will look like catch-up rather than a new run rate, and International Business Machines stocks could revisit the lower half of their 52-week range.
The second risk is structural. If enterprises keep prioritizing GPUs, memory, and data-center buildouts over software renewals, IBM’s mix thesis weakens even when the company executes well. Distributed Infrastructure’s 31% jump shows IBM can participate in that hardware cycle, but that revenue does not carry software’s 82.5% gross margin.
Consulting is the slow leak. At $5.3 billion a quarter and barely positive growth, it is too large to ignore and too soft to help a rerating. If the promised low-to-mid single-digit consulting acceleration does not appear, the 4% to 5% revenue guide has to be carried by software and a lumpy Z cycle. Acquisition integration and leverage are quieter risks: IBM spent $11.4 billion on acquisitions, lifted goodwill by more than $7 billion, and ended the quarter with $63.8 billion of debt against $11.1 billion of cash and securities. The dividend is still covered, but the room to absorb another miss is narrower than it was at year-end 2025.
What would change the thesis to the upside is software growth that stays in the 7% to 8% band, free cash flow that rises by more than $1 billion for the full year, and a consulting book that finally contributes. What would change it to the downside is a second failed close in the software pipeline, or evidence that the AI capex rotation was not a June anomaly. Until one of those paths is clearer, International Business Machines stocks look like a high-quality, moderately valued cash compounder trading in the long shadow of a once-in-a-generation down day.
FAQ
What ticker do International Business Machines stocks trade under?
IBM common shares trade on the New York Stock Exchange under the ticker IBM. There is one listed common share class, with 945.12 million shares outstanding and a float of 943.18 million, according to StockAnalysis data as of November 10, 2026.
What was the IBM stock price on November 10, 2026?
International Business Machines stocks closed at $244.73 on November 10, 2026, up $0.31, or 0.13%, on volume of about 2.97 million shares. The session ranged from $242.70 to $246.00. The shares also went ex-dividend that day for the $1.69 quarterly payment.
Why did International Business Machines stocks fall in July 2026?
On July 14, 2026, IBM shares dropped about 25% after CEO Arvind Krishna said preliminary second-quarter results missed expectations and that the company had "faltered" as clients shifted capex toward servers, storage, and memory. CNBC reported it as the worst session in records going back to 1968, steeper than the 23.7% drop on October 19, 1987. The stock later printed a 52-week low of $199.19 on July 23, 2026.
How much is the IBM dividend in 2026?
The board approved a quarterly cash dividend of $1.69 per share, payable December 10, 2026, to holders of record on November 10, 2026. That is $6.76 annualized, or a 2.76% yield at the November 10 close of $244.73. IBM has paid consecutive quarterly dividends every year since 1916, and StockAnalysis counts 30 years of dividend growth.
Are International Business Machines stocks expensive after the 2026 selloff?
At the November 10, 2026 close of $244.73, the shares traded at about 20.9 times trailing twelve-month EPS of $11.72 and about 18.7 times forward earnings, with a price-to-book ratio of 6.50 and a 2.76% dividend yield, per StockAnalysis. Twenty-five analysts had an average price target of $259.30, implying about 6% upside, and a consensus rating of Buy. The stock was still about 26% below its June 2, 2026 52-week high of $332.46.