IBM Stock Price at $247: How to Read the Quote, Path, and Valuation
Founder of Tritonix.ai. Former Hedge Fund Analyst with 10+ years of experience managing over $1B AUM across insurance portfolios and private funds. Specializes in institutional-grade fundamental analysis and long-term capital allocation.
How to read the latest IBM stock price quote
U.S. cash markets were closed on Saturday, November 14, 2026. The latest official IBM stock price is therefore Friday's New York close, not a weekend print or an after-hours flicker.
Yahoo Finance and StockAnalysis both show International Business Machines (NYSE: IBM) closing at $247.13 on November 13, 2026, up $2.46, or 1.01%, from the prior close of $244.67. The session opened at $246.63, traded between $244.83 and $247.85, and finished near the top of that range.
Volume was light. StockAnalysis records about 2.67 million shares, versus a 20-day average of roughly 4.85 million. A quiet Friday does not confirm a new trend; it only tells you that the $247 handle was accepted without a scramble for liquidity. Live and delayed quotes can be tracked beside other market series in Tritonix market data.
The other numbers on a standard quote page are as important as the last price:
| Quote field | Reading at the Nov. 13, 2026 close |
|---|---|
| Official cash close | $247.13 |
| Day range | $244.83–$247.85 |
| 52-week range | $199.19–$332.46 |
| Market cap | $233.57 billion |
| Shares outstanding | 945.12 million |
| 50-day / 200-day moving averages | $238.02 / $246.69 |
| Trailing dividend / yield | $6.76 / 2.74% |
Source: StockAnalysis quote and statistics pages, close of November 13, 2026; 52-week high and low dates from CNBC.
The $247.13 cash close is sitting just 44 cents above the 200-day average of $246.69, a level that now matters more than the round number itself.
Two caveats belong next to that quote. First, the November 10 ex-dividend of $1.69 slightly lowers like-for-like comparisons with early-November closes; Yahoo Finance's adjusted close for November 9 is $244.42, versus an unadjusted close of $246.11. Second, after-hours prints on Friday were a little softer than the cash close, and those quotes were not consistent across data vendors, so they should not replace the official session.
Market cap is simply price times shares. At $247.13 and 945.12 million shares outstanding, StockAnalysis's $233.57 billion figure follows directly. If the last price jumps a few dollars on Monday, the enterprise multiple moves with it. The 52-week range is wider than the daily bar: the stock is 25.7% below the June 2, 2026 intraday high of $332.46 and 24.1% above the July 23 low of $199.19.
The 2026 price path: a peak, a record crash, and a partial repair
The IBM stock price did not drift to $247. It was reset. Yahoo Finance historical prices show a December 31, 2025 close of $296.21. From that starting point, the unadjusted quote is down 16.6% year to date. From the November 13, 2025 close of $304.86, it is down 18.9% over 12 months.
{
  "type": "line",
  "title": "IBM Stock Closing Price Through the 2026 Reset",
  "index": "Date",
  "categories": ["Close"],
  "data": [
    {"Date": "2025-12-31", "Close": 296.21},
    {"Date": "2026-01-30", "Close": 306.70},
    {"Date": "2026-02-23", "Close": 223.35},
    {"Date": "2026-04-30", "Close": 230.98},
    {"Date": "2026-06-02", "Close": 329.23},
    {"Date": "2026-06-18", "Close": 249.10},
    {"Date": "2026-07-13", "Close": 290.23},
    {"Date": "2026-07-14", "Close": 217.07},
    {"Date": "2026-07-23", "Close": 206.65},
    {"Date": "2026-09-30", "Close": 219.93},
    {"Date": "2026-10-21", "Close": 251.46},
    {"Date": "2026-10-29", "Close": 258.28},
    {"Date": "2026-11-13", "Close": 247.13}
  ],
  "source": "Yahoo Finance historical prices, unadjusted session closes through November 13, 2026",
  "note": "June 2's $332.46 high and July 23's $199.19 low were intraday prints; the chart uses official closes."
}
The first air pocket arrived in February. On February 23, IBM closed at $223.35, down about 13% on the day, after Anthropic said its tools could help modernize COBOL systems. Reuters and CNBC both framed the selloff as a fear that AI would shrink high-margin mainframe and modernization work. That episode is still in the price: it taught the market to treat IBM as an AI-disruption candidate, not only as an AI beneficiary.
The stock then rebuilt into early summer. It closed May 29 at $297.80 and, on June 2, printed the 52-week high of $332.46 and a close of $329.23, according to Yahoo Finance and CNBC's quote page. That peak did not hold. By June 18 the close was already back at $249.10. A late-June rebound took the stock to $290.23 on July 13, which made the next session look even more violent.
July 14 was the day that still defines the current quote. Before the open, IBM issued a preliminary second-quarter warning. CNBC reported adjusted earnings of $2.93 a share on revenue of $17.2 billion, short of FactSet estimates for $3.01 and $17.86 billion. CEO Arvind Krishna said clients had shifted late-June capex toward servers, storage, and memory, and that "numerous large deals failed to close on the timelines we expected." The stock closed at $217.07, down 25.2% from the July 13 close, on about 67.4 million shares — its worst one-day drop in records going back to 1968, CNBC said, worse even than October 19, 1987.
The low came nine sessions later. On July 23, IBM traded down to $199.19 and closed at $206.65. From that close, Friday's $247.13 is a 19.6% bounce. From the intraday low, the rebound is 24.1%. Neither move has repaired the damage from June: the stock is still 24.9% below the June 2 close and 25.7% below the high.
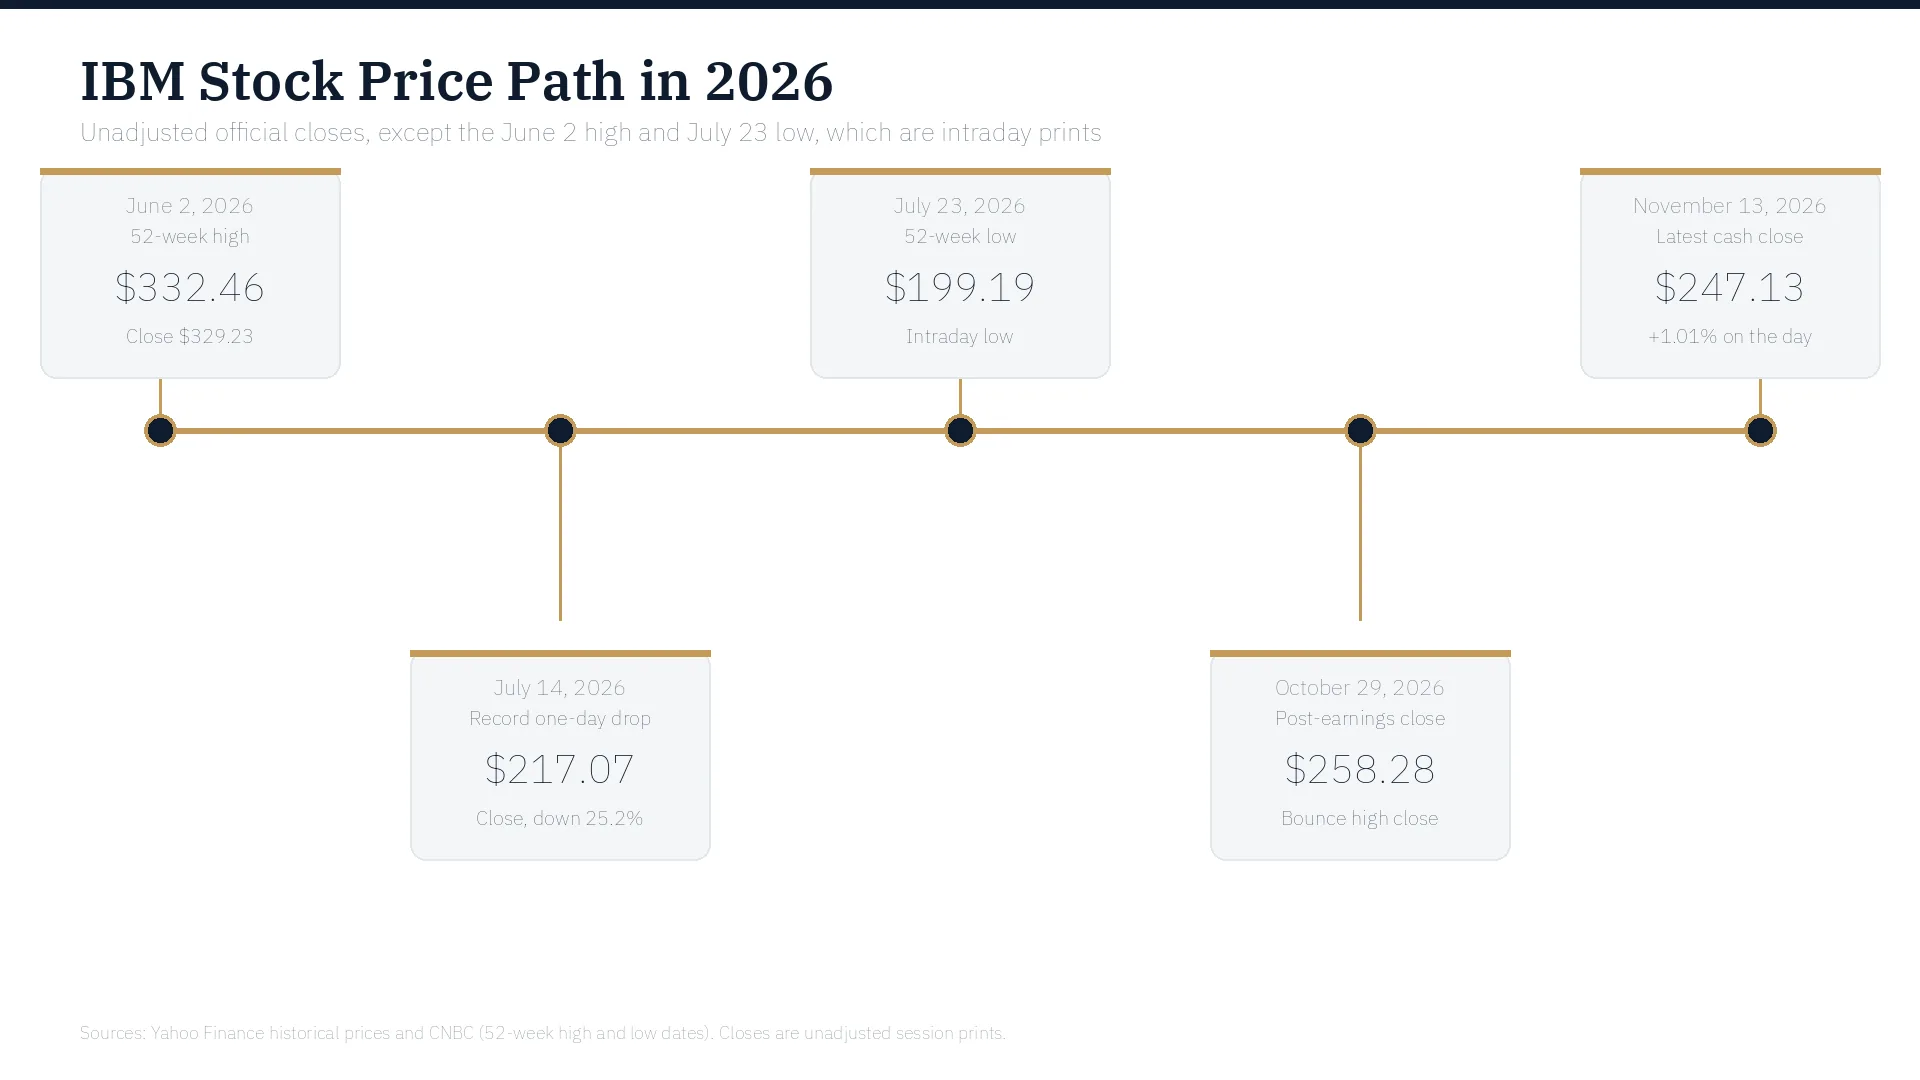
AI-generated timeline of the 2026 IBM stock price path, from the June 2 high of $332.46 to the November 13, 2026 cash close of $247.13.
The latest leg higher was an earnings repair, not a full re-rating. IBM reported third-quarter results after the close on October 21. In the regular session that day, the stock had already jumped 3.94% to $251.46. It closed October 29 at $258.28, then rolled over. The November 2 session high of $259.87 is the ceiling of the post-earnings bounce. Friday's close is 4.3% below that October 29 close and just a fraction above the 200-day average.
$247 is a recovery price, not a breakout price: the market has bought the bounce off $199, but it has not given IBM back the June multiple.
What is already in the current price
A useful way to read $247 is to ask what the market is no longer arguing about. The third-quarter beat is in the tape. IBM's October 21 release showed revenue of $17.1 billion, up 5%, or 6% at constant currency. Operating (non-GAAP) diluted earnings were $2.95, against a $2.87 estimate on Yahoo Finance, and free cash flow was $3.0 billion for the quarter and $7.8 billion year to date. Management kept a full-year constant-currency revenue outlook of 4% to 5% and raised the free-cash-flow outlook to an increase of more than $1 billion year over year.
The stock did what a "good enough" print usually does after a credibility shock: it rallied into the high $250s, then stalled. That stall is information. Buyers were willing to fade the July panic, but they were not willing to pay a June-type price for a mid-single-digit growth algorithm.
The mix inside the quarter is also in the price. Software rose 8% to $7.8 billion, with Hybrid Cloud (Red Hat) up 11% and Data up 19%. Infrastructure rose 4% to $3.7 billion, but only because Distributed Infrastructure jumped 31% while IBM Z fell 20%. Consulting was flat at $5.3 billion, or up 2% at constant currency. The quote is therefore pricing a software-led stabilization, not a broad re-acceleration, and it is still discounting a mainframe cycle that is in a down year.
Two more items have been absorbed with little drama. IBM went ex-dividend on November 10 for a $1.69 quarterly payment due December 10, and the cash close barely budged. On November 12, IBM said it had acquired AuthMind to extend identity observability across HashiCorp Vault and AI agents. The stock closed that session at $244.67, down 1.43%. The deal may matter strategically; it did not, on the day, change what investors would pay for the equity.
Wall Street's published targets sit close to the market, which is another way of saying the easy repair trade is done. StockAnalysis, compiling 25 analysts, lists an average 12-month target of $259.85, about 5.2% above Friday's close, and a consensus rating of "Buy." Yahoo Finance shows the same average, with a low of $174.00 and a high of $300.00. After the October 21 report, Yahoo recorded Jefferies maintaining a Buy rating and lifting its target from $270 to $280. The bull case is still on the sheet. It is just no longer far from the tape.
At $247, the market has already paid up for the third-quarter beat and the cash-flow raise; the remaining debate is whether software growth can stay high enough to justify getting back toward $260–$280.
Valuation at this IBM stock price
The multiple at $247 is no longer emergency pricing, and it is no longer a peak-cycle premium either. StockAnalysis's valuation page, last updated November 14, 2026, is the cleanest snapshot of what the current quote implies.
| Valuation measure | At the $247.13 close |
|---|---|
| Market cap / enterprise value | $233.57B / $289.65B |
| Trailing P/E / forward P/E | 21.08 / 18.90 |
| Price / sales (TTM) | 3.34 |
| Price / free cash flow | 15.94 |
| EV / sales / EV / EBITDA | 4.15 / 17.41 |
| PEG ratio | 3.43 |
| Free-cash-flow yield | 6.27% |
| Dividend yield / payout ratio | 2.74% / 57.66% |
Source: StockAnalysis IBM statistics, figures as of November 14, 2026, based on the November 13 close.
Trailing twelve-month revenue is $69.87 billion, net income is $11.17 billion, and diluted EPS is $11.72, which produces the 21.08 trailing P/E at Friday's close. Free cash flow of $14.66 billion, or $15.51 a share, supports a 15.94 price-to-FCF multiple and a 6.27% FCF yield — a more generous cash yield than the 2.74% dividend. The dividend still matters to income-oriented holders, and StockAnalysis counts 30 years of increases, but the equity case at this price is the cash-flow yield, not the coupon.
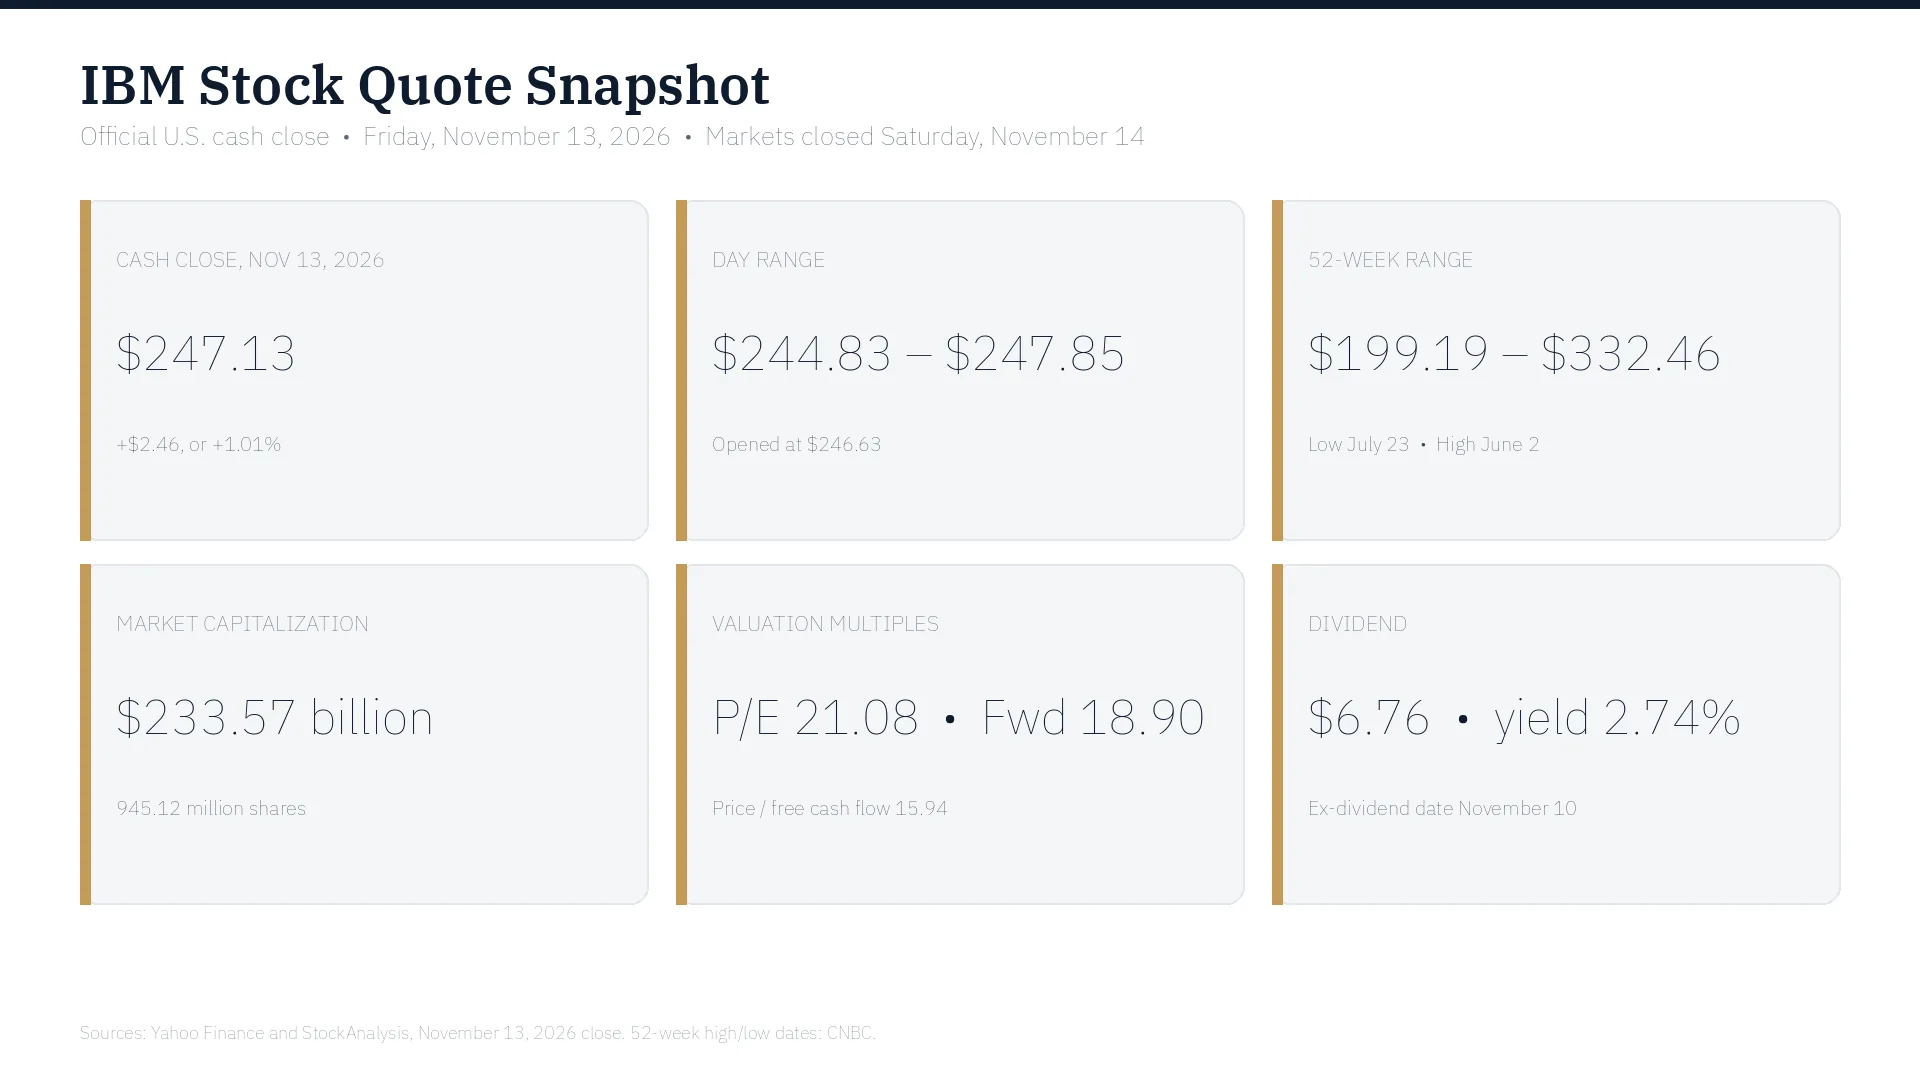
AI-generated snapshot of the IBM stock price at the November 13, 2026 cash close, including the 52-week range, market cap, P/E ratios, and dividend yield.
Enterprise value of $289.65 billion is the market cap plus net debt. IBM's own third-quarter release put cash, restricted cash, and marketable securities at $11.1 billion and total debt, including $12.7 billion of Financing debt, at $63.8 billion at quarter-end. That leverage is why EV/sales of 4.15 and EV/EBITDA of 17.41 are the tighter valuation tests than the headline P/E. A buyer of the equity is also underwriting a balance sheet with a StockAnalysis debt-to-equity ratio of 1.85 and book value of only $37.60 a share, or a price-to-book of 6.57.
The growth math is the constraint. A forward P/E of 18.90 would be unremarkable for a mid-teens compounder. IBM is not asking investors to capitalize that kind of growth. Management is still guiding to 4% to 5% constant-currency revenue growth, and StockAnalysis shows a three-year revenue growth forecast of 4.57% and EPS growth of 7.67%. Against that backdrop, a PEG ratio of 3.43 looks expensive if software slips again, and merely reasonable if Red Hat, data, and automation can keep the mix shifting up the margin stack.
$247 capitalizes a 6.3% free-cash-flow yield and an 18.9 times forward earnings multiple, which is fair only if the July demand shock does not return.
Drivers and risks that move the IBM stock price
The July letter is still the template for downside. If large software and infrastructure deals slip because clients divert capex to AI servers and memory, the multiple compresses quickly, as it did from $290 to $217 in a single session. The opposite is also true: evidence that software growth can stay in the high single digits, and that delayed deals are closing rather than disappearing, is the cleanest path back toward the post-earnings highs near $259 and the Jefferies $280 target.
Three operating swings will likely move the quote more than any product announcement. The first is Software, especially Red Hat and Data, which carried the third quarter. The second is IBM Z. A 20% decline is consistent with a mainframe down-cycle; any sign of a product-cycle turn would change both revenue and the perceived durability of transaction-processing software. The third is Consulting, still roughly a third of revenue and still barely growing. If consulting stays flat while software holds up, the stock can grind. If both soften together, $247 will look like a ceiling, not a floor.
Sentiment risk has a name now. The February COBOL scare and Krishna's July comment to CNBC about clients pausing after Anthropic's Mythos model are the same fear in different clothes: that generative AI reduces the need for IBM's services and legacy stack. IBM's public position is that its software is not being disrupted. The market has stopped pricing that fear at $199, but it has not forgotten it. Quantum, agent security, and the AuthMind purchase sit in the other column. They can support the narrative. They will not, on the evidence of November 12, re-rate the shares by themselves.
The balance sheet is a slower-moving risk, but it is not invisible. Year-to-date acquisitions of $11.4 billion and a still-levered capital structure mean that any stumble in free cash flow would show up in both the dividend debate and the equity multiple. Short interest is not a separate catalyst: StockAnalysis shows only 17.84 million shares short, or 1.89% of the float, and 3.13 days to cover.
Yahoo Finance lists an estimated next earnings date of January 27, 2027. Until then, the live drivers are deal commentary, any update to the 4-to-5% revenue range, and whether the stock can hold the 200-day average it is now leaning on.
Price levels to watch, and how to use the quote
The practical map starts with the moving averages. The $246.69 200-day line is now the first support under the official close. A decisive break below it, especially on volume closer to the 20-day average than Friday's 2.7 million shares, would reopen the mid-autumn range between the 50-day average of $238.02 and the September close of $219.93. Below that, the July 14 close of $217.07 and the July 23 low of $199.19 remain the crash landmarks.
Overhead, the market has already announced its resistance. The October 29 close of $258.28 and the November 2 high of $259.87 coincide almost exactly with the $259.85 average analyst target. That cluster is the first test of whether $247 is only a pause. Above it, the midpoint of the 52-week range is $265.83, and the late-June recovery high near $290 is the level the stock reached just before the warning. The June 2 high of $332.46 is not a near-term technical objective; it is a reminder of the multiple the market took away.
Those levels are easier to mark and revisit in a charting workspace such as Tritonix AI technical analysis. The quote itself should be read the same way every session: use the official cash close as the reference, compare it with the 50-day and 200-day averages, and treat after-hours prints as secondary. The IBM stock price at $247.13 is a mid-range recovery after a historic drawdown, priced at a cash-flow yield that looks decent and a growth multiple that leaves little room for another missed quarter.
FAQ
What is the IBM stock price today?
The latest official IBM stock price is the Friday, November 13, 2026, U.S. cash close of $247.13, up $2.46, or 1.01%, from the prior close of $244.67. U.S. markets were closed on Saturday, November 14, 2026, so weekend or after-hours prints should not replace that official close.
Why did the IBM stock price fall so sharply in 2026?
IBM hit a 52-week high of $332.46 on June 2, 2026, then recorded its worst one-day drop in records going back to 1968 on July 14, when a preliminary second-quarter warning sent the shares to a $217.07 close. The stock later printed a 52-week low of $199.19 on July 23. CEO Arvind Krishna blamed late-June capex shifts toward servers, storage, and memory, and large deals that failed to close on expected timelines.
Is IBM stock cheap at the current price?
At the November 13 close of $247.13, StockAnalysis shows a trailing P/E of 21.08, a forward P/E of 18.90, a price-to-free-cash-flow multiple of 15.94, and a 6.27% free-cash-flow yield. That is no longer crash pricing, and it is not a June-type premium either. The average 25-analyst target of $259.85 implies only about 5.2% upside, so the market has already paid up for the third-quarter beat.
What is IBM's 52-week high and low?
The 52-week high is $332.46, set on June 2, 2026, and the 52-week low is $199.19, set on July 23, 2026, according to CNBC and Yahoo Finance. Friday's $247.13 close is 25.7% below the high and 24.1% above the low.
What could move the IBM stock price next?
Yahoo Finance lists an estimated next earnings date of January 27, 2027. Until then, the IBM stock price is likely to move on software and Red Hat growth, the IBM Z cycle, consulting demand, any revision to the 4-to-5% constant-currency revenue outlook, and whether the shares can hold the $246.69 200-day moving average.