HOOD Stock Analysis After Q3 2026: Is Robinhood Still a Buy?
Founder of Tritonix.ai. Former Hedge Fund Analyst with 10+ years of experience managing over $1B AUM across insurance portfolios and private funds. Specializes in institutional-grade fundamental analysis and long-term capital allocation.
What "HOOD Stock" Actually Means for Investors
Search results for hood stock still mix music festivals and car-hood parts with the NASDAQ ticker that matters to investors: Robinhood Markets (HOOD). Clarifying that intent is the first filter. This guide covers the equity itself after Robinhood's October 27, 2026 third-quarter report—where the shares trade now, what drove the post-earnings selloff, and which operating metrics still support a multi-year compounder thesis.
As of the November 6, 2026 close, HOOD finished near $80.91, roughly 47% below its 52-week high near $153.86 and about 27% above the 52-week low of $63.52 (Google Finance). That drawdown is the opportunity—and the risk—investors are pricing after growth decelerated from 32.3% revenue growth in Q2 to 11.8% in Q3.
HOOD stock is no longer a pure "meme brokerage" bet; it is a test of whether Robinhood can keep diversifying revenue while crypto volumes normalize.
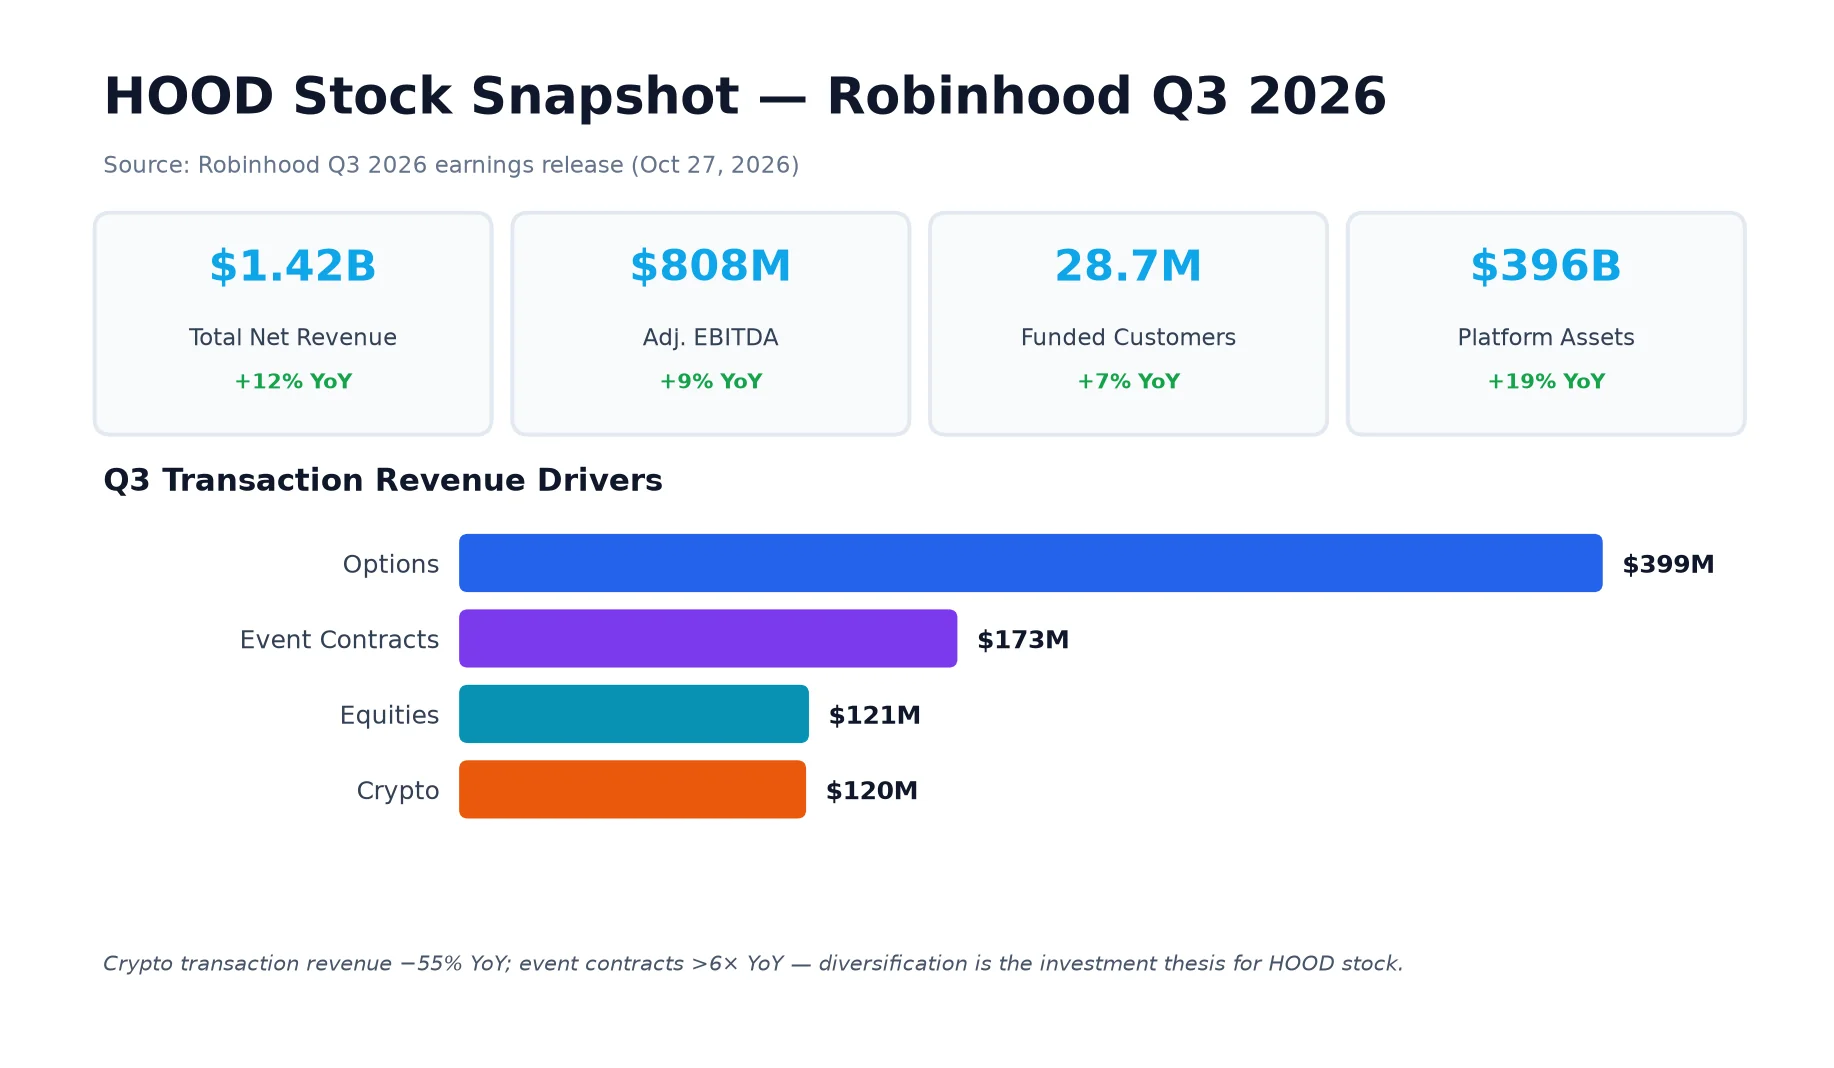 Q3 2026 snapshot: record revenue and EBITDA alongside a sharp crypto drag. Source: Robinhood earnings release, Oct 27, 2026.
Q3 2026 Scorecard: Record Revenue, Slower Growth
Robinhood reported $1.42 billion in total net revenues for Q3 2026, up 12% year over year and a quarterly record—yet below the roughly $1.43–$1.45 billion consensus range that circulated ahead of the print. Adjusted EBITDA rose 9% to a record $808 million, with an adjusted EBITDA margin near 57%. Diluted GAAP EPS fell 16% to $0.51; the newly introduced adjusted EPS printed $0.60, down 3% year over year after stripping $67 million of unrealized losses tied mainly to Robinhood Ventures Fund I mark-to-market.
Where the revenue mix moved
Transaction-based revenues rose 19% to $867 million. Inside that line, the story is bifurcation:
| Line item (Q3 2026) | Amount | YoY change |
|---|---|---|
| Options revenue | $399M | +31% |
| Event contracts | $173M | >6× |
| Equities revenue | $121M | +41% |
| Cryptocurrencies revenue | $120M | −55% |
| Net interest revenues | $415M | −9% |
| Other revenues | $142M | +61% |
Source: Robinhood Q3 2026 earnings release (Oct 27, 2026).
Equity notional volumes hit a record $992 billion (+53% YoY). Options contracts traded reached 905 million (+48%). Crypto notional volumes fell 38% to $50 billion. Event contracts traded jumped more than 7× to 16.4 billion. That mix shift is central to valuing HOOD stock: prediction markets and active-trader products are carrying growth while crypto take rates and volumes compress.
{
  "type": "bar",
  "title": "Robinhood Q3 Revenue Growth Deceleration (YoY %)",
  "index": "Quarter",
  "categories": ["Revenue YoY Growth %"],
  "data": [
    {"Quarter": "Q4 2025", "Revenue YoY Growth %": 26.5},
    {"Quarter": "Q1 2026", "Revenue YoY Growth %": 15.1},
    {"Quarter": "Q2 2026", "Revenue YoY Growth %": 32.3},
    {"Quarter": "Q3 2026", "Revenue YoY Growth %": 11.8}
  ],
  "source": "Company reports; Trefis synthesis (Nov 2, 2026)",
  "note": "Q3 2026 growth cooled sharply after a strong Q2 print."
}
Net interest income remains rate-sensitive. Management has framed a 25 bp rate move as roughly a 1.5% swing in revenue on an all-else-equal basis, with about $80 billion of interest-earning assets and roughly half of that rate-sensitive. For HOOD holders, that means NII is a stabilizer in higher-rate regimes and a headwind if cuts resume—exactly why diversification into Gold, banking, cards, and event contracts matters.
Platform Scale: Customers, Deposits, and Gold
Scale metrics still look like a growth company, not a mature broker trading at peak saturation.
- Funded customers: 28.7 million, up 7% year over year (+1.9 million).
- Total platform assets: $396 billion, up 19%.
- Net deposits: $15.7 billion in Q3; trailing twelve months $71.0 billion (21% growth vs. year-ago assets).
- October momentum: net deposits already topped $13 billion month-to-date on the earnings call, including about $6 billion from the Dell family's Trump Accounts gift.
- Robinhood Gold: 5.2 million subscribers (+34% YoY), an 18% attach rate overall and roughly 40% among new customers.
- ARPU: $200, up 5% year over year.
- Margin book: record $22.1 billion (+59%).
- Retirement AUC: record $36.6 billion (+51%).
Deposit compounding—not a single crypto cycle—is the cleaner long-term driver of HOOD stock free cash flow.
Management reiterated a 20% annualized net-deposit growth framework and said the company had already exceeded that goal for 2026 with two months left. Year-to-date deposits were cited above $68 billion by late October. That is the bull case in one number: customers keep sending cash even when crypto trading cools.
For investors comparing retail flows with institutional positioning, cross-checking HOOD ownership trends against larger brokerages on tools such as Tritonix institution smart money helps separate short-term retail chatter from sustained capital allocation.
Product cylinders beyond the brokerage core
CFO Shiv Verma highlighted 14 business lines now at or above $100 million annualized revenue. Rothera, the prediction-markets exchange joint venture, crossed that threshold in its first full quarter. Robinhood Gold Card reached 1.3 million customers with more than $19 billion annualized payment volume. Banking deposits approached $5 billion from over 350,000 funded customers, with about 40% on direct deposit. Strategies (digital advice) passed $2 billion AUM across roughly 350,000 funded customers.
These lines matter because they reduce HOOD's historical dependence on payment for order flow and crypto transaction spikes. Subscription and interest-adjacent revenues are stickier; event contracts add a high-growth, still-early category with regulatory and legal overhangs that investors must underwrite separately.
Ecosystem Bets That Can Re-Rate HOOD Stock
Three 2026 initiatives dominate the medium-term narrative.
Prediction markets and Rothera
Event-contract revenue of $173 million in Q3 (>6× YoY) is the clearest proof that Robinhood can create a new asset class inside its app. Rothera already runs above $100 million annualized revenue. Partnerships with Crypto.com / OG.com add a second venue and equity upside (initial 1% stakes with earn-outs up to 10%). Non-sports contracts were about 30% of the mix in Q3, up from 15% prior quarter—important if sports contracts face state-level legal challenges.
Agentic trading, chain volume, and global expansion
At HOOD Summit in September 2026, Robinhood announced 17 products aimed at active traders, including in-app Agents, 24/7 trading for select U.S. equities, perpetual futures for eligible customers, and earnings/KPI contracts. Roughly 200,000 customers have opened agentic trading accounts, generating over $1.6 billion notional volume. That early attach rate is small versus 28.7 million funded accounts, but the product direction positions HOOD as a technology platform rather than a commission-free copy of Schwab.
Robinhood Chain's first Mainnet quarter produced over $80 billion in DEX volume and more than $50 million in chain fees (management also cited $100 billion DEX volume in call remarks). Dubai DFSA authorization and in-principle MAS approval for Singapore extend the "global financial ecosystem" arc. Crypto in the U.K., Canada via WonderFi, and EU tokenized offerings broaden optionality—but also expand regulatory surface area.
Risks That Can Keep Pressure on HOOD Stock
The post-Q3 selloff was not irrational. Several overhangs remain:
- Growth deceleration: Trailing four-quarter revenue growth slowed to about 20.9% from 74.6% in the prior four-quarter window (Trefis, Nov 2, 2026). Multiple compression follows when the street prices HOOD as a hyper-grower.
- Crypto cyclicality: A 55% drop in crypto transaction revenue can erase optimistic models quickly if digital-asset volumes stay soft.
- Take-rate pressure: Analysts at Wells Fargo, Truist, and others cut targets after Q3, citing weaker monetization even when volumes were solid.
- Venture mark-to-market noise: The $67 million RVI-related unrealized loss introduced EPS volatility that will recur as Ventures funds scale.
- Regulation and litigation: Prediction markets face state challenges (including sports-event contract suits). PFOF, crypto staking, tokenization, and perpetual futures each carry rulebook risk.
- Competition: Schwab, Fidelity, Interactive Brokers, and Coinbase can match features; HOOD's edge is product velocity and retail mindshare, not exclusive economics.
{
  "type": "bar",
  "title": "Selected Post-Q3 HOOD Price Targets (USD)",
  "index": "Firm",
  "categories": ["Price Target"],
  "data": [
    {"Firm": "Bernstein", "Price Target": 160},
    {"Firm": "Morgan Stanley", "Price Target": 160},
    {"Firm": "Piper Sandler", "Price Target": 145},
    {"Firm": "Rosenblatt", "Price Target": 135},
    {"Firm": "KeyBanc", "Price Target": 135},
    {"Firm": "Goldman Sachs", "Price Target": 128},
    {"Firm": "Truist", "Price Target": 125},
    {"Firm": "Barclays", "Price Target": 115},
    {"Firm": "JPMorgan", "Price Target": 114},
    {"Firm": "KBW", "Price Target": 105},
    {"Firm": "Wells Fargo", "Price Target": 100}
  ],
  "source": "Firm notes summarized via Yahoo Finance / Google Finance (Oct 28–Nov 2, 2026)",
  "note": "Targets revised after Q3; ratings mostly Buy/Outperform with Hold outliers."
}
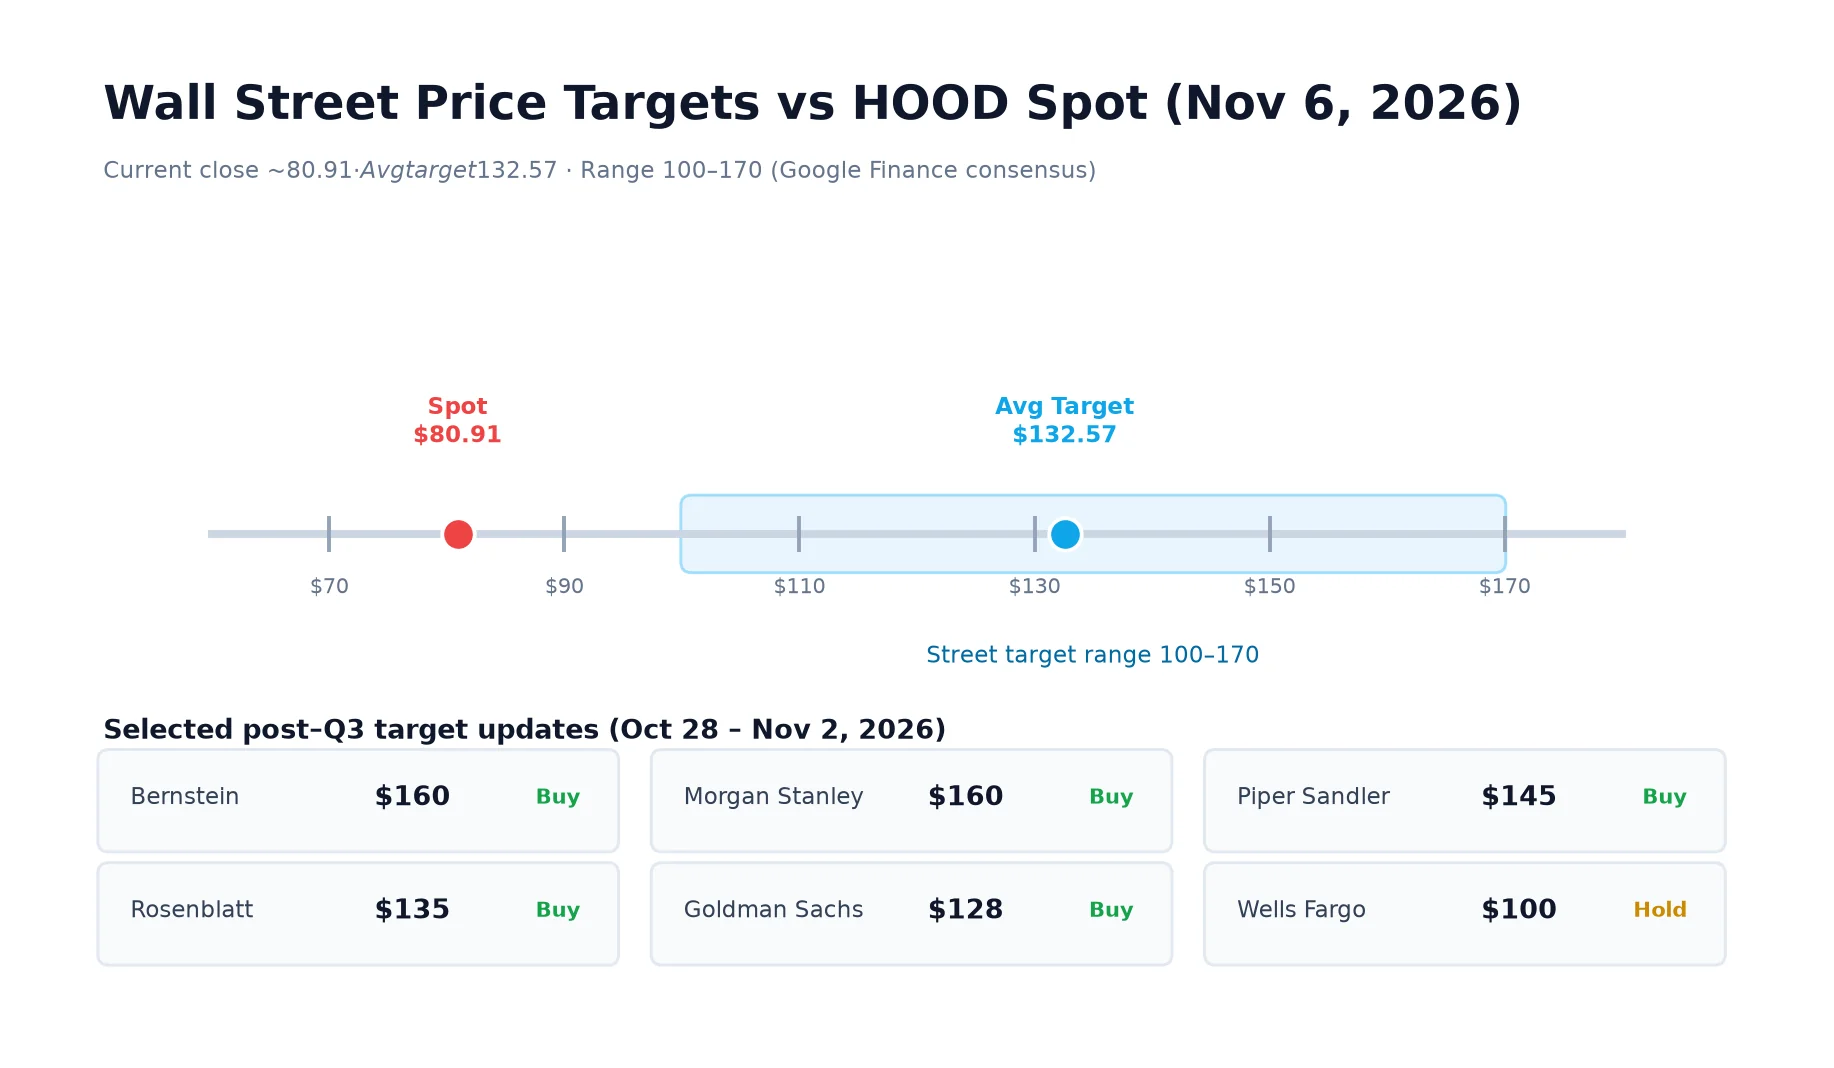 Consensus average target near $132.57 versus a ~$80.91 spot close on Nov 6, 2026 — a wide implied upside that already embeds execution risk.
How Investors Can Approach HOOD Stock From Here
Wall Street's 12-month average target near $132.57 (23 analysts on Google Finance) implies roughly 64% upside from the November 6 close, with a street range of about $100–$170. Bernstein and Morgan Stanley sit at $160; Wells Fargo's Equal Weight mark is $100. That dispersion is the point: bulls underwrite prediction markets, Gold attach, and deposit compounding; bears underwrite crypto softness and multiple compression.
Practical framing for position sizing:
| Approach | Fit | Main risk |
|---|---|---|
| Core long-term equity | Investors who buy the super-app / deposit flywheel | Multi-year regulatory and crypto cycles |
| Tactical swing around earnings | Traders using volume and volatility | Post-print gap risk (Q3 saw multi-day underperformance vs. S&P 500) |
| Leveraged single-stock ETFs (e.g., HOOG 2×) | Short-horizon specialists only | Daily reset / volatility decay; not a HOOD substitute |
Source: Company filings; Leverage Shares HOOG product disclosures; Google Finance consensus as of early Nov 2026.
For chart-driven timing around earnings and deposit prints, pairing fundamental catalysts with structured markup on Tritonix AI technical analysis is more disciplined than chasing social sentiment alone.
What to watch into Q4 2026 and early 2027
- Net deposits sustaining above the 20% annualized framework without one-off Trump Account gifts.
- Event-contract revenue durability and non-sports mix.
- Crypto volume and take-rate stabilization.
- Gold attach moving beyond 18% as banking and cards exit limited release.
- Expense discipline: full-year adjusted OpEx + SBC guide now $2.675–$2.75 billion (top end cut by $25 million).
- Next major print expected in February 2027 for Q4/FY2026.
HOOD stock at ~$81 prices a slower growth tape; it does not yet fully price a failed diversification story—or a fully successful one.
Active traders should also separate company analysis from trade timing. Deposit prints, Gold attach, and event-contract revenue are fundamental tells; gap risk around earnings is a technical tell. A rules-based checklist—earnings reaction, 20-day volume, and proximity to the $63.52 52-week low versus the $100 Wells Fargo target floor—keeps HOOD from becoming an unstructured high-beta lottery ticket.
The equity works as a high-beta fintech compounder if Robinhood keeps converting product launches into funded relationships and recurring monetization. It fails if crypto remains depressed, take rates keep sliding, and prediction markets hit a regulatory wall. After Q3 2026, the data still favor the compounder path—but the market will demand another quarter of deposit strength and clearer transaction-revenue quality before re-rating the multiple toward prior peaks.
FAQ
What is HOOD stock?
HOOD is the NASDAQ ticker for Robinhood Markets, Inc., the U.S. retail brokerage and financial platform. Searches for “hood stock” often confuse the equity with unrelated products; financially, it refers to Robinhood’s Class A shares.
Why did HOOD stock fall after Q3 2026 earnings?
On October 27, 2026 Robinhood posted record $1.42B revenue (+12% YoY) but missed some consensus estimates as growth slowed from 32.3% in Q2. Crypto transaction revenue fell 55%, and several banks cut price targets, driving a multi-day selloff.
What are the key growth drivers for HOOD stock now?
Core drivers include equity and options volume share gains, prediction markets/event contracts (Q3 revenue $173M), Robinhood Gold (5.2M subscribers), net deposits ($15.7B in Q3; $71B TTM), banking/cards, and early products such as agentic trading and Robinhood Chain.
What is a reasonable Wall Street target range for HOOD?
As of early November 2026, Google Finance showed an average 12-month target near $132.57 from 23 analysts, with a published range roughly $100–$170 after post-Q3 revisions from firms including Goldman Sachs, Bernstein, and Wells Fargo.
Is HOOD stock a buy after the Q3 pullback?
It depends on risk tolerance. Bulls emphasize deposit compounding, Gold attach, and prediction-market scale at a ~$81 spot price. Bears emphasize growth deceleration, crypto cyclicality, take-rate pressure, and regulatory risk. Position sizing and time horizon matter more than a binary call.