HD Stock at $347.51: The Housing Rally and the Q3 Earnings Test
Founder of Tritonix.ai. Former Hedge Fund Analyst with 10+ years of experience managing over $1B AUM across insurance portfolios and private funds. Specializes in institutional-grade fundamental analysis and long-term capital allocation.
What the latest hd stock quote is actually pricing
HD stock closed at $347.51 on Monday, November 16, 2026, down $1.18, or 0.34%, from Friday's $348.69. The session was orderly. Volume was 5.67 million shares against a 20-day average of 4.38 million, and the day's range ran from $346.13 to $349.73.
U.S. cash markets had already closed when this was written on Tuesday morning, November 17, in Asia/Shanghai, before the New York open. That Monday print is the latest official close. It is also the last close before a scheduled fundamental test: Home Depot reports third-quarter fiscal 2026 results before the U.S. open on Tuesday, November 17, with the conference call at 9:00 a.m. ET.
| Metric | November 16, 2026 |
|---|---|
| Official close | $347.51 |
| Day change | −$1.18 (−0.34%) |
| Open / high / low | $348.52 / $349.73 / $346.13 |
| Volume / 20-day average | 5.67 million / 4.38 million |
| Market capitalization | $346.71 billion |
| Shares outstanding | 997.69 million |
| 52-week range | $277.15 – $397.63 |
| 50-day / 200-day averages | $312.67 / $332.56 |
| Trailing P/E / forward P/E | 24.32 / 22.68 |
| Annualized dividend (yield) | $9.32 (2.68%) |
| Trailing free cash flow (yield) | $15.10 billion (4.36%) |
Source: StockAnalysis HD quote and statistics, as of the November 16, 2026 official close. Statistics were last updated November 16, 2026.
After-hours trading printed $347.48, down another $0.03, but those prints are not the official close.
The stock is extended versus its short-term averages and still unfinished versus its high. It finished 11.14% above its 50-day average of $312.67 and 4.50% above its 200-day average of $332.56, with a 14-day RSI of 62.29. It sits 12.60% below the 52-week high of $397.63, reached in February, and 25.39% above the 52-week low of $277.15, which was also the October 1 session low. StockAnalysis calculates a 52-week price change of −4.25%.
Investors who want to mark the $347.51 close against those moving averages, or to compare Monday's volume with the heavier post-election sessions, can do that work with Tritonix AI technical analysis.
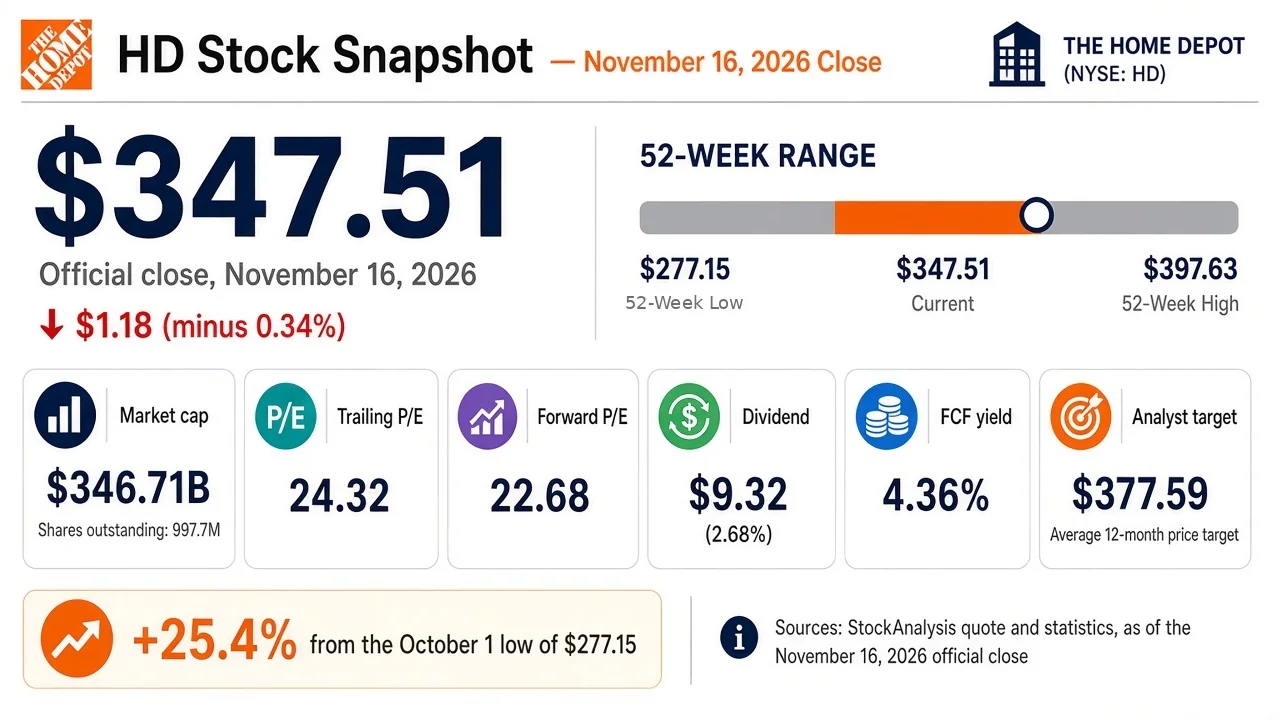
AI generated infographic of the November 16, 2026 hd stock close, 52-week range, and key valuation figures.
The autumn rally arrived before the tills could confirm it
From the October 1 low of $277.15 to Monday's close, hd stock has risen 25.4%. That is a far sharper move than anything Home Depot's last earnings report said about store traffic, and it is sharper than the mortgage market has allowed housing activity to be.
Most of the jump arrived in a handful of sessions. The shares gained 3.60% on October 29 and 3.63% on November 2, then rose 6.53% on November 4, the day after the U.S. midterm elections, closing at $355.44 on 8.10 million shares — almost double the 3.80 million traded the session before. The session high the next morning, $362.44 on November 5, remains the post-rally peak. Since then the stock has drifted, with lower highs of $356.90 on November 9 and $356.46 on November 12, and a range floor of $338.12 on November 6.
{
  "type": "line",
  "title": "HD Stock Closes from the October Low to November 16",
  "index": "Date",
  "categories": ["Close ($)"],
  "data": [
    {"Date": "Oct 1", "Close ($)": 282.46},
    {"Date": "Oct 8", "Close ($)": 295.47},
    {"Date": "Oct 15", "Close ($)": 308.24},
    {"Date": "Oct 22", "Close ($)": 327.73},
    {"Date": "Oct 29", "Close ($)": 328.98},
    {"Date": "Nov 2", "Close ($)": 341.15},
    {"Date": "Nov 4", "Close ($)": 355.44},
    {"Date": "Nov 6", "Close ($)": 343.47},
    {"Date": "Nov 9", "Close ($)": 353.42},
    {"Date": "Nov 13", "Close ($)": 348.69},
    {"Date": "Nov 16", "Close ($)": 347.51}
  ],
  "source": "Source: Yahoo Finance and StockAnalysis daily closes, October 1–November 16, 2026. The October 1 session low of $277.15 is the 52-week low; the close that day was $282.46.",
  "note": "The November 4 midterm-session jump to $355.44 remains the center of the autumn rally."
}
The November 4 move was a sector re-rating, not a company release. Housing and home-improvement names rallied as Treasury yields dipped and investors priced in a friendlier backdrop for affordability, as contemporaneous coverage in Yahoo Finance and The Motley Fool described. Home Depot did not publish results that day.
The rate backdrop is still tight. In Freddie Mac's Primary Mortgage Market Survey dated November 12, 2026, the 30-year fixed mortgage averaged 7.11%, the fourth consecutive weekly decline and the lowest reading in seven weeks, but still 0.87 percentage points above the 6.24% average a year earlier. The 15-year fixed averaged 6.45%. Cheaper mortgages than October are not the same thing as cheap mortgages, and they are not yet evidence that large discretionary renovation jobs have come back.
The share price has spent six weeks pricing a thaw in housing. The last official look at Home Depot's own transactions still showed fewer tickets and a bigger average basket.
What the second quarter already said about demand
The last hard data is the second quarter, which ended August 2, 2026, and was reported on August 18. Sales were $47.86 billion, up $2.58 billion, or 5.7%, from $45.28 billion a year earlier. Comparable sales rose 1.7%, and U.S. comps rose 1.3%.
That comparable-sales print was not a traffic recovery. Comparable average ticket rose 2.8%, to $92.50 from $90.01, while comparable customer transactions fell 1.0%. Total transactions, which exclude HD Supply and SRS, slipped to 443.2 million from 446.8 million. Net earnings were $4.77 billion, or $4.79 per diluted share, against $4.58 a year earlier. Adjusted diluted EPS, which excludes amortization of acquired intangibles, was $4.92, up from $4.68.
CFO Richard McPhail said the quarter exceeded expectations and that customers "continued to engage in smaller projects." That is a fence-and-fixture quarter, not a kitchen-and-addition quarter. It can still be a good quarter — and it was, relative to the company's own guide — without being a housing-cycle turn.
| Metric | Q2 FY2026 | Q2 FY2025 | Change |
|---|---|---|---|
| Net sales | $47.86 billion | $45.28 billion | +5.7% |
| Comparable sales | +1.7% | +1.0% | — |
| U.S. comparable sales | +1.3% | — | — |
| Comparable average ticket | +2.8% ($92.50) | +1.4% ($90.01) | — |
| Comparable customer transactions | −1.0% | −0.4% | — |
| Diluted EPS | $4.79 | $4.58 | +4.6% |
| Adjusted diluted EPS | $4.92 | $4.68 | +5.1% |
Source: Home Depot second-quarter fiscal 2026 results, August 18, 2026, and the accompanying SEC Exhibit 99.1. Ticket and transaction measures exclude HD Supply and SRS. The year-earlier ticket and transaction rates are the prior-period comparable changes reported in the same release.
First-half sales were $89.63 billion, up 5.3%. First-half comps were 1.2%, again with ticket up 2.5% and comparable transactions down 1.2%. Diluted EPS for the half was $8.09, barely above $8.03 a year earlier. Operating cash flow was $11.42 billion. The company paid $4.64 billion in dividends, spent $1.33 billion on acquisitions, repaid $3.04 billion of long-term debt, and did not use cash for share repurchases. At quarter-end it operated 2,364 retail stores and more than 1,340 SRS locations, with more than 470,000 associates.
The SRS and GMS distribution businesses are the other growth engine. They add sales that do not show up in the retail ticket and transaction counts, which is one reason total sales can grow faster than comps. They are also why adjusted EPS, which adds back acquired-intangible amortization, now has to sit beside the GAAP figure.
Management reaffirmed fiscal 2026 guidance on the August call: total sales growth of about 2.5% to 4.5%, comparable sales roughly flat to 2.0%, about 15 new stores, gross margin around 33.1%, operating margin of 12.4% to 12.6% (adjusted 12.8% to 13.0%), a 24.3% tax rate, net interest expense of about $2.3 billion, and diluted EPS growth of roughly flat to 4.0% from fiscal 2025's $14.23 (adjusted growth of flat to 4.0% from $14.69). Guidance includes IEEPA tariff refunds that are expected to partly offset unplanned fuel, energy, and other input costs.
Valuation, cash, and a dividend that now does the capital-return work
At $347.51, hd stock is a $346.71 billion company on 997.69 million shares. Trailing twelve-month revenue is $169.18 billion, net income is $14.23 billion, and EPS is $14.29. The trailing P/E is 24.32 and the forward P/E is 22.68. The PEG ratio is 2.73. Free cash flow over the past year was $15.10 billion, or $15.13 a share, a free-cash-flow yield of 4.36%. The price-to-free-cash-flow multiple is 22.96.
The balance sheet is not a fortress in the cash-rich sense. StockAnalysis, drawing on S&P Global figures last updated November 16, shows $2.09 billion of cash against $63.19 billion of total debt, for net debt of $61.10 billion, or $61.24 a share. Book value is only $16.65 a share, so the price-to-book ratio is 20.94 — a function of years of buybacks and a lean equity base, not of a cheap asset value. Return on invested capital is still 20.08%, and return on equity is 104.30%, the latter inflated by that same leverage. Interest coverage is 8.42 times. The current ratio is 1.08 and the quick ratio is 0.26. None of those figures is a distress signal, but they help explain why management has been paying down debt rather than shrinking the share count this year. Shares outstanding are up 0.20% year over year; the implied buyback yield is −0.20%.
What the company is still returning is the dividend. The annualized payout is $9.32 a share, or about $2.33 a quarter, for a yield of 2.68% at Monday's close. StockAnalysis records 16 years of dividend growth, though the latest annual increase was only 1.53%. The payout is 65.21% of trailing earnings and 61.58% of free cash flow — covered, but no longer a low ratio that leaves a wide margin for a large raise and a buyback at the same time. The most recent ex-dividend date was September 3, 2026.
Wall Street is constructive but not unanimous. Thirty-six analysts compiled by S&P Global and carried on StockAnalysis have a consensus rating of Buy and an average 12-month target of $377.59, 8.66% above the close. The low target is $310 and the high is $425. The November cluster is mixed: on November 13, Piper Sandler's Peter Keith maintained a Buy and cut his target from $378 to $371, while RBC's Steven Shemesh kept a Hold at $342. On November 10, Bank of America's Christopher Nardone reiterated a Buy but lowered his target from $407 to $397, UBS's Michael Lasser kept a Buy at $420, and Bernstein's Zhihan Ma kept a Hold and raised the target from $344 to $357.
Institutions own 76.36% of the stock, insiders 0.06%, and short interest is only 1.16% of shares outstanding, or 2.37 days to cover. Investors who want to line those targets up against institutional positioning can do that work with the Tritonix institution smart money tools, rather than treating a single price target as a forecast.
What Tuesday's third-quarter report needs to settle
Home Depot will report fiscal third-quarter results before the U.S. open on Tuesday, November 17, 2026, and will host the call at 9:00 a.m. ET, as the company announced on November 3. The year-ago quarter, which ended November 2, 2025, is the right comparison: sales of $41.4 billion, up 2.8%, including about $900 million from eight weeks of the then-recent GMS acquisition; comps up 0.2%; net earnings of $3.6 billion, or $3.62 a share; and adjusted EPS of $3.74. Comparable transactions fell 1.6% and comparable average ticket rose 1.8%. Then-CEO Ted Decker said the quarter missed expectations, citing a lack of storm-related demand, consumer uncertainty, and housing pressure.
| Line | Q3 FY2025, reported | Q3 FY2026 setup |
|---|---|---|
| Net sales | $41.4 billion | Street consensus ~$42.8 billion |
| Comparable sales | +0.2% | Telsey estimate ~+1.8% |
| Diluted EPS / adjusted EPS | $3.62 / $3.74 | Street consensus EPS $3.84 |
| Comparable customer transactions | −1.6% | To be reported November 17 |
| Comparable average ticket | +1.8% | To be reported November 17 |
Source: Home Depot third-quarter fiscal 2025 results, November 18, 2025. Street sales and EPS consensus as compiled in mid-November 2026 by TradingView and TipRanks. The 1.8% comps figure is Telsey Advisory Group's estimate, as cited ahead of the print; these are third-party views, not company guidance.
Street consensus, as compiled in mid-November, is for sales of about $42.8 billion and EPS of $3.84. That EPS figure would be roughly 2.7% above the year-ago adjusted $3.74. Those estimates will be right or wrong in a few hours.
The lines that matter more than a one-cent beat are the same ones the second quarter already flagged: comparable transactions, average ticket, and whether the full-year sales-growth and comps ranges of 2.5% to 4.5% and flat to 2.0% are still intact. A reaffirmed guide with transactions still negative would tell you the autumn rally is still an expectation about housing, not a receipt from the stores. A return to transaction growth, or a guide that leans toward the high end, would be the first evidence that the $347 price is catching up to demand rather than running ahead of it. Lowe's reports the following morning, on November 18, and will be the second read on the same customer.
The risks still sitting under the $347 close
The bull case for hd stock is compact: the company is still lifting ticket and, in management's account, taking share in a tough housing market; the Pro and SRS networks add a growth path that does not depend on a do-it-yourself boom; free cash flow covers a 2.68% dividend with room to spare; and a 50-day average far below the current price shows how quickly the market has been willing to re-rate the shares on any hint of easier financial conditions.
The bear case is just as compact.
First, the stock has already moved. A 25.4% rise from the October low, to a trailing multiple of 24.3 times earnings and a free-cash-flow multiple of 23 times, leaves less room if Tuesday's transactions are weak or if guidance is merely reiterated. The 52-week high of $397.63 is still 12.6% away, but that high was set in February, when the 52-week change was still positive. It is not a level the stock has earned back.
Second, mortgage rates have fallen for four weeks and are still high by recent standards. A 7.11% 30-year rate is not the condition in which households typically refinance, extract equity, or green-light large remodeling jobs. Home Depot has been clear that smaller projects have been carrying the basket. That mix can persist. It can also break if the professional customer slows or if tariffs and input costs outrun the IEEPA refunds built into guidance.
Third, leverage and the absence of buybacks this year change the equity story. Net debt of $61 billion and a 3.80 debt-to-equity ratio are serviceable at 8.4 times interest coverage, but they are why capital return is now mostly the dividend. Earnings growth of flat to 4% against a mid-20s multiple is not a cheap growth setup.
Fourth, acquisition accounting and integration are not free. Adjusted EPS exists because SRS and GMS brought a large intangible-amortization load. Goodwill and intangibles were $33.4 billion on the August 2 balance sheet. The distribution strategy can be the right one and still be a source of estimate noise.
At $347.51, hd stock is a quality retailer being priced as if the housing cycle is about to help. That story works if Tuesday's transactions turn and guidance holds or rises. It is less comfortable if the company once again reports a bigger ticket, fewer customers, and an unchanged outlook.
The next fundamental checkpoint is only hours away in New York. Until the 9:00 a.m. ET call is over, the November 16 close is the number that matters, and the business underneath it is still growing on price and mix more than on traffic.
FAQ
What is the latest hd stock price?
HD stock closed at $347.51 on Monday, November 16, 2026, down $1.18, or 0.34%, from Friday's $348.69. After-hours trading printed $347.48. U.S. cash markets were closed overnight in Asia as of this writing, so that official New York close is the latest print.
When does Home Depot report third-quarter 2026 earnings?
Home Depot reports fiscal third-quarter 2026 results before the U.S. open on Tuesday, November 17, 2026, and will host its conference call at 9:00 a.m. ET. A webcast is available from the company's investor-relations site.
How did Home Depot perform in the second quarter of fiscal 2026?
Sales were $47.86 billion, up 5.7%. Comparable sales rose 1.7%, with comparable average ticket up 2.8% and comparable customer transactions down 1.0%. Diluted EPS was $4.79, and adjusted diluted EPS was $4.92.
Does Home Depot pay a dividend?
Yes. The annualized dividend is $9.32 a share, or about $2.33 a quarter, for a yield of 2.68% at the $347.51 close. StockAnalysis records 16 years of dividend growth. The most recent ex-dividend date was September 3, 2026.
What is Wall Street's price target for hd stock?
Thirty-six analysts compiled by S&P Global have a consensus rating of Buy and an average 12-month target of $377.59, 8.66% above the November 16 close. The low target is $310 and the high is $425.