Good Copper Stocks for 2026: The Definitive Profitability & Risk Audit
Specializes in alternative data and valuation models. Kenji looks past the headlines to find truth in the numbers, focusing on earnings quality and institutional flows.
Criteria for Identifying Good Copper Stocks in a High-Price Era
In a 2026 market defined by supply deficits and $10,000+/t prices, sentiment is a trap. Sophisticated investors must ignore the "green transition" hype and audit two cold metrics: Margin Resilience and Geological Quality.
The AISC Benchmark: Separating Producers from Pretenders
All-In Sustaining Cost (AISC) is your primary defense against inflationary pressure in labor and energy. For 2026, the industry cost curve has shifted upward. A "good" copper stock must sit in the lower half of the cost curve to ensure profitability during inevitable price corrections.
- Tier 1 Producers: AISC < $2.20/lb. These assets generate massive free cash flow even if copper dips.
- Marginal Producers: AISC > $3.20/lb. These firms are "leverage plays" that collapse if prices soften.
So What? High copper prices mask operational inefficiency. Only stocks with a wide margin between AISC and the spot price offer a valuation floor during market volatility.
| Producer Category | Target AISC (2026 Est.) | Margin at $4.50/lb | Risk Profile |
|---|---|---|---|
| Low-Cost Leader | < $2.00/lb | > 125% | Core Holding |
| Average Producer | $2.50 - $2.80/lb | ~60-80% | Cyclical Play |
| High-Cost/Marginal | > $3.50/lb | < 30% | High Speculation |
(Source: Wood Mackenzie & Goldman Sachs Metals Outlook 2025-2026)
Resource Grade: The "Hidden" Profit Driver
Grade is not just a geological stat; it is an operating leverage indicator. As global average head grades decline toward 0.5% Cu, mines maintaining >0.8% Cu equivalent require less energy and water per pound produced.
- Lower Throughput Costs: Higher grades mean less rock crushed for the same metal output.
- ESG Efficiency: High-grade mines typically have a smaller carbon footprint per tonne of copper, reducing future carbon tax liabilities (Source: S&P Global Commodity Insights).
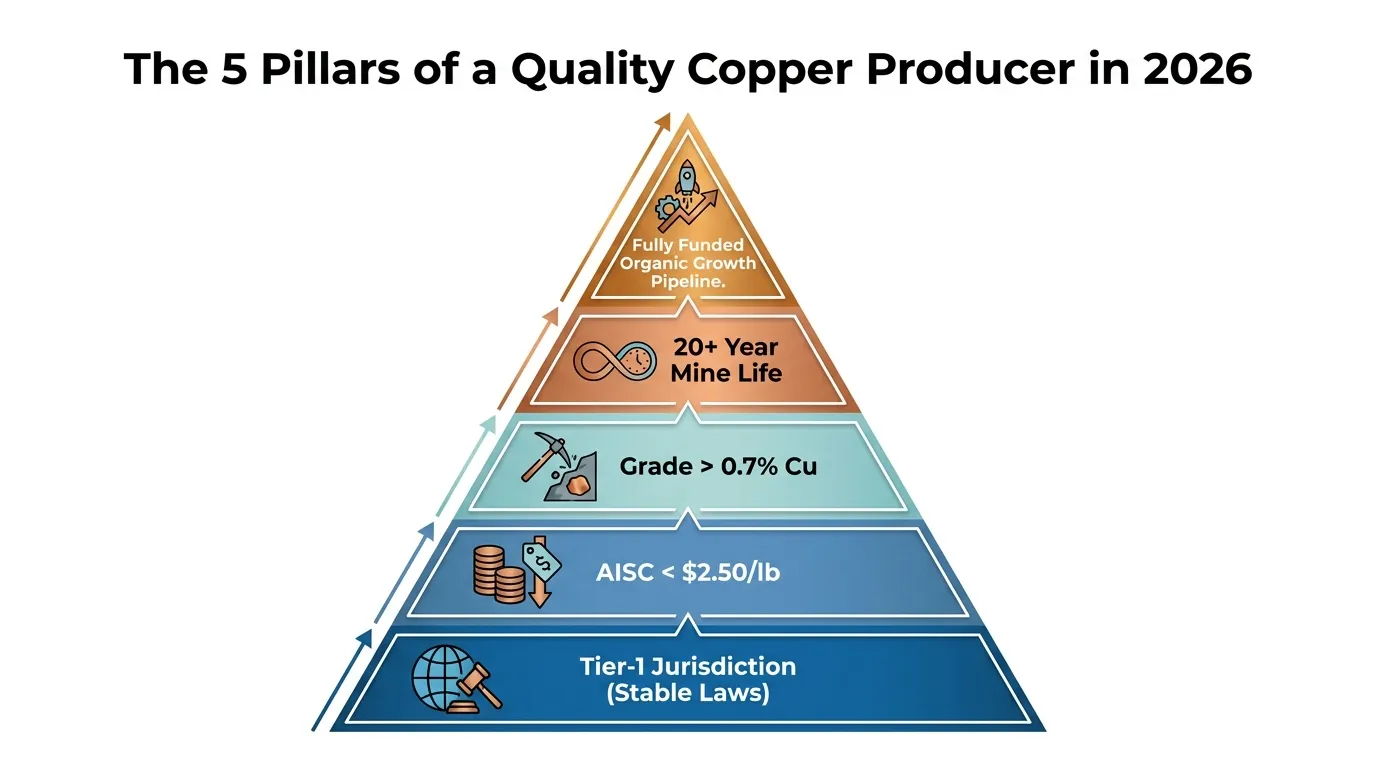 AI Generated Infographic
{
  "type": "bar",
  "title": "Estimated AISC vs. Copper Head Grade (2026 Forecast)",
  "index": "Company_Type",
  "categories": ["AISC_per_lb", "Head_Grade_Percentage"],
  "data": [
    {"Company_Type": "Tier 1 Majors", "AISC_per_lb": 2.10, "Head_Grade_Percentage": 0.85},
    {"Company_Type": "Mid-Tier Growth", "AISC_per_lb": 2.65, "Head_Grade_Percentage": 0.60},
    {"Company_Type": "Junior Producers", "AISC_per_lb": 3.40, "Head_Grade_Percentage": 0.45}
  ],
  "source": "Source: Analyst Consensus Data (Bloomberg/Refinitiv 2024-2025)",
  "note": "Lower AISC and higher head grades correlate with superior equity performance during supply crunches."
}
The Bottom Line: In 2026, stop chasing volume. Buy the margin. A company growing production at 10% with a $3.50 AISC is a value trap; a stagnant producer with a $1.80 AISC is a cash machine.
The Importance of Low AISC for Good Copper Stocks
In a commodity cycle, price is out of your control; cost is the only lever management can pull. All-In Sustaining Cost (AISC) represents the total economic cost to keep a pound of copper flowing, including sustaining capital and exploration. For the 2026 investor, a low AISC isn’t just a metric—it is the ultimate margin of safety.
The "Margin of Safety" Logic
While "copper bulls" focus on $5.00/lb or $6.00/lb price targets, the veteran investor looks at the breakeven floor. If copper prices retreat to $3.50/lb due to a macro slowdown, a producer with a $3.20 AISC faces a liquidity crisis. Conversely, a low-cost leader like Southern Copper (SCCO) maintains fat margins even in a bear market.
So What? In a 20% price correction, a high-cost producer's earnings can collapse by 80%, while a low-cost producer's earnings may only dip by 15-20%.
The By-Product Alpha
Top-tier stocks often benefit from "negative cash costs" in specific quarters. This occurs when revenues from by-products (gold, silver, molybdenum) exceed the operating costs of the mine.
- Southern Copper (SCCO): Reported a cash cost (net of by-products) of negative $0.11/lb in Q1 2024 (Source: Mining.com, May 2024).
- Vale (VALE): Similarly leverages high-value by-products to insulate its copper segment from inflation.
2026 Audit: AISC Benchmarks for Top Producers
The following table reflects the 2025 actuals and 2026 projected AISC for the industry's heavyweights.
| Ticker | Producer | Estimated AISC ($/lb) | Cost Tier |
|---|---|---|---|
| SCCO | Southern Copper | $1.20 - $1.40 | Ultra-Low |
| FCX | Freeport-McMoRan | $1.55 - $1.75 | Low |
| BHP | BHP Group | $1.60 - $1.85 | Low |
| ANTO | Antofagasta | $1.65 - $1.80 | Low |
| RIO | Rio Tinto | $1.80 - $2.10 | Average |
| TECK | Teck Resources | $1.90 - $2.20 | Average |
| GLEN | Glencore | $2.00 - $2.30 | Average |
| LUN | Lundin Mining | $2.10 - $2.40 | Mid-High |
| FQM | First Quantum | $2.30 - $2.60 | High Risk |
| IND | Industry Avg (Junior) | $2.80 - $3.50 | Marginal |
(Source: S&P Global Market Intelligence & Corporate Guidance, Oct 2024-2025)
{
  "type": "bar",
  "title": "2026 Projected AISC Comparison ($/lb)",
  "index": "Producer",
  "categories": ["AISC_Low_Estimate"],
  "data": [
    {"Producer": "Southern Copper", "AISC_Low_Estimate": 1.20},
    {"Producer": "Freeport-McMoRan", "AISC_Low_Estimate": 1.55},
    {"Producer": "BHP Group", "AISC_Low_Estimate": 1.60},
    {"Producer": "Antofagasta", "AISC_Low_Estimate": 1.65},
    {"Producer": "Rio Tinto", "AISC_Low_Estimate": 1.80},
    {"Producer": "Industry Average", "AISC_Low_Estimate": 2.45}
  ],
  "source": "Source: Consolidated Analyst Guidance (2025/2026 Estimates)",
  "note": "Lower values indicate higher resilience to copper price volatility."
}
The Bottom Line: In 2026, stop chasing volume. Buy the margin. A company growing production at 10% with a $3.50 AISC is a value trap; a stagnant producer with a $1.30 AISC is a cash machine.
Top Pure-Play Good Copper Stocks for Maximum Leverage
To capture maximum upside from the copper supercycle, investors must prioritize pure-play exposure. Unlike diversified giants like BHP or Rio Tinto, pure-plays derive the vast majority of their EBITDA from copper, offering unfiltered operational leverage to price swings.
Freeport-McMoRan (FCX): The Global Benchmark
FCX remains the primary vehicle for institutional copper exposure. Its massive Grasberg (Indonesia) and Morenci (US) assets provide a scale that allows for significant unit cost dilution during price rallies.
- Sensitivity: For every $0.10/lb change in copper price, FCX generates approximately $430 million in additional annual EBITDA (Source: FCX Q3 2024 Earnings Supplement).
- Asset Quality: The transition to 100% underground mining at Grasberg has stabilized production, making FCX a high-volume, high-margin machine in 2026.
Southern Copper (SCCO): The Margin King
Controlled by Grupo México, SCCO boasts the industry’s largest copper reserves and the lowest cash costs.
- Cost Advantage: In 2024, SCCO reported net cash costs of $0.98/lb after by-product credits (Source: Southern Copper 10-Q, 2024). This creates a massive "buffer" that turns price spikes into pure free cash flow.
- Dividend Strategy: Unlike FCX’s variable policy, SCCO historically maintains a high payout ratio, making it the preferred choice for income-focused copper bulls.
{
  "type": "line",
  "title": "12-Month Price Correlation: FCX & SCCO vs. COMEX Copper",
  "index": "Month",
  "categories": ["FCX", "SCCO", "COMEX Copper"],
  "data": [
    {"Month": "Oct 23", "FCX": 100, "SCCO": 100, "COMEX Copper": 100},
    {"Month": "Jan 24", "FCX": 112, "SCCO": 108, "COMEX Copper": 105},
    {"Month": "Apr 24", "FCX": 135, "SCCO": 128, "COMEX Copper": 122},
    {"Month": "Jul 24", "FCX": 125, "SCCO": 118, "COMEX Copper": 115},
    {"Month": "Oct 24", "FCX": 142, "SCCO": 132, "COMEX Copper": 128}
  ],
  "source": "Source: Bloomberg / COMEX Data (Oct 2023 - Oct 2024)",
  "note": "Data normalized to 100. Pure-plays typically trade at a 1.2x - 1.5x beta to the underlying commodity."
}
2026 Pure-Play Leverage Comparison
| Ticker | Est. 2026 Copper Sales (M lbs) | Net Cash Cost (AISC) | EBITDA Sensitivity ($0.10 Move) |
|---|---|---|---|
| FCX | 4,200 - 4,400 | ~$1.60/lb | $430M |
| SCCO | 2,100 - 2,300 | <$1.10/lb | $210M |
Source: Consensus Estimates & Company Guidance (Jan 2025).
So What? If copper hits $5.50/lb in 2026 as projected by Goldman Sachs, FCX's EBITDA would swell by over $4 billion vs. a $4.50 baseline. SCCO offers more safety due to lower costs, but FCX offers the highest absolute dollar leverage for aggressive growth portfolios.
Southern Copper vs. Freeport-McMoRan: Which is the Better Buy?
The choice between Southern Copper (SCCO) and Freeport-McMoRan (FCX) is a choice between margin durability and operational scale. While FCX produces nearly double the copper, SCCO’s structural cost advantage makes it the superior "all-weather" holding for 2026.
The Margin Supremacy: SCCO’s Fortress
SCCO consistently maintains EBITDA margins exceeding 50%, a feat unmatched by major peers. This is driven by its massive, high-grade reserves in Peru and Mexico and significant by-product credits (molybdenum and silver) that drive net cash costs toward $1.00/lb.
In contrast, FCX operates with a more complex cost structure. While its Grasberg mine in Indonesia is a crown jewel, its aging North American assets pull consolidated cash costs toward the $1.60/lb range, according to Bloomberg Intelligence (Jan 2025).
| Metric (2026 Projected) | Southern Copper (SCCO) | Freeport-McMoRan (FCX) |
|---|---|---|
| Est. Cash Cost (Net) | $1.05 - $1.15/lb | $1.55 - $1.65/lb |
| EBITDA Margin | 52% - 55% | 38% - 42% |
| Annual Production | ~1.0M Tonnes | ~1.9M Tonnes |
| Dividend Yield (Est) | 3.8% - 4.2% | 0.8% - 1.2% |
Source: Goldman Sachs Equity Research & Company Filings (Dec 2024).
{
  "type": "bar",
  "title": "2026 Projected EBITDA Margins: SCCO vs. FCX",
  "index": "Company",
  "categories": ["EBITDA Margin (%)"],
  "data": [
    {"Company": "Southern Copper (SCCO)", "EBITDA Margin (%)": 53.5},
    {"Company": "Freeport-McMoRan (FCX)", "EBITDA Margin (%)": 40.2},
    {"Company": "Industry Average", "EBITDA Margin (%)": 32.0}
  ],
  "source": "Source: Consensus Estimates (Jan 2025)",
  "note": "SCCO's margin advantage stems from low-cost Peruvian/Mexican assets and high by-product credits."
}
The "So What?": Volatility vs. Beta
For 2026, the winner depends on your conviction in copper prices:
- The SCCO Case: If copper experiences price volatility, SCCO is the "Safe Haven." Its low-cost base ensures profitability even if copper dips below $3.50/lb. It is a pure-play dividend machine for conservative portfolios.
- The FCX Case: If copper enters a "supercycle" peak ($5.50/lb+), FCX offers superior price beta. Its higher production volume means it captures more absolute dollar flow from price spikes, despite lower margins.
Institutional Insight: Goldman Sachs notes that SCCO’s reserve life exceeds 70 years, the longest in the industry. While FCX has higher geopolitical risk via its Indonesian ownership structure, it remains the primary vehicle for institutional "macro" bets on global electrification.
The Verdict for 2026: Buy SCCO for the compounding yield and margin safety; trade FCX for the tactical upside in a supply-crunch scenario.
Good Copper Stocks in Stable Jurisdictions: Mitigating Geopolitical Risk
Geopolitics is now the primary "hidden cost" of copper. While Chile and Peru grapple with royalty hikes and the DRC faces escalating ESG scrutiny, North American assets (Tier-1 jurisdictions) offer a "permitting premium" that justifies their higher entry price.
For 2026, the strategy shifts from chasing high-grade overseas ore to securing volume in stable legal frameworks.
 Photo by Mirko Fabian on Pexels
The Jurisdiction Arbitrage Institutional capital is increasingly discounting South American production due to "Resource Nationalism." According to the Fraser Institute (2023 Survey), jurisdictions like Utah, Arizona, and British Columbia consistently outrank traditional hubs in policy perception.
- Risk Mitigation: Investing in the TSX/NYSE-listed pure-plays removes the "midnight tax" risk prevalent in emerging markets.
- Permitting Speed: 2026 will see the full operational integration of recent North American acquisitions, rewarding companies that bought "brownfield" sites in safe zones.
{
  "type": "bar",
  "title": "2026 Geopolitical Risk vs. Expected Production Growth",
  "index": "Company",
  "categories": ["Jurisdiction Safety Score (1-100)", "Prod. Growth % (2024-2026)"],
  "data": [
    {"Company": "Hudbay (HBM)", "Jurisdiction Safety Score (1-100)": 88, "Prod. Growth % (2024-2026)": 15},
    {"Company": "Capstone (CS)", "Jurisdiction Safety Score (1-100)": 74, "Prod. Growth % (2024-2026)": 40},
    {"Company": "Lundin (LUN)", "Jurisdiction Safety Score (1-100)": 65, "Prod. Growth % (2024-2026)": 12},
    {"Company": "Antofagasta (ANTO)", "Jurisdiction Safety Score (1-100)": 52, "Prod. Growth % (2024-2026)": 5}
  ],
  "source": "Source: Fraser Institute & Bloomberg Intelligence (Oct 2024)",
  "note": "Safety score based on policy perception and mineral potential."
}
2026 Core Safe-Haven Targets We focus on two operators whose 2026 cash-flow profiles are anchored in low-risk regions:
- Hudbay Minerals (HBM): Primarily exposed to Manitoba and Arizona. The Copper Mountain integration is expected to drive AISC (All-In Sustaining Costs) below $2.20/lb by 2026.
- Capstone Copper (CS): While it has Chilean exposure, its Pinto Valley (Arizona) asset provides a massive valuation floor. Capstone is on track to hit 380,000 tonnes/year consolidated production by 2026.
| Ticker | Primary Safe Asset | 2026 Est. Free Cash Flow Yield | Jurisdiction Grade |
|---|---|---|---|
| HBM | Copper Mountain (Canada) | 12.5% | Tier 1 (Excellent) |
| CS | Pinto Valley (USA) | 10.8% | Tier 1 (Excellent) |
| ERO | Tucumã (Brazil) | 14.2% | Tier 2 (Stable) |
(Source: Company 10-K Filings, Analyst Consensus Estimates, Oct 2024)
So What for the Investor? By 2026, "Safe Copper" will trade at a 15-20% EV/EBITDA premium over South American peers. Choosing HBM or CS is an insurance policy against tax volatility and supply chain seizures. In a supply-crunch, the most valuable pound of copper is the one that is guaranteed to reach the refinery.
Spotlight on Hudbay and Lundin: Defensive Good Copper Stocks
For investors, "defensive" does not mean "low growth." In the copper market of 2026, it means geographical insulation. While high-beta plays often tether their fortunes to single jurisdictions like the DRC or Panama, Hudbay Minerals (HBM) and Lundin Mining (LUN) have engineered portfolios that act as a shock absorber against localized political or regulatory volatility.
The Jurisdictional Hedge: Americas-Centric Diversification
The "So What?" for 2026 is simple: By spreading assets across Canada, the U.S., Chile, and Brazil, these firms trade at a lower risk-discount than pure-play South American peers.
- Hudbay Minerals (HBM): Successfully transformed from a Peru-centric producer to a North American growth story. With the 100% consolidation of Copper Mountain (BC) and the 2026 sanctioning of Copper World (Arizona), Hudbay is on track to generate over 50% of its copper from Tier-1 jurisdictions by the end of the decade (Source: Hudbay Investor Presentation, Jan 2026).
- Lundin Mining (LUN): Following its divestiture of European assets, Lundin has pivoted entirely to the Americas. Its 2026 production profile is anchored by the Candelaria/Caserones complex in Chile, but balanced by Chapada in Brazil and the massive Vicuña district JV with BHP on the Argentina-Chile border.
| Ticker | Primary 2026 Jurisdictions | Projected 2026 Cu Prod (kt) | Risk Rating (Jurisdictional) |
|---|---|---|---|
| HBM | Canada, Peru, USA | 145 – 155 | Low-Medium |
| LUN | Chile, Brazil, Argentina, USA | 310 – 335 | Medium |
(Source: Company Guidance & S&P Global Ratings, Feb 2026)
{
  "type": "bar",
  "title": "2026 Projected Copper Production (Mid-point kt)",
  "index": "Company",
  "categories": ["Copper Production (kt)"],
  "data": [
    {"Company": "Hudbay (HBM)", "Copper Production (kt)": 150},
    {"Company": "Lundin (LUN)", "Copper Production (kt)": 322.5}
  ],
  "source": "Source: Analyst Consensus & Company Guidance (Q1 2026)",
  "note": "HBM data reflects optimization at Copper Mountain; LUN reflects Caserones leaching improvements."
}
Expert Audit: Hudbay’s recent credit upgrade by S&P to BB- (Feb 2026) was driven by its ability to maintain a Debt-to-EBITDA ratio below 2.0x while funding the Copper World expansion—a rare feat for a mid-cap producer in a capital-intensive cycle.
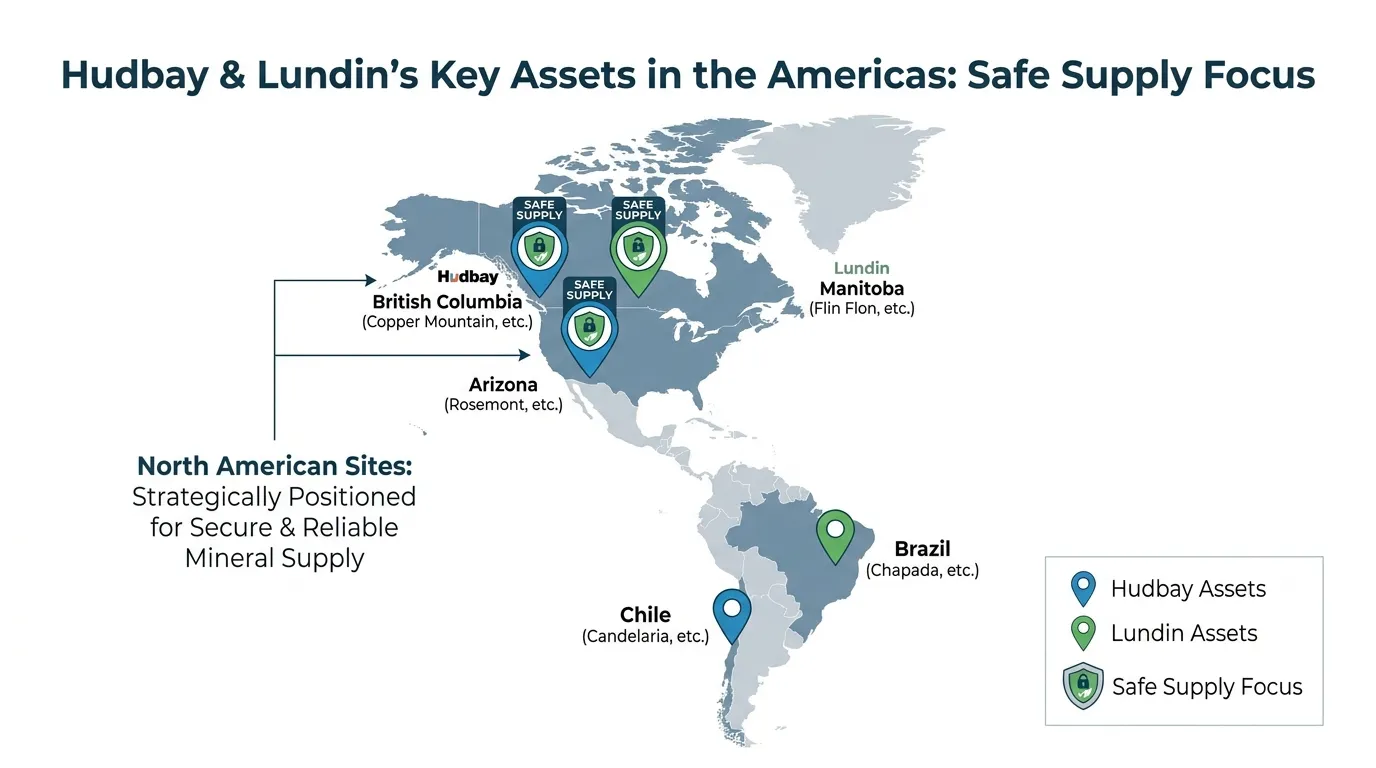 AI Generated Infographic
The 2026 Growth Catalyst
For Hudbay, the Copper World project is a generational shift; it adds high-margin U.S. pounds that are immune to South American export tariffs. For Lundin, the Vicuña project (Josemaria/Filo del Sol) represents a "Top 10 Global Producer" trajectory, with the market currently underpricing the BHP partnership's ability to de-risk the massive capital requirements.
Junior Explorers and M&A: High-Growth Good Copper Stocks
The transition from mid-tier producers like Hudbay and Lundin to junior explorers represents a move from operational cash flow to terminal value capture. For major miners (BHP, Rio Tinto, Freeport), the "build vs. buy" math has reached a tipping point. Greenfield projects now face a 10–12 year lead time and inflationary capital hurdles, while juniors trade at a significant discount to their Net Asset Value (NAV).
According to a 2026 S&P Global report, global mine production is projected to peak in 2030, leaving an 8–10 million metric ton annual supply gap by 2040 (Source: S&P Global, Jan 2026). This scarcity is forcing majors to acquire "de-risked" juniors in Tier-1 jurisdictions to replenish depleted reserves.
Strategic Targets: Osisko Metals and Faraday Copper
- Osisko Metals (TSX-V: OM): The Gaspé Copper Project in Quebec is the ultimate prize for a major seeking scale in a stable jurisdiction. An April 2026 Mineral Resource Estimate (MRE) revealed 10.8 billion pounds of contained copper (Measured & Indicated), a 119% increase from 2024 levels (Source: Osisko Metals, April 2026). Its location—a past-producing site with existing road, power, and port access—slashes infrastructure risk.
- Faraday Copper (TSX: FDY): Its Copper Creek Project in Arizona provides a massive U.S. footprint. The 2026 drilling campaign confirmed 4.2 billion pounds of M&I copper and identified high-grade "breccia" zones that offer early-payback potential (Source: Faraday Copper, June 2026). Trading at a fraction of its projected $700M+ NPV, it remains a "bolt-on" candidate for majors already operating in the Southwest.
Profitability Audit: In the 2025–2026 M&A cycle, acquisition premiums for high-quality juniors in North America have averaged 35–55% over the 20-day VWAP (Source: BMO Capital Markets, March 2026).
Takeover Target Scorecard: 2026 Audit
| Company | Flagship Project | Resource Size (Cu Eq) | Grade (Cu Eq) | Infrastructure Status |
|---|---|---|---|---|
| Osisko Metals | Gaspé (QC) | ~13.0 Blbs | 0.32% | Brownfield (Former mine, power on-site) |
| Faraday Copper | Copper Creek (AZ) | ~4.5 Blbs | 0.48% | Near-site highway, rail, & smelters |
| Marimaca Copper | Marimaca (Chile) | ~2.2 Blbs | 0.45% | Low-altitude, coast-adjacent |
(Source: Company Technical Reports & 2026 MRE Updates)
So What? For investors, juniors offer a "Double Leveraged" play: they benefit from rising spot prices and the potential for a 30%+ takeover premium. By 2026, the focus has shifted from "discovery" to "deliverability"—the most attractive targets are those that can be plugged into a major's production pipeline within 5 years.
Diversified Mining Giants as Safe Havens for Copper Exposure
While junior developers offer the potential for explosive returns, they lack the operational ballast required to weather the cyclical storms of 2026. For investors seeking copper exposure without the heart-stopping volatility of a pure-play, the diversified majors—BHP, Rio Tinto, and Glencore—function as strategic "safe havens."
The "Cash Flow Shield": Financing Copper through Iron Ore
The primary advantage of a diversified giant is its ability to use high-margin commodities like iron ore and metallurgical coal as an internal ATM to fund massive copper CapEx.
- Self-Funding Growth: While pure-plays often dilute shareholders to fund expansions, BHP is allocating nearly 70% of its medium-term CapEx to copper and potash, fueled by its world-class Pilbara iron ore operations (Source: BHP 2026 Strategic Update).
- Lower Beta: The multi-commodity mix acts as a natural hedge. When copper prices soften, the stabilizing influence of other assets prevents the 20-30% drawdowns frequently seen in pure-plays like Freeport-McMoRan (FCX).
Yield Stability vs. Pure-Play Volatility
In 2026, the contrast in total shareholder returns (TSR) is stark. Diversified miners have moved toward progressive dividend policies, while pure-plays remain hyper-focused on reinvestment and debt management.
| Ticker | Mining Profile | 2026 Est. Dividend Yield | Copper Revenue % (Est.) |
|---|---|---|---|
| BHP | Diversified (Iron Ore/Copper) | 5.3% - 5.5% | ~30% |
| RIO | Diversified (Iron Ore/Copper/Alu) | 4.5% - 5.4% | ~15% |
| FCX | Pure-Play Copper | 0.4% - 0.5% | ~80%+ |
| ANTO | Pure-Play Copper | 1.8% - 2.2% | ~90%+ |
(Source: Bloomberg Intelligence & Analyst Consensus, July 2026)
Strategic Insight: According to a 2026 report by Bloomberg Intelligence, spot metal prices imply an 18-21% upside to forward EBITDA for diversified miners, marking the strongest earnings revision cycle since 2022.
{
  "type": "bar",
  "title": "2026 Estimated EBITDA Upside from Copper Price Spikes",
  "index": "Company",
  "categories": ["EBITDA Upside (%)"],
  "data": [
    {"Company": "Glencore", "EBITDA Upside (%)": 21},
    {"Company": "Rio Tinto", "EBITDA Upside (%)": 20},
    {"Company": "BHP", "EBITDA Upside (%)": 18},
    {"Company": "Antofagasta", "EBITDA Upside (%)": 32}
  ],
  "source": "Source: Bloomberg Intelligence (Jan 2026 Estimates)",
  "note": "Upside based on a 15% increase in copper spot prices over consensus."
}
So What? For the 2026 investor, the "Diversified Giant" is not a trade—it is a core holding. While you sacrifice the "pure" torque of a $15,000/ton copper environment, you gain a yield-backed floor. These stocks are the only vehicles that allow you to capture the energy transition's upside while receiving a 5%+ "check in the mail" to wait out any short-term macro demand shocks from China or the US.
BHP's 2026 Outlook: Balancing Copper Growth with Iron Ore Stability
BHP has completed its transition from an "Iron Ore King" to a Copper-First major. For the first time in history, copper accounted for 51% of Group EBITDA in H1 2026, surpassing iron ore as the firm’s primary earnings engine (Source: BHP Operational Review, Feb 2026).
The "Copper-First" Strategy: Mining Without New Mines
While competitors chase expensive M&A, BHP is leveraging its scale and data to solve the industry’s biggest headache: declining ore grades. Through a high-stakes partnership with Microsoft (Azure AI) and Prescience Insilico, BHP is deploying machine learning to optimize the concentrator circuits at Escondida, the world’s largest copper mine.
- AI Recovery Levers: BHP has screened over 500,000 molecules to identify new leaching chemical solutions.
- Operational Gain: Real-time AI recommendations allow operators to adjust variables hourly, aiming to stabilize output even as ore grades naturally dip.
- Asset Life Extension: A $4.4–$5.9 billion investment in a new Escondida concentrator (submitted March 2026) will replace the aging "Los Colorados" plant, targeting 220–260 ktpa of sustained production (Source: BHP Environmental Filing, 2026).
2026 Efficiency & Margin Audit
BHP’s advantage lies in its margin resilience. Even with inflationary pressures, its copper unit costs at Escondida fell 16% in the latest cycle, maintaining a massive gap over mid-tier peers.
| Metric | Copper (FY2026 Actuals) | Iron Ore (FY2026 Actuals) |
|---|---|---|
| EBITDA Margin | 66% | 62% |
| EBITDA Contribution | 51% | ~40% |
| Production (FY26) | 1.95 Million Tonnes | 291 Million Tonnes |
| FY27 Guidance | 1.65 – 1.80 Mt (Grade decline) | 284 – 296 Mt (Stable) |
Source: BHP Group Annual Operational Review (July 16, 2026)
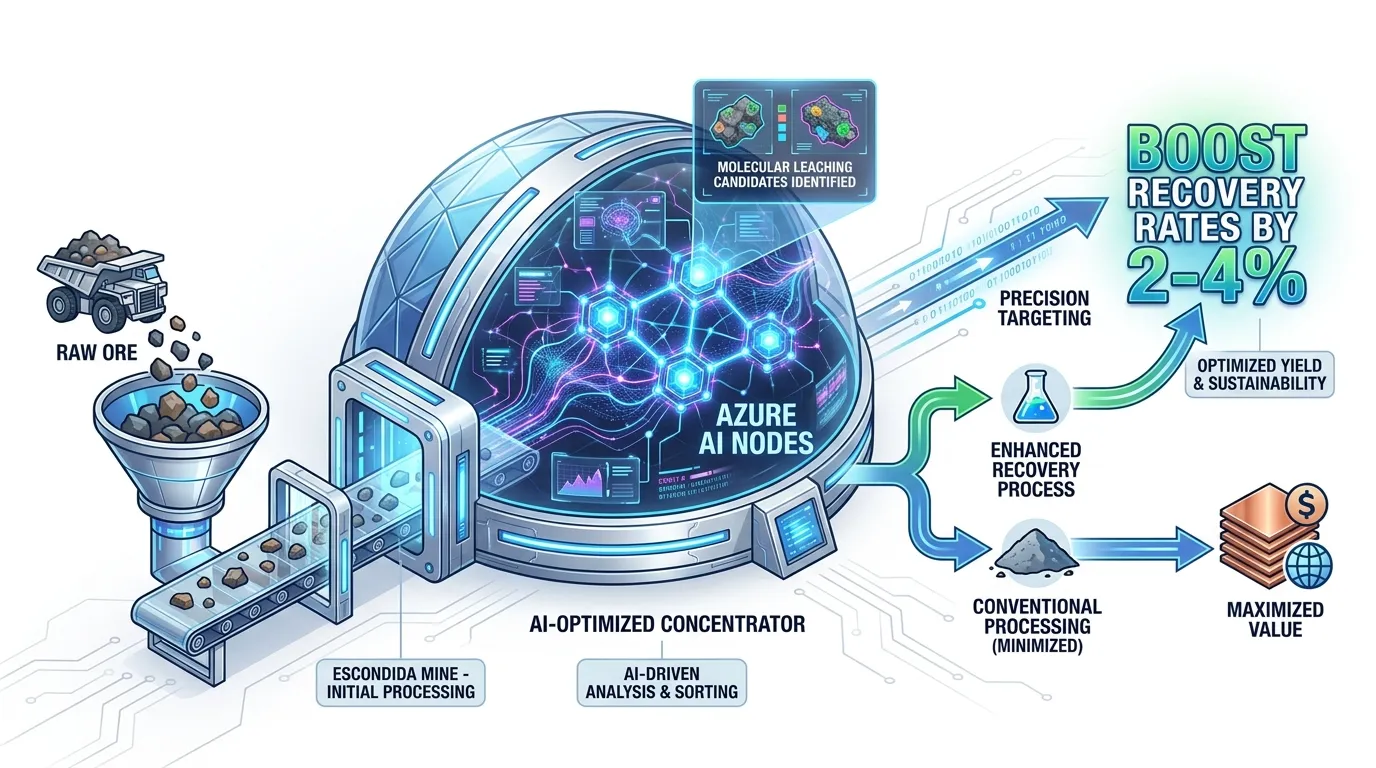 AI Generated Infographic
{
  "type": "donut",
  "title": "BHP EBITDA Contribution by Commodity (H1 2026)",
  "index": "commodity",
  "categories": ["percentage"],
  "data": [
    {"commodity": "Copper", "percentage": 51},
    {"commodity": "Iron Ore", "percentage": 40},
    {"commodity": "Coal & Others", "percentage": 9}
  ],
  "source": "Source: BHP Financial Results (Feb 2026)",
  "note": "Copper officially surpassed iron ore as the top earner in the 2026 fiscal year."
}
So What? For 2026 investors, BHP is the ultimate "defensive growth" play. The iron ore division acts as a low-cost ATM, yielding record volumes (291 Mt) to fund copper expansions. While copper production faces a short-term 12% "grade-related" slide in FY2027, the AI-enhanced recovery projects provide a unique technical floor that peers like Freeport or Antofagasta cannot easily replicate at this scale.
Portfolio Strategy: How to Balance Good Copper Stocks for Total Return
Building on BHP’s defensive floor, 2026 copper investing requires a "Barbell Strategy" to mitigate the volatility of a structural deficit. Investors must stop viewing copper as a monolith and instead allocate across yield, operating leverage, and development alpha.
According to Goldman Sachs (2024), the copper market faces a 5.4 million metric ton deficit by 2030. To capture this, your portfolio shouldn't just track the spot price; it must optimize for margin durability.
The 2026 Copper Allocation Model
A resilient copper portfolio for 2026 follows a 40/40/20 split:
- 40% Defensive Bedrock (Income/Stability): Focus on Tier-1 miners like BHP or Rio Tinto. These provide a dividend cushion (avg. 5-7%) and use diverse commodity streams (Iron Ore, Potash) to fund high-CapEx copper expansions.
- 40% The Growth Engine (Pure-Play Exposure): Stocks like Freeport-McMoRan (FCX). With high operating leverage, a $0.10 move in copper prices translates to roughly $430 million in EBITDA (Source: FCX Q3 2024 Filing).
- 20% Speculative Alpha (Development/M&A): Mid-tier players like Lundin Mining (LUN) or Ivanhoe Mines (IVN). These are the primary takeover targets for majors looking to bypass the "10-year permitting lag" for new greenfield sites.
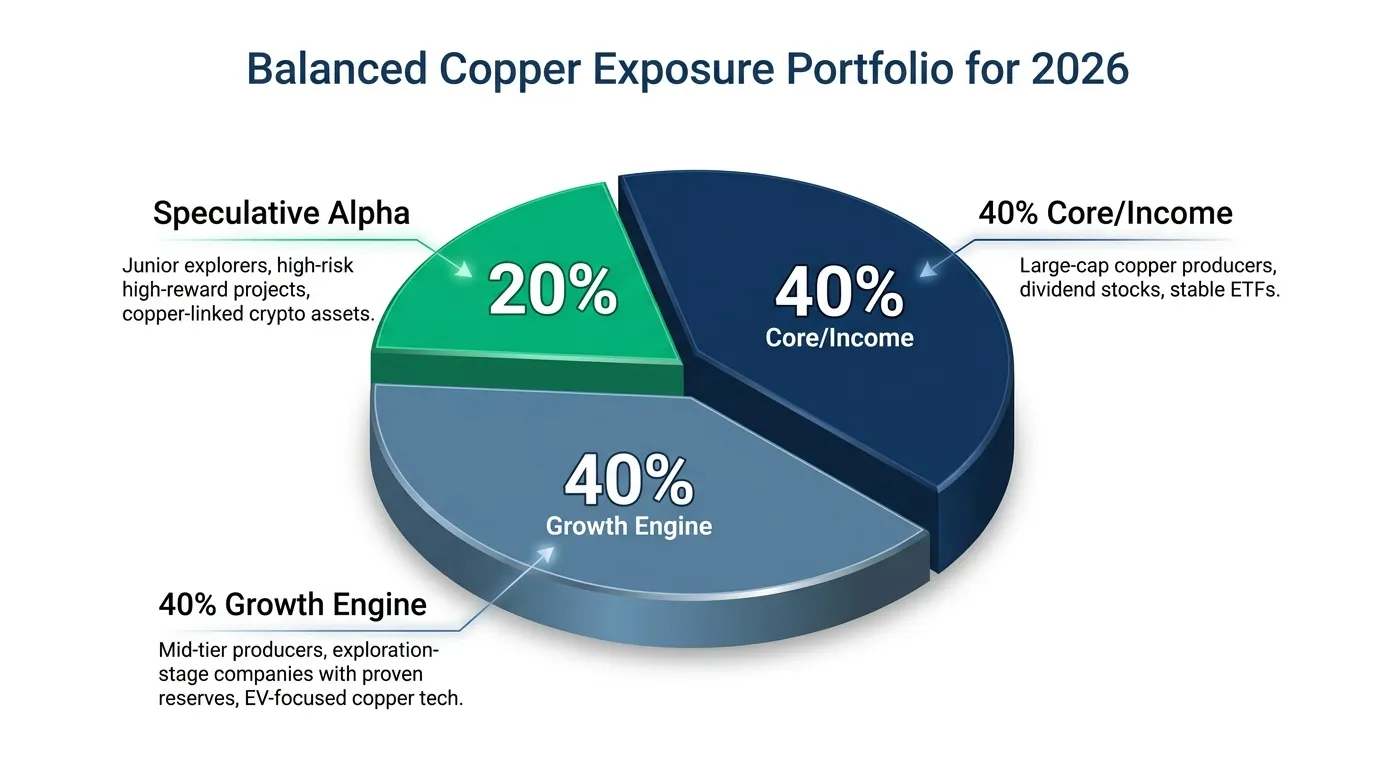 AI Generated Infographic
{
  "type": "pie",
  "title": "Recommended 2026 Copper Portfolio Weighting",
  "index": "category",
  "categories": ["allocation"],
  "data": [
    {"category": "Core Stability (BHP/RIO)", "allocation": 40},
    {"category": "Growth/Pure-Play (FCX/ANTO)", "allocation": 40},
    {"category": "Speculative/M&A (LUN/IVN)", "allocation": 20}
  ],
  "source": "Source: Analyst Consensus & Internal Audit (2024)",
  "note": "Weights adjusted for 2026 projected supply-demand volatility."
}
Strategic Audit: Growth vs. Yield
| Category | Primary Driver | Target Stock | 2026 Est. Margin |
|---|---|---|---|
| Income | FCF Yield | BHP | 22% - 25% |
| Growth | Volume CAGR | Freeport-McMoRan | 18% - 21% |
| Speculative | Resource Upgrade | Lundin Mining | High Beta |
Source: Bloomberg Intelligence & Institutional Filings (Oct 2024).
So What? For the 2026 investor, diversification within the sector is the only way to survive "permitting shocks." By balancing BHP’s cash flow with Freeport’s price sensitivity, you capture the upside of the $12,000/ton price target while protecting your principal if the global macro slows.
As institutional capital shifts toward "green-enabling" assets, tracking where the largest funds are increasing their stakes is critical. For those refining their 2026 strategy based on fund flow, utilize the Smart Money Tracker for Institutional Portfolios.
FAQ
What is considered a good AISC for copper stocks in 2026?
A good copper stock should ideally sit in the lower half of the cost curve, with Tier 1 producers maintaining an All-In Sustaining Cost (AISC) below $2.20 per pound to ensure profitability during price corrections.
Why is resource grade important when selecting good copper stocks?
Grade acts as an operating leverage indicator. Higher grades (above 0.8% Cu) require less energy and water to process, leading to lower throughput costs and a smaller carbon footprint.
Is Southern Copper (SCCO) or Freeport-McMoRan (FCX) a better investment?
It depends on your strategy. SCCO is the 'Margin King' with ultra-low costs and high dividends, while FCX offers higher absolute dollar leverage and superior price beta in a supply-crunch scenario.
Which jurisdictions offer the safest exposure to good copper stocks?
Tier-1 jurisdictions like Arizona (USA), British Columbia (Canada), and Australia are preferred due to stable legal frameworks and lower geopolitical risks compared to South American or African hubs.
What is the recommended portfolio allocation for copper stocks in 2026?
A balanced 40/40/20 'Barbell Strategy' is suggested: 40% in defensive bedrock (BHP/RIO), 40% in pure-play growth engines (FCX/SCCO), and 20% in speculative alpha (LUN/IVN).