GM Motors Stock at $83.67: The Last NYSE Close and the 6x Forward Multiple
20-year veteran of the bond markets. Marcus focuses on central bank policy, global liquidity cycles, and geopolitical risks tailored for the equity investor.
The last New York close in GM motors stock
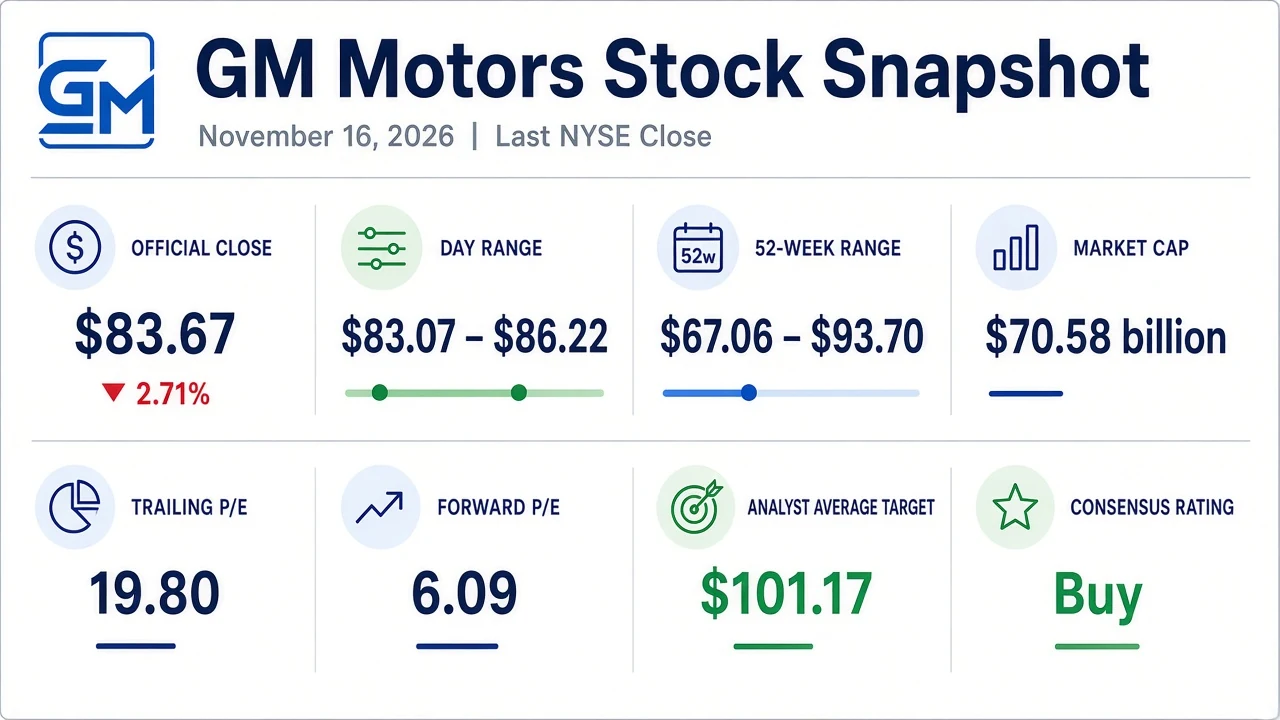
GM motors stock is the common equity of General Motors Company, and it trades under the ticker GM. Monday, November 16, 2026, was the last regular session for those shares on the New York Stock Exchange. The official close was $83.67, down $2.33, or 2.71%, from Friday's $86.00.
The session opened at $86.00, traded as high as $86.22, and bottomed at $83.07. Volume was 5.35 million shares, well below the 20-day average of 8.53 million. After-hours trading later printed $83.51, down another $0.17, or 0.20%, as of 7:58 p.m. ET.
This was written on Tuesday afternoon, November 17, in Asia/Shanghai, before the New York cash open. That Monday settlement is therefore the latest official close — and, according to GM's October 27 announcement, the last one on the NYSE. The company said the common stock is expected to begin trading on the Nasdaq Global Select Market on November 17, still under the symbol GM. Existing stockholders do not need to take any action.
| Metric | November 16, 2026 |
|---|---|
| Official close (last NYSE session) | $83.67 |
| Day change | −$2.33 (−2.71%) |
| Open / high / low | $86.00 / $86.22 / $83.07 |
| Volume / 20-day average | 5.35 million / 8.53 million |
| After-hours (7:58 p.m. ET) | $83.51 |
| Market capitalization | $70.58 billion |
| Shares outstanding | 843.55 million |
| 52-week range | $67.06 – $93.70 |
| 50-day / 200-day averages | $83.46 / $80.91 |
| Trailing P/E / forward P/E | 19.80 / 6.09 |
| Annualized dividend (yield) | $0.72 (0.86%) |
| Trailing free cash flow (yield) | $14.40 billion (20.40%) |
Source: StockAnalysis GM quote and statistics, as of the November 16, 2026 official close. Daily prices and volume are consistent with Yahoo Finance GM history.
The decline was not a GM-only event. Ford Motor fell 2.85% the same day, to $11.57. The last NYSE session in GM motors stock looked like a weak auto tape, not a company-specific blowup.
Even after the drop, the shares finished 0.25% above the 50-day average of $83.46 and 3.41% above the 200-day average of $80.91. The 14-day RSI was 47.22. The stock is 10.70% below the 52-week high of $93.70, reached on November 4, and 24.77% above the 52-week low of $67.06. StockAnalysis calculates a 52-week price change of +18.65%.
The path down from the $93.70 high
The November 16 close sits almost $10 below a high the stock set only eight trading days earlier. On November 4, GM motors stock traded as high as $93.70 and closed at $92.43, up 4.63%, on 7.61 million shares. That $93.70 print is the 52-week high.
The retreat that followed was orderly rather than violent. The stock fell 3.35% to $89.33 on November 5, on 11.32 million shares, then faded again on November 12, closing at $86.25, down 2.98%. By Friday, November 13, it was back at $86.00. Monday's last NYSE session extended that fade on lighter-than-average volume.
{
  "type": "line",
  "title": "GM Motors Stock Closes from the October Low to the Last NYSE Session",
  "index": "Date",
  "categories": ["Close ($)"],
  "data": [
    {"Date": "Oct 1", "Close ($)": 79.31},
    {"Date": "Oct 8", "Close ($)": 82.25},
    {"Date": "Oct 15", "Close ($)": 83.66},
    {"Date": "Oct 20", "Close ($)": 77.09},
    {"Date": "Oct 27", "Close ($)": 80.54},
    {"Date": "Oct 30", "Close ($)": 87.40},
    {"Date": "Nov 4", "Close ($)": 92.43},
    {"Date": "Nov 6", "Close ($)": 86.16},
    {"Date": "Nov 9", "Close ($)": 89.65},
    {"Date": "Nov 13", "Close ($)": 86.00},
    {"Date": "Nov 16", "Close ($)": 83.67}
  ],
  "source": "Source: Yahoo Finance and StockAnalysis daily closes, October 1–November 16, 2026. The November 4 session high of $93.70 is the 52-week high; the close that day was $92.43. November 16 is the last NYSE regular-session close.",
  "note": "The October 20 decline was the earnings-day session; the later fade from the November 4 high was not accompanied by a new results release."
}
The autumn tape had already shown how quickly the stock can move around a results date. On October 20, the day GM reported third-quarter 2026 results, the shares fell 6.84% to $77.09 on 24.70 million shares — the heaviest session in the window reviewed here. They then rallied to the November 4 high before giving a large part of that rebound back.
None of the later down days came with a new company earnings release. The fundamental book investors are still marking is the October 20 report and the guidance update that came with it.
Traders who want to map the $83.67 close against the 50-day and 200-day averages, or to compare Monday's light volume with the October 20 surge, can do that work with Tritonix AI technical analysis.
Why a 19.8 times trailing multiple can still be a 6 times stock
At $83.67, StockAnalysis puts the trailing P/E at 19.80 and the forward P/E at 6.09. That gap is the main reason GM motors stock can look expensive on a chart of reported earnings and cheap on a chart of what the company says it will earn this year.
Trailing GAAP earnings are $4.23 a share, on trailing-twelve-month net income of $3.88 billion and revenue of $186.95 billion. Those reported figures still carry the residue of special items, including the electric-vehicle capacity charges GM has been working through since 2025. Forward earnings are a different series. For fiscal 2026, StockAnalysis, citing S&P Global, shows consensus adjusted EPS of $13.39, which implies about 6.25 times the November 16 close. The 6.09 forward multiple on the quote page is consistent with the high end of the company's own adjusted EPS range.
In its October 20, 2026 press release, filed with the SEC, GM reported third-quarter revenue of $50.02 billion, up 2.9% from $48.59 billion a year earlier. Net income attributable to stockholders was $3.34 billion, or $3.73 a share. EBIT-adjusted was $4.11 billion, up 21.6%. EPS-diluted-adjusted was $3.70, up 32.2% from $2.80. North America EBIT-adjusted was $3.59 billion, with a margin of 8.7%. Adjusted automotive free cash flow was $5.88 billion, up 40.0%.
The company also narrowed full-year 2026 guidance and raised the free-cash-flow range:
| Measure | Updated 2026 guidance | Previous guidance |
|---|---|---|
| EBIT-adjusted | $14.5B – $15.5B | $14.0B – $16.0B |
| Adjusted automotive free cash flow | $11.5B – $12.5B | $9.5B – $11.5B |
| EPS-diluted-adjusted | $12.75 – $13.75 | $12.00 – $14.00 |
| Net income attributable to stockholders | $8.9B – $9.5B | $8.4B – $9.8B |
| Diluted EPS (GAAP) | $9.72 – $10.72 | $8.98 – $10.98 |
Source: GM third-quarter 2026 press release, October 20, 2026.
GAAP diluted EPS guidance of $9.72 to $10.72 still sits well above trailing EPS of $4.23, which is why the trailing multiple is the distorted one. The midpoint of adjusted EPS guidance, $13.25, would put the stock at about 6.3 times. The PEG ratio, per StockAnalysis, is 0.37.
Ford is not a clean trailing-earnings peer — it lost money on a GAAP trailing basis, so it has no P/E — but its forward P/E was 6.51 at the November 16 close of $11.57. On a forward basis, GM motors stock is not being priced as an outlier among the Detroit names. It is being priced as a cash-generative manufacturer whose reported trailing earnings are still catching up to the adjusted run rate.
Other multiples at the close were just as compressed: price-to-sales 0.38, price-to-book 1.13 on book value of $73.98 a share, and price-to-free-cash-flow 4.90. Trailing free cash flow was $14.40 billion, or $17.06 a share, for an FCF yield of 20.40%. Enterprise value is a much larger $173.48 billion, because it includes GM Financial's debt; EV/EBITDA is 9.22. That distinction matters. Automotive cash, cash equivalents, and marketable securities totaled $23.1 billion as of September 30, 2026, according to S&P Global Ratings, which revised its outlook on GM to Positive.
What the buybacks and the $0.72 dividend actually return
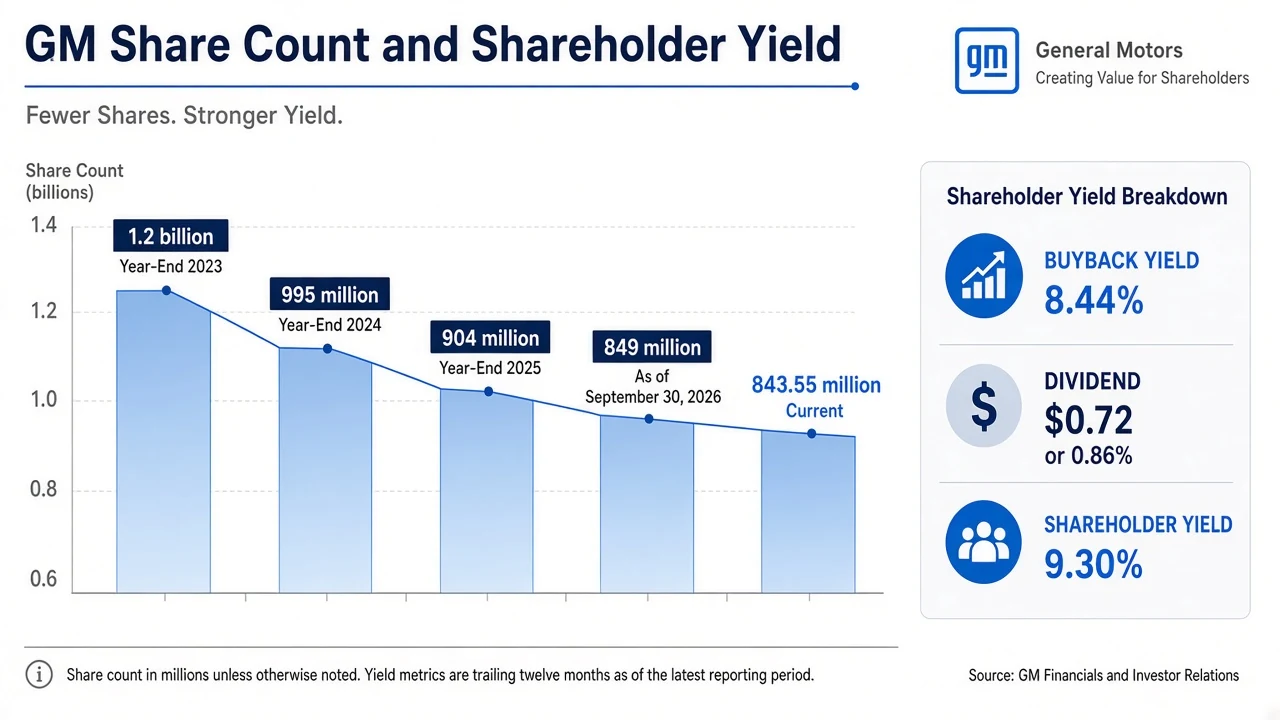
The equity shrink is not a footnote. In the October 20 release, GM said it had 849 million shares outstanding as of September 30, 2026, down from 904 million at the end of 2025, 995 million at the end of 2024, and 1.2 billion at the end of 2023. StockAnalysis now shows 843.55 million shares, a further decline, and a one-year share-count change of −8.44%.
{
  "type": "bar",
  "title": "GM Shares Outstanding, Year-End 2023 to the Current Count",
  "index": "Period",
  "categories": ["Shares (millions)"],
  "data": [
    {"Period": "YE 2023", "Shares (millions)": 1200},
    {"Period": "YE 2024", "Shares (millions)": 995},
    {"Period": "YE 2025", "Shares (millions)": 904},
    {"Period": "Sep 30, 2026", "Shares (millions)": 849},
    {"Period": "Current", "Shares (millions)": 843.55}
  ],
  "source": "Source: GM third-quarter 2026 press release for year-end 2023–2025 and September 30, 2026 counts; StockAnalysis for the current 843.55 million share figure as of the November 16, 2026 quote.",
  "note": "The 2023 figure is as reported by the company (1.2 billion). Later figures are given in millions of shares."
}
The board completed the $6.0 billion repurchase program announced in January 2026 and approved a new $20.0 billion multi-year authorization with no expiration date. That authorization may be suspended or discontinued at the company's discretion. On the earnings call, management said third-quarter repurchases were $2.5 billion, that year-to-date buybacks had reached $6.3 billion by mid-October, and that the new authorization represented more than 25% of then market capitalization. S&P Global Ratings has said it continues to expect GM to buy back at least $6 billion to $7 billion a year, supported by free cash flow, and that the company would be expected to reduce buybacks in a weaker economy.
The dividend is smaller, and it is deliberate. The board declared a quarterly cash dividend of $0.18 a share, or $0.72 annualized, payable December 17, 2026, to holders of record at the close on December 4, 2026, which is also the ex-dividend date. At $83.67, the yield is 0.86%. StockAnalysis records three years of dividend growth and a 26.32% increase versus the prior year. The payout ratio is 17.04% of trailing earnings and only 4.22% of free cash flow. Combined with the 8.44% buyback yield, shareholder yield is 9.30%.
Institutions own 92.84% of the shares, per StockAnalysis, with a float of 840.94 million. Short interest is modest: 20.47 million shares, or 2.43% of the float, and 2.44 days to cover. Investors who want to see how large holders have been adjusting those stakes can follow the flow through Tritonix institution smart money tools.
The risks that still sit in the quote
A 6 times forward multiple is not a free lunch. It is the market's way of saying that a lot of the cash has to show up, and that several line items can still move against the stock.
Tariffs remain inside the guidance. In the third-quarter earnings materials, GM said gross tariff costs were expected to be at the low end of a $2.5 billion to $3.5 billion range. Commodity inflation, including logistics and DRAM costs, was marked at about $2 billion, up from a prior $1.5 billion to $2 billion band. Onshoring, supply-chain investment, and higher software expense were still expected to add $1.0 billion to $1.5 billion of cost. Electric-vehicle losses were expected to improve by $1.0 billion to $1.5 billion, but the company has also been paying down supplier settlement cash: an additional $0.2 billion of EV cash charges in the third quarter brought the total since the end of the first half of 2025 to $7.4 billion, of which $4.6 billion had been paid ($4.2 billion in 2026 year to date), with about $1 billion more expected in the fourth quarter and the rest in 2027.
The international book is softer than North America. GMI EBIT-adjusted was only $28 million in the third quarter, down 87.7% from $226 million. China equity income was $32 million, the eighth consecutive profitable quarter, but down 60.3% from $80 million. GM Financial EBT-adjusted was $668 million, down 16.9% from $804 million.
Consolidated debt is large because of the finance company. StockAnalysis shows $130.71 billion of total debt against $27.81 billion of cash, a net cash position of −$102.90 billion, and a debt-to-equity ratio of 2.03. The Altman Z-Score of 1.28 should be read in that light — it is a consolidated figure, not a clean automotive-only score. The Piotroski F-Score is 6.
Wall Street is constructive but not unanimous. Twenty-four analysts polled by S&P Global have a consensus rating of Buy and an average 12-month target of $101.17, 20.92% above the November 16 close. The low target is $75, or 10.36% below the close; the high is $132, or 57.76% above it. The November mix, as compiled by StockAnalysis, is 13 Strong Buy, 7 Buy, 4 Hold, and no Sell or Strong Sell. Recent notes include Citi's Michael Ward reiterating Buy with a $131 target on November 9, after the Nasdaq announcement, and Tigress Financial's Ivan Feinseth lifting a target to $132 on October 28.
How to watch the first Nasdaq sessions
The mechanical change on Tuesday is real, and it should not be over-read. The ticker stays GM. Stockholders do not swap certificates. A Nasdaq listing makes the company eligible for possible inclusion in the Nasdaq-100, as Chief Financial Officer Paul Jacobson noted on October 27; eligibility is not admission, and no inclusion has been announced.
What matters for the quote is whether the $83.67 close holds as support around the 50-day average of $83.46, or whether the fade from $93.70 continues through the 200-day average at $80.91. A break under that longer average would put the October 20 earnings-day close of $77.09 back in view. On the upside, the stock has to recapture the mid-$86 area, then the November 9 close of $89.65, before the 52-week high is in play again.
The next hard date on the calendar is the December 4 ex-dividend. The fundamental calendar is quieter until the next earnings print. Until then, GM motors stock will be marked on the same things that were in the October 20 book: North America margin discipline, the cash cost of the electric-vehicle reset, tariff and commodity assumptions, and the pace of the new $20 billion authorization.
FAQ
What is the latest GM motors stock price?
GM motors stock closed at $83.67 on Monday, November 16, 2026, down $2.33, or 2.71%, from Friday's $86.00. After-hours trading printed $83.51 as of 7:58 p.m. ET. That Monday print was the last official NYSE close; the shares are expected to begin trading on Nasdaq on November 17 under the same ticker, GM.
When does GM start trading on Nasdaq?
GM said its common stock would remain listed on the NYSE through the close on November 16, 2026, and was expected to begin trading on the Nasdaq Global Select Market on November 17, 2026, still under the symbol GM. Existing stockholders do not need to take any action.
Why is GM's trailing P/E so much higher than its forward P/E?
At the November 16 close of $83.67, the trailing P/E was 19.80 on GAAP earnings of $4.23 a share, while the forward P/E was 6.09. The gap reflects special items in reported earnings, including EV-capacity charges, versus fiscal 2026 adjusted EPS guidance of $12.75 to $13.75 and consensus adjusted EPS of $13.39.
Does GM pay a dividend?
Yes. The board declared a quarterly cash dividend of $0.18 a share, or $0.72 annualized, payable December 17, 2026, to holders of record at the close on December 4, 2026. At $83.67, the yield is 0.86%. Combined with an 8.44% buyback yield, shareholder yield is 9.30%.
What is Wall Street's price target for GM motors stock?
Twenty-four analysts polled by S&P Global have a consensus rating of Buy and an average 12-month target of $101.17, 20.92% above the November 16 close. The low target is $75 and the high is $132.