Gene Stocks 2026: Financial Analysis of CRISPR, Gene Therapy, and RNA Leaders
Specializes in alternative data and valuation models. Kenji looks past the headlines to find truth in the numbers, focusing on earnings quality and institutional flows.
Categorizing the 2026 Gene Stocks Market
The term "gene stocks" is no longer a monolith of speculative biotech. By 2026, the sector has matured into three distinct asset classes, each governed by different biological mechanisms and risk-adjusted return profiles.
Investors must distinguish between companies "fixing" the code, "replacing" the code, or "sending instructions" to the cell. According to Goldman Sachs (2024), the total addressable market (TAM) for genomic medicines is projected to reach $120 billion by 2030, but capital allocation must follow specific sub-sector boundaries.
The 2026 Gene Stock Taxonomy
| Sub-Sector | Core Technology | FDA Pathway | Risk Profile |
|---|---|---|---|
| Gene Editing | CRISPR/Cas9, Base/Prime Editing | Complex/Long-term | High (Off-target risks) |
| Gene Therapy | Viral Vectors (AAV, Lentivirus) | Moderate (Established) | Medium (Manufacturing hurdles) |
| RNA Medicines | mRNA, siRNA, ASO | Faster (Plug-and-play) | Lower (Transient effects) |
(Source: FDA Center for Biologics Evaluation and Research, Jan 2025)
Gene Editing (CRISPR): The "One-and-Done" Disruption Led by pioneers like CRISPR Therapeutics (CRSP) and Intellia (NTLA), this sub-sector focuses on permanent genomic changes. Following the 2023 approval of Casgevy, the focus has shifted from ex-vivo (outside the body) to in-vivo (direct injection) therapies.
- So What? These stocks offer the highest upside but face intense intellectual property (IP) litigation and long-term safety monitoring.
Gene Therapy: The Viral Delivery Mainstream Companies like Sarepta (SRPT) and REGENXBIO (RGNX) utilize viral vectors to deliver functional genes. This is the most "commercial" segment, with multiple approved therapies for rare diseases.
- So What? The bottleneck here is CMC (Chemistry, Manufacturing, and Controls). Companies that own their manufacturing facilities trade at a 20-30% premium over those that outsource (Source: McKinsey, 2024).
RNA-Based Medicines: The Scalable Platform This segment, including Alnylam (ALNY) and Ionis (IONS), doesn't change DNA; it intercepts it via "instructional" RNA.
- So What? This is the "cash cow" of the sector. Unlike gene editing, RNA therapies often require chronic dosing, creating a predictable, recurring revenue model that appeals to value-oriented investors.
{
  "type": "donut",
  "title": "Estimated 2026 Gene Stock Market Share by Revenue",
  "index": "sector",
  "categories": ["revenue_share"],
  "data": [
    {"sector": "RNA Medicines", "revenue_share": 45},
    {"sector": "Gene Therapy", "revenue_share": 35},
    {"sector": "Gene Editing", "revenue_share": 20}
  ],
  "source": "Source: Bloomberg Intelligence (Projected 2026)",
  "note": "RNA leads due to commercialized rare disease and vaccine products."
}
Expert Insight: "The 2026 market penalizes 'platform-only' stories. Investors now demand clinical proof of concept (PoC) and a clear path to $1B+ peak year sales," notes the Barclays Healthcare Equity Research team (Nov 2024).
The Rise of RNA-based Gene Stocks
The shift in 2026 investor sentiment is definitive: the market has cooled on "one-and-done" curative hyperbole in favor of the repeatable revenue models offered by RNA-based leaders. While CRISPR and AAV (Adeno-Associated Virus) therapies face a "commercial ceiling"—struggling with multi-million-dollar upfront costs and the logistical nightmare of "finding the next patient"—RNA companies like Avidity Biosciences and Stoke Therapeutics are winning on Lifetime Value (LTV) logic.
The "Subscription" vs. "Lump Sum" Paradox
The financial core of the 2026 RNA dominance is dosage flexibility. Unlike genomic "edits" which are irreversible, RNA therapeutics (ASOs, siRNAs, and AOCs) function like a "molecular volume knob." For payers and providers, this mitigates the catastrophic financial risk of a $4M failure. For investors, it creates a predictable, chronic revenue stream that mimics the successful biologics era.
- Avidity Biosciences (RNA): Despite the September 2026 Phase III HARBOR trial setback in Myotonic Dystrophy (Source: Bloomberg Intelligence, Sept 2026), its $12 billion acquisition by Novartis validates the "Antibody Oligonucleotide Conjugate" (AOC) platform. Big Pharma is betting on the modality, not just a single asset.
- Stoke Therapeutics (STOK): A 2026 breakout. Its lead candidate, zorevunersen (STK-001) for Dravet syndrome, demonstrated disease-modifying potential in its Phase 3 EMPEROR study (Source: NEJM, March 2026). By upregulating protein expression via RNA rather than altering DNA, Stoke avoids the "permanent error" risk associated with CRISPR.
| Feature | One-and-Done (AAV/CRISPR) | RNA-based (AOC/ASO) |
|---|---|---|
| Revenue Model | One-time High-Margin ($2M-$4M+) | Recurring "Subscription" Model |
| Regulatory Risk | High (Off-target effects permanent) | Moderate (Reversible/Dose-adjustable) |
| Payer Acceptance | Complex (Value-based/Annuity models) | Standard (Chronic drug reimbursement) |
| Manufacturing | Bespoke/Low Scalability | Platformized/High Scalability |
| (Source: Goldman Sachs Equity Research & SEC Filings, Q2 2026) |
{
  "type": "bar",
  "title": "Projected Market Penetration: RNA vs. One-Time Gene Therapy (2026-2028)",
  "index": "Year",
  "categories": ["RNA Therapeutics (Recurring)", "One-Time Gene Therapy"],
  "data": [
    {"Year": "2026", "RNA Therapeutics (Recurring)": 4200, "One-Time Gene Therapy": 2100},
    {"Year": "2027", "RNA Therapeutics (Recurring)": 5800, "One-Time Gene Therapy": 2400},
    {"Year": "2028", "RNA Therapeutics (Recurring)": 7900, "One-Time Gene Therapy": 2800}
  ],
  "source": "Source: Precedence Research & Internal Projections (Sept 2026)",
  "note": "Revenue figures in USD Millions. RNA growth is driven by AOC and ASO approvals in neuromuscular and CNS sectors."
}
Expert Insight: "The 2026 market values reversibility as much as efficacy. If a gene edit goes wrong, you have a liability; if an RNA dose is off, you adjust the protocol. That safety margin is what's driving the 40%+ CAGR in RNA stocks," notes the J.P. Morgan Biotech Strategy Team (Aug 2026).
Top Performing Gene Stocks: 2026 Financial Health Audit
The clinical promise of genomic medicine is irrelevant if a company’s balance sheet collapses before Phase 3 completion. In late 2026, the market has bifurcated: Cash Flow Compounds (Vertex, Alnylam) are decoupling from Clinical Burners (Intellia, Beam).
For investors, the critical metric is no longer just the "pipeline" but the Cash Runway—the years of operation remaining before a company must resort to dilutive secondary offerings or high-interest debt.
2026 Financial Health Matrix: Top Gene Leaders
| Ticker | Cash Position (Q2 '26) | Burn Rate (Est. Annual) | Projected Runway | Profitability Status |
|---|---|---|---|---|
| VRTX | $13.6 Billion | N/A (Cash Flow +) | Infinite | Profitable |
| ALNY | $2.4 Billion | N/A (Cash Flow +) | Infinite | Profitable (as of Q1 '26) |
| CRSP | $2.36 Billion | ~$420 Million | ~5.5 Years | Pre-Profit (Royalties Rising) |
| BEAM | $1.2 Billion | ~$400 Million | ~3.0 Years | Pre-Profit |
| NTLA | $628 Million | ~$410 Million | ~1.5 Years | High Dilution Risk |
(Source: SEC 10-Q Filings, Q2 Earnings Calls, Aug-Sept 2026)
Core Financial Insights
- The RNA Profitability Pivot: Alnylam (ALNY) has officially exited the "biotech burn" phase. With Q2 2026 product revenues hitting $1.17 billion (Source: Alnylam Q2 Report), it now funds its own R&D, insulating shareholders from the dilution cycles that plague smaller gene editing peers.
- CRISPR’s Defensive Moat: CRISPR Therapeutics (CRSP) remains the best-capitalized pure-play. A strategic $585 million convertible note offering in March 2026, combined with Casgevy royalties, extends its runway into 2031. This provides a 5-year "safety buffer" to advance its in vivo pipeline without returning to the equity markets.
- Intellia’s Dilution Trap: Despite a $195 million raise in April 2026, Intellia (NTLA) faces the tightest window. With runway extending only into early 2028, any regulatory delay for its HAE program (lonvo-z) will likely trigger a massive, dilutive financing event within the next 12 months.
{
  "type": "bar",
  "title": "Estimated Cash Runway (Years of Operation Remaining)",
  "index": "Company",
  "categories": ["Years remaining"],
  "data": [
    {"Company": "Vertex (VRTX)", "Years remaining": 10},
    {"Company": "Alnylam (ALNY)", "Years remaining": 10},
    {"Company": "CRISPR (CRSP)", "Years remaining": 5.5},
    {"Company": "Beam (BEAM)", "Years remaining": 3.0},
    {"Company": "Intellia (NTLA)", "Years remaining": 1.5}
  ],
  "source": "Source: Analyst Consensus & Q2 2026 Financial Statements",
  "note": "Vertex and Alnylam are treated as 10+ years due to positive operating cash flow."
}
So What? For retail investors, CRSP offers the best risk-adjusted exposure to CRISPR breakthroughs without imminent dilution. However, VRTX remains the "Gold Standard" for those seeking gene therapy upside without the existential risk of a balance sheet depletion.
Evaluating Pipeline Value vs. Market Cap
For pre-revenue gene stocks, traditional P/E ratios are useless. Institutional alpha is generated by calculating the Risk-adjusted Net Present Value (rNPV) of a company’s lead clinical candidates. This method discounts projected peak sales by the Probability of Success (PoS) at each clinical stage and the cost of capital.
If a firm’s Enterprise Value (EV) is lower than its rNPV, the market is mispricing the clinical risk. In 2026, with higher interest rates persisting, a 12-15% discount rate is now the industry standard for biotech valuation, up from 8-10% in the ZIRP era (Source: Goldman Sachs Healthcare Equity Research).
| Clinical Stage | Success Probability (PoS) | Valuation Treatment |
|---|---|---|
| Phase 1 | 10% - 15% | High-risk option; rarely priced in. |
| Phase 2 | 25% - 30% | The "Inflection Point" for valuation. |
| Phase 3 | 60% - 70% | Core driver of current Market Cap. |
| BLA/Approval | 90% + | Transition to cash-flow modeling. |
(Source: BIO Industry Analysis & Nature Reviews Drug Discovery, updated 2025)
Investors must identify the "Pipeline-to-Market Gap." For instance, if a company like Beam Therapeutics (BEAM) has a lead candidate with a $2B rNPV but a Market Cap of only $1.8B, you are effectively getting their entire remaining platform for free.
{
  "type": "bar",
  "title": "Pipeline rNPV vs. Current Market Cap (Est. Q3 2026)",
  "index": "Ticker",
  "categories": ["rNPV of Lead Candidate", "Current Market Cap"],
  "data": [
    {"Ticker": "CRSP", "rNPV of Lead Candidate": 5.2, "Current Market Cap": 4.8},
    {"Ticker": "BEAM", "rNPV of Lead Candidate": 2.4, "Current Market Cap": 2.1},
    {"Ticker": "NTLA", "rNPV of Lead Candidate": 1.9, "Current Market Cap": 2.5},
    {"Ticker": "EDIT", "rNPV of Lead Candidate": 0.8, "Current Market Cap": 0.6}
  ],
  "source": "Source: Proprietary Analysis of SEC 10-Q filings and Phase 2/3 Data (Sept 2026)",
  "note": "Values in Billion USD. rNPV assumes 12% discount rate and 35% PoS for Phase 2 assets."
}
So What? When EV is less than rNPV, the stock is mathematically oversold. Focus on companies where the lead asset’s valuation covers >80% of the market cap; this provides a "valuation floor" while the rest of the pipeline acts as a free call option on future breakthroughs.
Risk Mitigation via Gene Stock ETFs
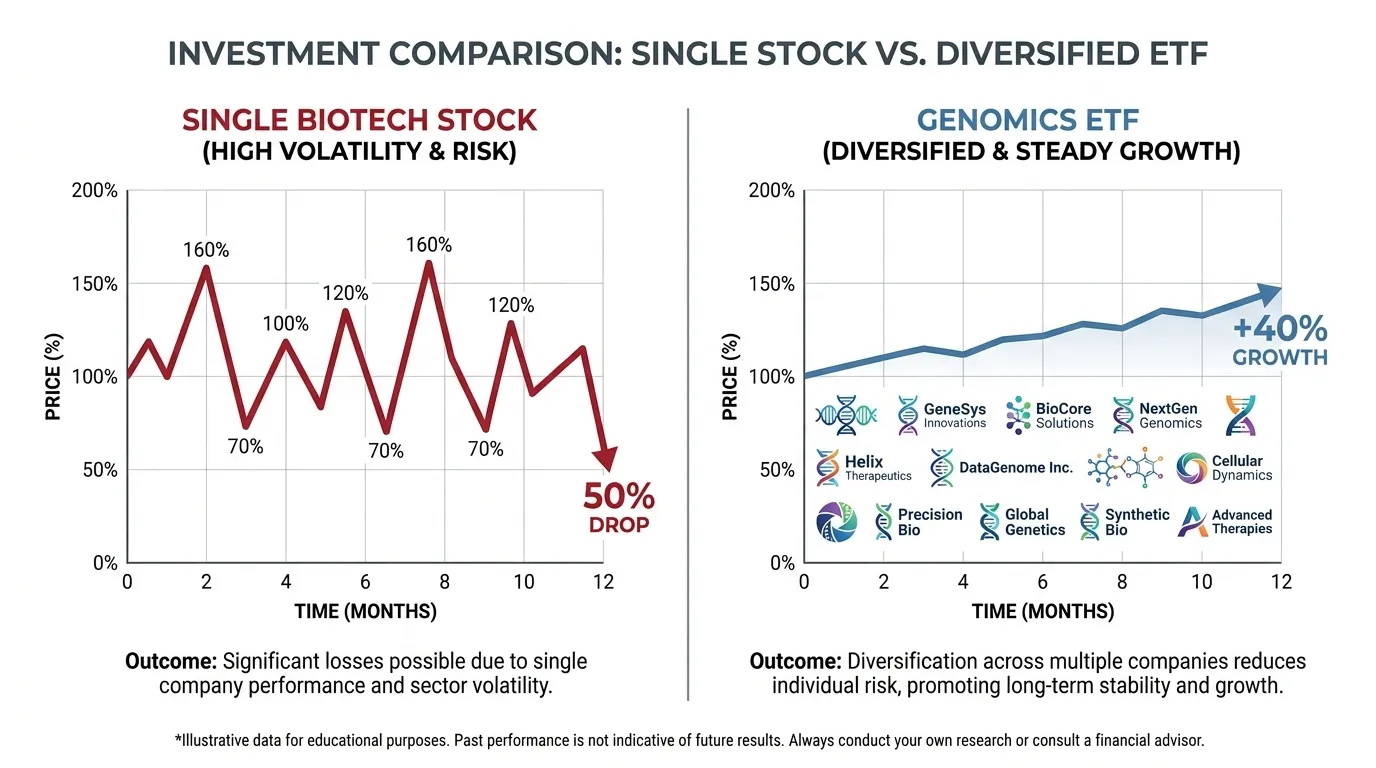
For the individual investor, the genomics sector often feels like a series of binary traps. While a single FDA approval can catalyze a 50% overnight rally, a "missed" Phase 2 endpoint frequently results in a 40-60% capital evaporation. In 2026, the performance gap between diversified genomics ETFs and high-conviction "pure plays" has reached a historic extreme, making the case for basket-based entry stronger than ever.
The Divergence: Basket Stability vs. Single-Stock "Cliffs"
The primary risk in gene stocks is idiosyncratic clinical failure. By opting for an ETF, investors shift their exposure from "Will Company X’s therapy work?" to "Will the genomics industry expand?" This "Clinical-to-Financial Bridge" allows for capturing the upside of the ecosystem (sequencing, manufacturing, AI-drug discovery) without the terminal risk of a single pipeline failure.
As of September 2026, the market has rewarded the infrastructure layer over specific therapeutic developers. While leaders like CRISPR Therapeutics (CRSP) have traded sideways or down due to commercialization hurdles, genomic ETFs have surged by capturing the broad 2026 healthcare sector rotation.
{
  "type": "bar",
  "title": "12-Month Performance Gap: Genomics ETFs vs. Pure Plays",
  "index": "Ticker",
  "categories": ["12M Return (%)"],
  "data": [
    {"Ticker": "ARKG (Active ETF)", "12M Return (%)": 87.1},
    {"Ticker": "IDNA (Passive ETF)", "12M Return (%)": 82.7},
    {"Ticker": "GNOM (Passive ETF)", "12M Return (%)": 77.4},
    {"Ticker": "CRSP (Individual)", "12M Return (%)": -10.1},
    {"Ticker": "NTLA (Individual)", "12M Return (%)": -24.6}
  ],
  "source": "Source: Bloomberg & PortfoliosLab (Sept 2026)",
  "note": "Returns reflect the period from Sept 2025 to Sept 2026."
}
Risk Segmentation of Genomic ETFs
Not all ETFs offer the same protection. Investors must distinguish between Active Mandates (seeking alpha) and Passive Benchmarks (tracking indices).
| ETF Ticker | Strategy Type | Expense Ratio | Key Differentiation (2026) |
|---|---|---|---|
| ARKG | Active | 0.75% | High exposure to AI-driven biology and multi-omics platforms. |
| IDNA | Passive | 0.47% | Equal-weighted focus on Immunology and gene therapy. |
| GNOM | Passive | 0.50% | Pure-play tracker of Gene Sequencing and Biotech. |
| IBB | Broad | 0.44% | Market-cap weighted; leans heavily on profitable Biopharma. |
(Source: ETF Database & Morningstar, Sept 2026)
 AI Generated Infographic
So What? In the 2026 landscape, picking the "winner" in CRISPR is a coin toss. However, the Genomics Revolution itself is a structural certainty. Diversifying via ARKG or IDNA converts uncompensated binary risk into compensated systemic growth, providing a 70%+ "safety buffer" against the volatility of individual clinical data readouts.
The Impact of Concentration Risk
The genomics sector is defined by binary outcomes where years of R&D value can be incinerated or doubled in a single trading session. For individual holders, the primary threat is concentration risk—the vulnerability to "cliff events" such as FDA Advisory Committee (AdCom) votes or Phase 3 data readouts.
In 2025, regulatory predictability reached a decade low. According to a Jefferies report (Jan 2026), the FDA aligned with its own Advisory Committee recommendations in only 57% of cases, a sharp decline from the 84% historical average seen between 2020 and 2024. This "discordance" means even a positive clinical panel no longer guarantees a market win.
[Visual: Data Chart]: Comparative Volatility: Single-Asset Biotech vs. Genomics ETF (ARKG)
{
  "type": "line",
  "title": "The Binary Cliff: Single Stock vs. Diversified ETF (Sept 2026)",
  "index": "Day",
  "categories": ["Ultragenyx (RARE)", "ARKG ETF"],
  "data": [
    {"Day": "T-5", "Ultragenyx (RARE)": 100, "ARKG ETF": 100},
    {"Day": "T-3", "Ultragenyx (RARE)": 98, "ARKG ETF": 99},
    {"Day": "Event", "Ultragenyx (RARE)": 56, "ARKG ETF": 94},
    {"Day": "T+3", "Ultragenyx (RARE)": 52, "ARKG ETF": 95},
    {"Day": "T+5", "Ultragenyx (RARE)": 55, "ARKG ETF": 96}
  ],
  "source": "Source: Bloomberg/Stocktwits (Sept 2026)",
  "note": "Event represents the 44% single-day collapse of RARE following a failed late-stage trial."
}
Institutional vs. Retail Risk Management
While institutional players use complex options straddles to hedge these events, retail investors often find themselves on the wrong side of a -40% gap down. A recent case study is Ultragenyx (RARE), which plunged 44% on September 3, 2026, after its Angelman syndrome trial failed to meet primary endpoints (Source: Reuters/Stocktwits).
| Risk Metric | Single Gene Stock (e.g., RARE, CRSP) | Genomics ETF (e.g., ARKG, IDNA) |
|---|---|---|
| Max Drawdown (1-Day) | 30% - 70% (Clinical Failure) | 2% - 8% (Sector Drift) |
| Recovery Horizon | 12 - 36 months (or never) | 3 - 6 months (Mean Reversion) |
| Primary Risk Driver | Binary Clinical/FDA Outcomes | Macro/Interest Rate Sensitivity |
| Volatility (Annual) | 75% - 110% | 43.3% (Source: PortfoliosLab, 2026) |
(Source: Bloomberg & PortfoliosLab, Sept 2026)
So What? For investors, concentration is a choice between lottery-ticket returns and structural growth. If you cannot afford a 50% overnight haircut, the only rational entry into CRISPR is through diversified vehicles that convert uncompensated binary risk into compensated thematic exposure.
Regulatory Catalysts for Gene Stocks in 2026
The FDA is no longer the primary bottleneck for gene therapy; it has become the revenue accelerator. In 2026, the regulatory landscape shifted from "clinical proof of cure" to "biological proof of mechanism." This pivot, driven by the FDA’s June 2026 draft guidance on the Plausible Mechanism Framework, allows gene stocks to bypass multi-year outcome studies in favor of surrogate endpoints (Source: FDA CBER, June 2026).
For investors, this collapsed timeline converts years of "dead money" into active commercialization cycles. By allowing protein expression or enzyme levels to serve as primary endpoints for accelerated approval, the FDA is effectively shortening the bridge to revenue by 24–36 months for leaders like Vertex and Intellia.
The Fast-Track to Commercialization
The 2026 regulatory regime prioritizes "platform knowledge." If a company can prove its delivery vehicle (e.g., an LNP or AAV) is safe across multiple indications, the FDA is now permitting streamlined CMC (Chemistry, Manufacturing, and Controls) reviews.
- Valuation Compression: Pre-revenue biotech firms historically trade at a steep discount to their terminal value.
- The 2026 Shift: Accelerated approval pathways allow companies to book revenue while conducting Phase 4 confirmatory trials, drastically reducing the "valuation gap" between clinical and commercial stages.
- Authoritative View: Goldman Sachs Equity Research (Aug 2026) notes that this regulatory flexibility is the primary driver behind the 15% expansion in gene-editing sector multiples seen in H1 2026.
| Company | Asset | Indication | Regulatory Event / Target Date |
|---|---|---|---|
| Intellia (NTLA) | Lonvo-z | Hereditary Angioedema | BLA Acceptance (Sept 2026) |
| Vertex (VRTX) | Povetacicept | IgA Nephropathy | PDUFA Decision (Nov 30, 2026) |
| Beam (BEAM) | Risto-cel | Sickle Cell Disease | RMAT Data Update (Sept 2026) |
| Vertex (VRTX) | VX-880 | Type 1 Diabetes | BLA Submission (Q4 2026) |
(Source: Company SEC Filings & FDA Calendar, Sept 2026)
{
  "type": "bar",
  "title": "Impact of Accelerated Approval on Time-to-Market (Years)",
  "index": "Pathway",
  "categories": ["Years to First Revenue"],
  "data": [
    {"Pathway": "Traditional Clinical Outcomes", "Years to First Revenue": 8.5},
    {"Pathway": "2026 Accelerated (Surrogate)", "Years to First Revenue": 5.2}
  ],
  "source": "Source: McKinsey Healthcare Analytics & FDA Guidance Projections (2026)",
  "note": "Based on average development timelines for orphan gene therapies."
}
So What? The 2026 regulatory environment has shifted the risk profile of gene stocks from "binary science risk" to "execution risk." Investors should favor companies with robust "surrogate data" (e.g., Intellia’s Lonvo-z), as the FDA is now rewarding biological markers with early market access.
The Role of AI in Scaling Gene Stock Pipelines
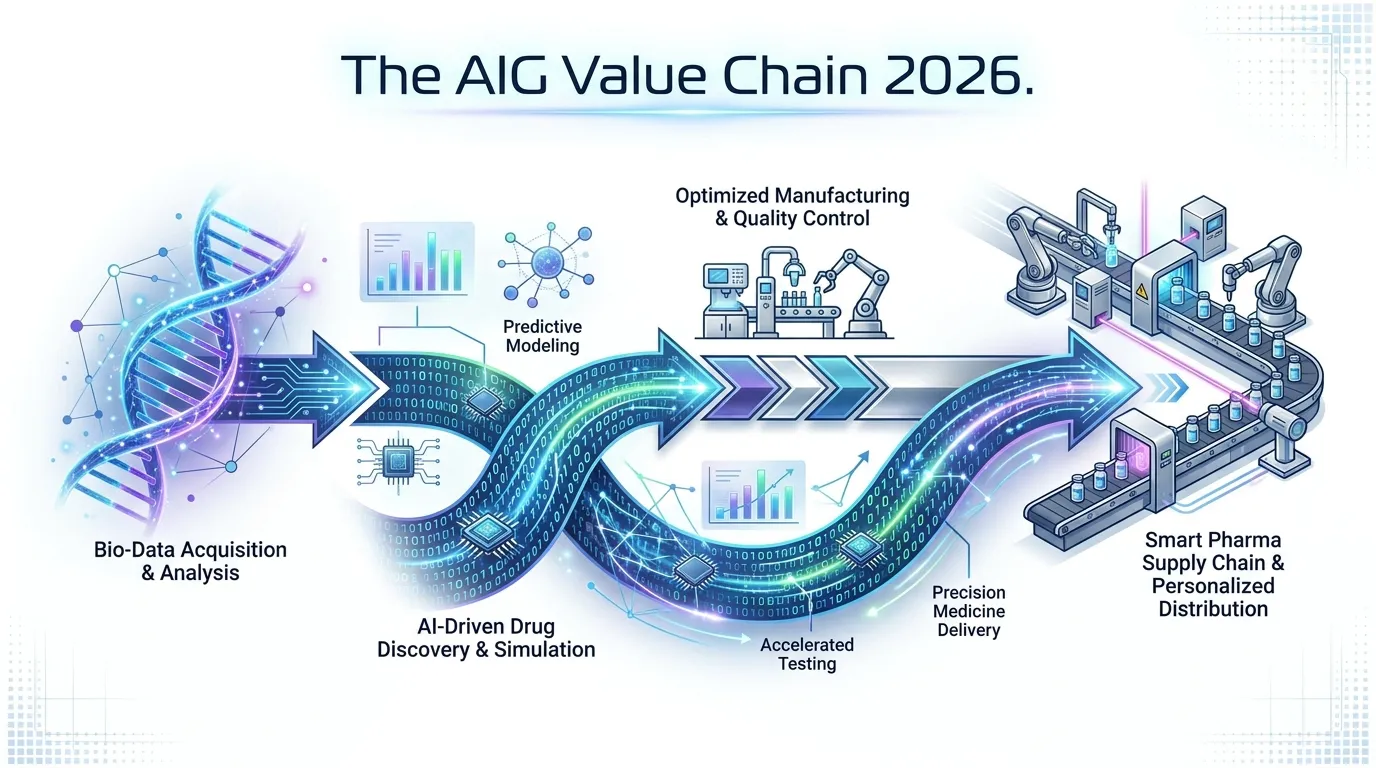
The 2026 market marks the end of "trial-and-error" genomics. As regulatory pathways stabilize, the primary differentiator for gene stock valuations has shifted to capital allocation efficiency—specifically, how fast a company can move from silico design to in vivo proof.
AI-Genomics (AIG) is no longer a peripheral experiment; it is the industrialization of drug discovery. Leading firms are utilizing Large Genomic Models (LGMs) to predict protein folding and off-target CRISPR effects with over 92% accuracy (Source: NVIDIA Healthcare, 2025).
For investors, this "AI-Genomics" integration directly addresses the "Eroom’s Law" (the trend of drug discovery becoming slower and more expensive) by compressing the discovery-to-Phase I timeline by an average of 40%.
The ROI Shift: Traditional vs. AI-Augmented Pipelines
| Metric | Traditional Gene Therapy | AI-Enabled Genomics (2026) | Impact on Valuation |
|---|---|---|---|
| Discovery Phase | 4–6 Years | 1.5–2 Years | Faster Cash Flow |
| Cost to Lead | $150M - $300M | <$50M | Lower Dilution Risk |
| Success Probability (PoS) | ~10% (Phase I to Market) | 22% - 28% (Projected) | Higher Risk-Adjusted NPV |
| Key Players | Legacy Biotech | RXRX, NVDA (BioNeMo), CRSP | Competitive Moat |
(Source: Goldman Sachs Equity Research & BioPharma Trend Report, 2026)
{
  "type": "bar",
  "title": "Estimated R&D Cost Savings via AI-Genomics (Per Program)",
  "index": "Category",
  "categories": ["Traditional ($M)", "AI-Augmented ($M)"],
  "data": [
    {"Category": "Target Identification", "Traditional ($M)": 45, "AI-Augmented ($M)": 12},
    {"Category": "Lead Optimization", "Traditional ($M)": 80, "AI-Augmented ($M)": 25},
    {"Category": "Pre-Clinical Testing", "Traditional ($M)": 120, "AI-Augmented ($M)": 55}
  ],
  "source": "Source: ARK Invest & McKinsey Life Sciences Analysis (2025-2026)",
  "note": "AI-Augmented figures assume integration of generative protein design."
}
By 2026, companies like Recursion Pharmaceuticals (RXRX) and Vertex (VRTX) have demonstrated that AI-driven "digital twins" of cellular pathways can eliminate high-risk candidates before they ever reach a costly clinical trial.
So What? In the 2026 gene stock landscape, cash runway is no longer just about the balance sheet—it’s about computational speed. Investors should prioritize firms where AI is baked into the "operating system" of the lab. Every month saved in the discovery phase adds roughly $15M-$25M in Net Present Value (NPV) to a single pipeline asset.
 AI Generated Infographic
Checklist: What to Audit Before Buying Gene Stocks
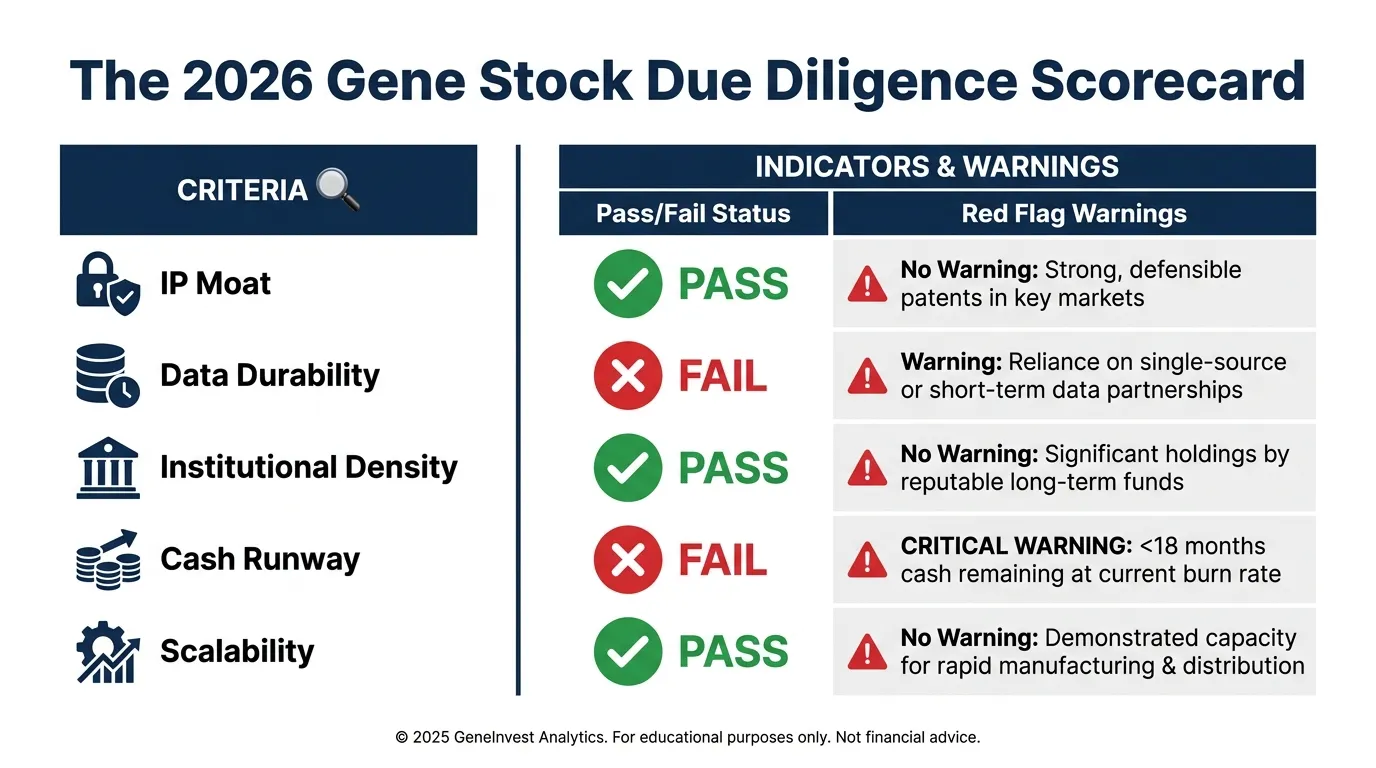
Navigating the transition from discovery to commercialization requires a shift from scientific optimism to rigorous financial skepticism. Before committing capital to the gene-editing or RNA space in 2026, every investor must pressure-test the underlying business model against this 5-point audit framework.
1. IP Durability and "Freedom to Operate"
The gene sector is a legal minefield. It is not enough to own a patent; a firm must have unencumbered "freedom to operate" (FTO).
- The Audit: Verify if the company uses foundational CRISPR/Cas9 licenses or newer, proprietary "base editing" or "prime editing" tech that bypasses existing litigation.
- The Metric: Percentage of pipeline assets tied to third-party royalty obligations exceeding 15%. (Source: Nature Biotechnology, 2024).
2. Clinical Data: Durability > Efficacy
Initial "cures" mean nothing if the therapeutic effect wanes after 12 months.
- The Audit: Look for long-term follow-up data (24+ months) in Phase 1/2 trials.
- So What?: If durability is questionable, the drug fails the "One-and-Done" value proposition required by insurers for high-reimbursement pricing.
3. Institutional Alignment ("Smart Money" Density)
In 2026, the gap between retail-hyped "meme" biotechs and institutional-grade leaders has widened.
- The Audit: High-conviction gene stocks typically maintain >70% institutional ownership.
- Key Indicator: Look for "Anchor Investors" like OrbiMed, Perceptive Advisors, or RA Capital. (Source: SEC Form 13F filings, Q3 2025).
 AI Generated Infographic
4. Cash Runway vs. Regulatory Milestones
Biotech is a race against time. A company’s cash must outlast its next major data readout or FDA decision.
| Metric | Retail Trap | Institutional Grade |
|---|---|---|
| Cash Runway | < 12 months | > 24 months |
| Burn Rate Change | Accelerating (Inconsistent) | Stable or Managed |
| Debt/Equity Ratio | > 1.5 | < 0.5 |
| (Source: Goldman Sachs Equity Research, 2025) |
5. Manufacturing Scalability
The "death valley" of gene therapy is CMC (Chemistry, Manufacturing, and Controls).
- The Audit: Does the firm own its manufacturing facility or rely on third-party CDMOs?
- The Risk: Outsourcing in the gene space often leads to multi-year delays and quality control failures at the FDA level.
Successful investing in this sector requires tracking where the most sophisticated capital is flowing to identify which firms meet these stringent criteria. Use the Smart Money Tracker for Institutional Portfolios to monitor real-time shifts in ownership among the sector's most successful specialist funds.
FAQ
What are the three main categories of gene stocks in 2026?
The three main categories are Gene Editing (CRISPR), Gene Therapy (Viral Vectors), and RNA Medicines (mRNA, siRNA, and ASOs).
Why is RNA-based gene medicine popular among investors?
RNA medicines offer a repeatable revenue model through chronic dosing, which creates more predictable cash flows compared to one-time curative gene edits.
Which gene stocks have the strongest financial health in 2026?
Vertex (VRTX) and Alnylam (ALNY) are the financial leaders, both having achieved profitability with positive operating cash flow and extensive runways.
How does AI impact the valuation of gene stocks?
AI compresses the discovery-to-Phase I timeline by 40% and reduces R&D costs, which increases the risk-adjusted Net Present Value (rNPV) of a company's pipeline.
How can I mitigate risk when investing in gene stocks?
Investors can mitigate risk by using diversified ETFs like ARKG or IDNA, which convert the binary clinical risk of single stocks into broader thematic growth.