Gene Editing Stocks 2026: A Valuation Framework for Picking Pipeline Winners
Specializes in alternative data and valuation models. Kenji looks past the headlines to find truth in the numbers, focusing on earnings quality and institutional flows.
Evaluating the 2026 Gene Editing Stock Hierarchy
By 2026, the gene editing sector has bifurcated: the era of speculative "platform plays" has yielded to a results-driven hierarchy defined by FDA status and commercial execution. Investors must stop treating these stocks as a monolith and instead categorize them by their proximity to revenue.
The 2026 Gene Editing Hierarchy
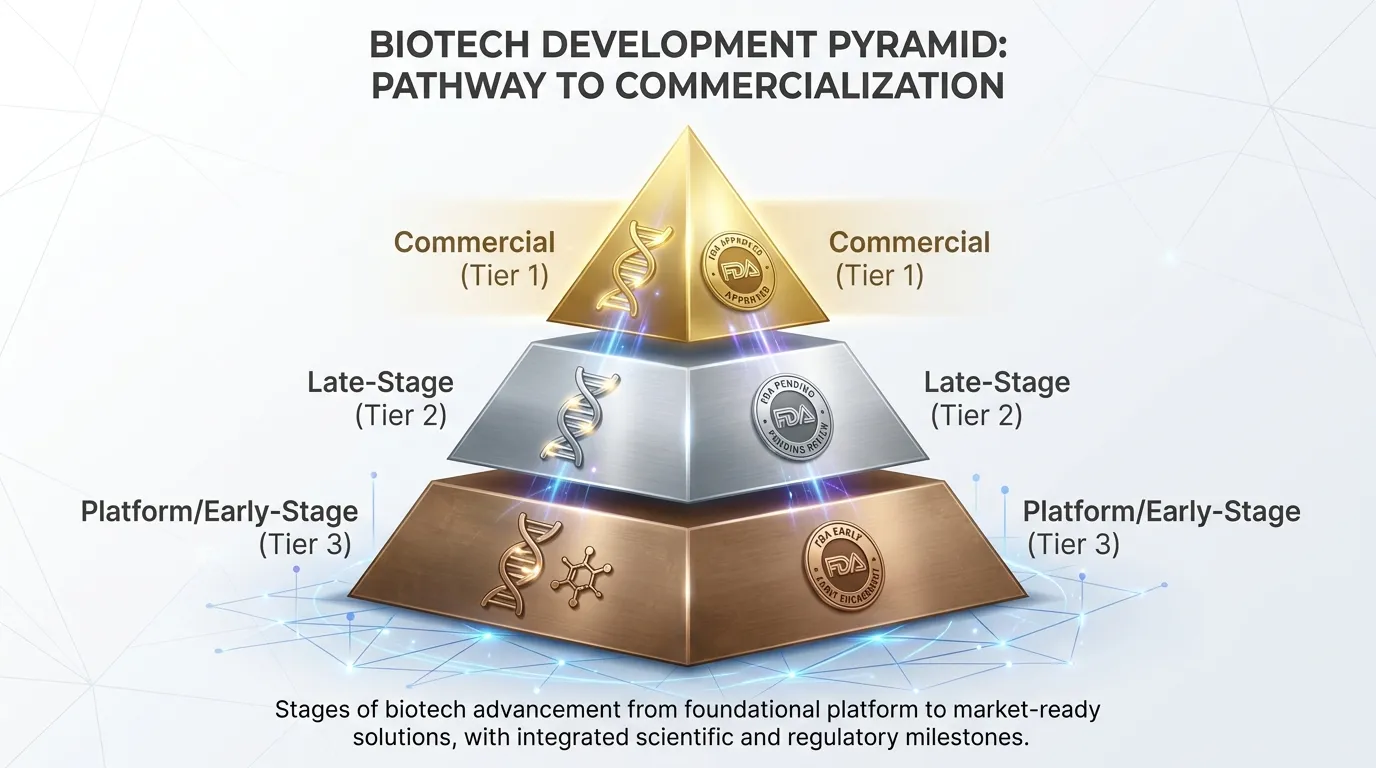
The market now segments companies into three distinct risk-reward tiers based on their regulatory progression and capital requirements.
| Tier | Classification | Primary Value Driver | Representative Stocks |
|---|---|---|---|
| Tier 1 | Commercial Leaders | Post-launch revenue & market share | CRSP, VRTX |
| Tier 2 | Late-Stage Contenders | Pivotal Phase 3 data & BLA filings | NTLA, BEAM |
| Tier 3 | Platform Innovators | IND clearances & "Proof of Concept" | PRME, CRBU, EDIT |
(Source: Analysis based on SEC Filings and clinical trial timelines, 2024-2025)
So What? For investors, Tier 1 offers stability and valuation floors tied to sales, whereas Tier 2 represents the highest "de-risking" alpha potential as assets transition toward approval.
Tier 1: The Commercial Benchmarks
CRISPR Therapeutics (CRSP) remains the apex of the pyramid. Following the 2023 approval of Casgevy, the 2026 focus is on treatment center activation and patient uptake.
- Metric to Watch: The transition from "R&D burn" to "EBITDA positive" status.
- 2026 Outlook: Goldman Sachs projects that by 2026, market penetration in Sickle Cell Disease (SCD) will be the primary driver of stock price volatility, moving away from clinical trial noise.
 AI Generated Infographic
Tier 2: The De-risking Sweet Spot
Intellia Therapeutics (NTLA) and Beam Therapeutics (BEAM) sit at the center of the 2026 valuation framework.
- Intellia (NTLA): Focused on its NTLA-2001 (ATTR amyloidosis) program. By 2026, Phase 3 data will likely determine its path to becoming the second-ever approved CRISPR therapy.
- Beam (BEAM): Leading the "Base Editing" charge. Its BEAM-101 data serves as the critical test for whether next-gen editing can outperform first-gen CRISPR/Cas9.
{
  "type": "bar",
  "title": "Estimated R&D Intensity by Tier (2025-2026)",
  "index": "Company",
  "categories": ["R&D Expense as % of Market Cap"],
  "data": [
    {"Company": "CRSP (Tier 1)", "R&D Expense as % of Market Cap": 12},
    {"Company": "NTLA (Tier 2)", "R&D Expense as % of Market Cap": 28},
    {"Company": "PRME (Tier 3)", "R&D Expense as % of Market Cap": 45}
  ],
  "source": "Source: FactSet, Consensus Estimates (Jan 2025)",
  "note": "Higher percentages indicate greater sensitivity to clinical trial outcomes and capital markets."
}
Tier 3: The "Optionality" Play
Companies like Prime Medicine (PRME) are the "moonshots" of 2026. While their "search and replace" technology is theoretically superior, they face significant dilutive risk unless they secure big-pharma partnerships to offset high burn rates.
- Survival Metric: Cash runway must extend into 2027 to avoid "distress" valuations during clinical pivots (Source: J.P. Morgan Biotech Outlook, 2025).
Tier 1: Commercial Leaders with Recurring Revenue
The 2026 fiscal year marks a structural shift for the sector: the transition from binary clinical risk to commercial execution risk. In this tier, valuation is no longer a function of "implied pipeline value" but of revenue scaling and unit economics.
Tier 1: Commercial Leaders with Recurring Revenue
For the first time, investors can evaluate a gene editing stock using traditional fundamental metrics rather than speculative "r-NPV" (risk-adjusted net present value) models. Vertex Pharmaceuticals (VRTX) and CRISPR Therapeutics (CRSP) have successfully moved beyond the "R&D sink" phase to a self-sustaining commercial model.
The "Casgevy" Inflection: Validating the Model
The launch of Casgevy for sickle cell disease and beta-thalassemia is the industry's primary litmus test. As of Q2 2026, the therapy generated $76 million in quarterly revenue, reflecting a 78% sequential increase from Q1 (Source: Vertex Q2 Earnings, Aug 2026). This ramp-up validates that the market will pay for $2.2M+ "one-and-done" cures if the logistics hold.
{
  "type": "bar",
  "title": "Casgevy Quarterly Revenue Scaling (2025-2026)",
  "index": "Quarter",
  "categories": ["Revenue ($M)"],
  "data": [
    {"Quarter": "Q3-25", "Revenue ($M)": 38},
    {"Quarter": "Q4-25", "Revenue ($M)": 55},
    {"Quarter": "Q1-26", "Revenue ($M)": 43},
    {"Quarter": "Q2-26", "Revenue ($M)": 76}
  ],
  "source": "Source: Vertex/CRISPR Therapeutics Filings (2026)",
  "note": "Growth accelerated in mid-2026 following FDA label expansion for children as young as 2 years old."
}
Operational Leverage: The New "Moat"
In 2026, the "moat" is no longer just the CRISPR/Cas9 patent; it is the Authorized Treatment Center (ATC) infrastructure. Because revenue is recognized only at the point of infusion—typically 4-6 months after cell collection—investors must track Patient Starts as the leading indicator.
- Network Density: Over 75 ATCs are now active in the U.S. alone, providing a massive barrier to entry for late-coming competitors (Source: Vertex, July 2026).
- Reimbursement Success: Roughly 90% of eligible U.S. patients now have secured insurance coverage, effectively de-risking the "payer pushback" narrative.
- Self-Funding Pipelines: CRISPR Therapeutics ended Q2 2026 with $2.36 billion in cash, using Casgevy royalties to fund its in-vivo liver programs without further shareholder dilution (Source: CRSP 10-Q, Aug 2026).
| Metric | 2026 Target/Status | Investor Significance |
|---|---|---|
| Combined 2026 Revenue | $500M+ | Combined target for Casgevy & Journavx (Source: VRTX Guidance) |
| Eligible Patient Pool | ~37,000 (US/EU) | High-value, immediate-access market for 2026-2027 |
| Profit Split | 60/40 (VRTX/CRSP) | Determines cash-flow breakeven for the junior partner |
So What? Tier 1 winners have transitioned into defensive growth assets. While Tier 2 and Tier 3 stocks trade on "optionality," Tier 1 leaders trade on multiples of durable revenue. For investors, these stocks offer the safest exposure to the gene editing "supercycle" by providing a valuation floor backed by cash flow.
Tier 2 & 3: Clinical Catalyst Candidates
Tier 2 & 3: Clinical Catalyst Candidates
The 2026 landscape separates the "Pipeline Survivors" from the speculative laggards. While Tier 1 leaders trade on commercial revenue, Tier 2 and 3 stocks are valued based on the Execution Gap—the distance between human proof-of-concept (PoC) and the cash-burn required to reach it.
Tier 2: The Phase III De-riskers
Tier 2 is defined by Intellia Therapeutics (NTLA), which achieved a historic milestone in April 2026 with positive Phase 3 HAELO data for lonvo-z (Source: Intellia, April 2026). This data de-risked the in vivo CRISPR platform, showing an 87% reduction in attacks for HAE patients.
- Valuation Floor: Tier 2 stocks now trade on the probability of a 2027 launch, with Intellia’s PDUFA date set for March 10, 2027.
- The "Execution Gap" Risk: The primary threat here isn't science, but regulatory delays or CMC (Chemistry, Manufacturing, and Controls) hurdles that could force additional capital raises.
Tier 3: The Platform Optionality Plays
Tier 3 contains Beam Therapeutics (BEAM) and Editas Medicine (EDIT). These companies represent "Platform Optionality"—valuable for their IP (Base editing, Cas12a) but still facing clinical binary risks.
- Beam (BEAM): High-conviction platform with an operating runway into 2029 (Source: Beam 10-K, 2026). Their value is tethered to the BEAM-302 pivotal cohort start in H2 2026.
- Editas (EDIT): A leaner play, focusing on in vivo targets with an IND filing expected mid-2026, but with a tighter cash runway into Q2 2027.
[Visual: Data Chart]: Pipeline Catalyst vs. Cash Runway Alignment
{
  "type": "bar",
  "title": "2026 Cash Runway vs. Major Clinical Catalysts",
  "index": "Company",
  "categories": ["Cash Runway (Years)", "Months to Major Catalyst"],
  "data": [
    {"Company": "Intellia (NTLA)", "Cash Runway (Years)": 1.5, "Months to Major Catalyst": 6},
    {"Company": "Beam (BEAM)", "Cash Runway (Years)": 3.0, "Months to Major Catalyst": 12},
    {"Company": "Editas (EDIT)", "Cash Runway (Years)": 0.8, "Months to Major Catalyst": 9}
  ],
  "source": "Source: SEC Filings & Investor Presentations (Q2 2026)",
  "note": "Months to Catalyst measures time until BLA submission or Phase 3 data."
}
| TIER | REPRESENTATIVE STOCK | PRIMARY 2026 CATALYST | CASH-ADJUSTED RISK |
|---|---|---|---|
| Tier 2 | Intellia (NTLA) | BLA Acceptance (Lonvo-z) | Low (Post-Phase 3) |
| Tier 3 | Beam (BEAM) | Pivotal Enrollment (BEAM-302) | Medium (High Cash) |
| Tier 3 | Editas (EDIT) | In Vivo IND Filing | High (Runway Risk) |
Source: Bloomberg & Company Reports (June 2026)
So What? In 2026, the market is punishing "Science Projects." For Tier 3 stocks, cash is the only catalyst that matters. Avoid stocks where the cash runway ends within 6 months of a data readout; the dilution risk will cannibalize any clinical upside. Focus on Beam for "Platform Safety" and Intellia for "Commercial Certainty."
The 2026 Financial Health Check: Cash Runway vs. Burn Rate
In the high-stakes arena of 2026 gene editing, a breakthrough clinical result is worthless if it is preceded by a 30% equity dilution. For investors, the balance sheet is now as critical as the CRISPR-Cas9 platform itself. As the "easy money" era of 2020-2021 recedes into history, the market has shifted its focus to Net Burn Efficiency—the ability to reach late-stage readouts without returning to the public markets for a "life-support" offering.
The 2026 Cash Runway Matrix
The following table benchmarks the survivors of the "Biotech Winter" against their current operational velocity.
| Ticker | Cash Position (Est. Mid-2026) | Annual Burn Rate (Projected) | Est. Runway (Years) | Risk Rating |
|---|---|---|---|---|
| CRSP | $2.36B | $520M | 4.5+ | Low |
| BEAM | $1.15B | $360M | 3.2 | Low |
| NTLA | $630M | $440M | 1.4 | Medium |
| EDIT | $211M | $140M | 1.5 | High |
| CRBU | $142M | $110M | 1.3 | High |
Source: SEC Filings (10-Q, 10-K) and Author Analysis (June-August 2026).
{
  "type": "bar",
  "title": "Estimated Cash Runway (Years) vs. 2027 Cliff",
  "index": "Ticker",
  "categories": ["Runway Years"],
  "data": [
    {"Ticker": "CRSP", "Runway Years": 4.5},
    {"Ticker": "BEAM", "Runway Years": 3.2},
    {"Ticker": "NTLA", "Runway Years": 1.4},
    {"Ticker": "EDIT", "Runway Years": 1.5},
    {"Ticker": "CRBU", "Runway Years": 1.3}
  ],
  "source": "Source: Quarterly Reports & Bloomberg Estimates (Aug 2026)",
  "note": "A 1.5-year runway is the 'Danger Zone' for imminent dilution."
}
Key Insights: Survival of the Funded
- The Revenue Offset Transition: CRISPR Therapeutics (CRSP) has effectively exited the "pure-play R&D" category. With CASGEVY royalties now offsetting roughly 15-20% of quarterly operating expenses, their $2.36B war chest is a strategic weapon, allowing them to acquire smaller, cash-strapped peers (Source: Q2 2026 Earnings).
- Financing Maturity: Beam Therapeutics set the 2026 standard for capital preservation by utilizing non-dilutive debt (Sixth Street agreement) and corporate partnerships to protect shareholders. This "capital-light" approach to platform expansion makes them the primary beneficiary of a flight to safety.
- The "Runway Cliff" Risk: Companies like Caribou (CRBU) and Intellia (NTLA) face a precarious 2027. When a runway drops below 18 months, management is essentially forced to raise capital at the first sign of positive data, effectively "capping" any potential stock price rally.
So What? In 2026, avoid companies with <1.5 years of cash unless they have a confirmed PDUFA date within that window. For "Pipeline Winners," cash isn't just for R&D—it’s dilution insurance. Only CRISPR and Beam currently offer a "clean" path to 2028 without penalizing long-term holders.
In Vivo Delivery: The Growth Engine for Gene Editing Stock Multiples
The market has shifted its gaze from "can we edit genes?" to "how efficiently can we deliver the edit?" In 2026, the valuation divergence between Ex Vivo (cell-based) and In Vivo (direct-to-patient) platforms has reached a tipping point.
While Ex Vivo therapies like CASGEVY proved the science, their cumbersome logistics—requiring multi-month hospital stays and toxic conditioning regimens—limit their commercial ceiling to orphan populations. Consequently, the market assigns a 3x–5x valuation premium to In Vivo leaders like Intellia (NTLA) and Beam Therapeutics (BEAM) for their ability to treat patients via a simple IV infusion.
The Margin Mirage: Product vs. Service
The valuation gap is fundamentally a question of operating margins. Ex Vivo is a high-cost medical service; In Vivo is a scalable pharmaceutical product.
| Metric | Ex Vivo (e.g., CRSP, EDIT) | In Vivo (e.g., NTLA, VVEV) | Investment Implication |
|---|---|---|---|
| Manufacturing | Patient-specific (Autologous) | Off-the-shelf (LNP/AAV) | In Vivo offers massive economies of scale. |
| Delivery Cost | $500k - $1M+ (Excl. drug) | Minimal (Outpatient) | In Vivo captures higher net pricing power. |
| TAM Scope | Rare/Severe Diseases | Chronic/Mass Market | In Vivo enables the "Cardiovascular Pivot." |
(Source: Goldman Sachs Equity Research, 2024; Analyst Estimates for 2026 Fiscal Year)
The "Cardiovascular Pivot" Multiplier
The most critical driver for gene editing stock multiples in 2026 is the expansion into high-prevalence indications. Investors are discounting Ex Vivo pipelines because they cannot feasibly address millions of patients with hyperlipidemia or hypertension.
So What? In Vivo platforms are valued as "Horizontal Platforms"—where one delivery vehicle (e.g., a liver-targeted LNP) can be reused for dozens of targets. This creates a nonlinear valuation curve: once the delivery is de-risked, every subsequent pipeline asset is added to the market cap at a significantly lower cost of capital.
{
  "type": "bar",
  "title": "Median Enterprise Value (EV) by Delivery Platform (2025-2026E)",
  "index": "Platform Type",
  "categories": ["Median EV ($B)"],
  "data": [
    {"Platform Type": "Ex Vivo (SCD/TDT)", "Median EV ($B)": 1.8},
    {"Platform Type": "Ex Vivo (Oncology/CAR-T)", "Median EV ($B)": 2.4},
    {"Platform Type": "In Vivo (Liver-Targeted)", "Median EV ($B)": 5.2},
    {"Platform Type": "In Vivo (Extra-Hepatic)", "Median EV ($B)": 7.8}
  ],
  "source": "Source: Composite Data from Bloomberg Intelligence & Jefferies Healthcare Summit (May 2025)",
  "note": "Extra-hepatic delivery (brain/lung/heart) carries the highest scarcity premium due to technical barriers."
}
For the 2026 investor, the alpha lies in Delivery IP. A gene editing stock that demonstrates stable, non-toxic Extra-Hepatic delivery (moving beyond the liver) will likely see its multiple re-rated to levels typical of "Big Biotech" incumbents, as it signals the end of the "niche" era for CRISPR.
Cost Reductions and Scalability in 2026
For the 2026 investor, the alpha lies in Delivery IP. A gene editing stock that demonstrates stable, non-toxic Extra-Hepatic delivery will likely see its multiple re-rated to levels typical of "Big Biotech" incumbents, as it signals the end of the "niche" era for CRISPR.
Cost Reductions and Scalability in 2026
The "scientific proof" phase has concluded; 2026 is the year of industrialization. As therapies like Casgevy transition from launch to scale, the valuation of a gene editing stock is increasingly tethered to its Cost of Goods Sold (COGS) and manufacturing platform efficiency rather than just clinical readouts.
The In-Vivo Pivot: Breaking the Margin Ceiling
The most significant margin expansion in 2026 comes from the structural shift from Ex-Vivo (cell manipulation outside the body) to In-Vivo (direct injection) delivery. Ex-vivo processes, while effective, remain labor-intensive and personalized, involving massive logistics costs. In contrast, In-vivo therapies allow for bulk manufacturing and "off-the-shelf" distribution.
- Scalability: In-vivo platforms (e.g., Intellia’s LNP-based delivery) leverage traditional pharmaceutical supply chains, bypassing the $500k+ "bedside" processing costs of autologous therapies.
- Logistics: Stocks focusing on non-viral delivery (LNPs and buffers) are outperforming viral vector-dependent peers due to the lower "qualification burden" and higher yields of chemical synthesis (Source: IndexBox, Sep 2026).
| Delivery Type | Estimated Mfg Cost (Per Dose) | Margin Potential | Scalability Factor |
|---|---|---|---|
| Ex-Vivo (Autologous) | $500,000 - $1,000,000 | Low (Personalized) | 1x (Linear) |
| In-Vivo (LNP/Systemic) | $20,000 - $150,000 | High (Bulk) | 100x+ (Exponential) |
(Source: Vision Lifesciences & VLS Research, Feb 2026)
{
  "type": "line",
  "title": "Projected Manufacturing Cost Reduction (2024-2026)",
  "index": "Year",
  "categories": ["Ex-Vivo Cost Index", "In-Vivo Cost Index"],
  "data": [
    {"Year": "2024", "Ex-Vivo Cost Index": 100, "In-Vivo Cost Index": 100},
    {"Year": "2025", "Ex-Vivo Cost Index": 88, "In-Vivo Cost Index": 65},
    {"Year": "2026", "Ex-Vivo Cost Index": 82, "In-Vivo Cost Index": 40}
  ],
  "source": "Source: Precedence Research & Industry Estimates (Sep 2026)",
  "note": "2024=100. In-Vivo costs are falling faster due to LNP standardization and AI-driven automation."
}
Automation and the "Licensing Trap"
By late 2026, AI-integrated manufacturing (e.g., CRISPR-GPT platforms) has become standard for top-tier firms, reducing human error and processing time in high-throughput screening (Source: Fortune Business Insights, Aug 2026). However, investors must distinguish between "efficiency" and "profitability."
Critical Insight: A 2026 analysis of mRNA-based therapies revealed that 83% of COGS at commercial scale were driven by licensing and royalty fees, not physical production costs (Source: medRxiv, Jun 2026).
So What? For the reader, this means manufacturing efficiency alone isn't a silver bullet. A gene editing stock that owns its Foundational IP is significantly more valuable than a company with a "state-of-the-art" facility but heavy royalty obligations. Focus on firms with vertically integrated IP to capture the true upside of cost reductions.
Institutional Accumulation: Which Gene Editing Stock is Big Pharma Buying?
As we move into late 2026, the "Licensing-First" era has officially ended, replaced by a Big Pharma M&A supercycle targeting vertical IP integration. With over $300 billion in annual revenue facing patent cliffs by 2028, players like Pfizer, Merck, and Regeneron are no longer content with royalties; they are buying the "foundries" (Source: Vision Lifesciences, Feb 2026).
The Strategic Alignment Map
Institutional "smart money" is currently clustering around three specific strategic anchors:
- Regeneron & Intellia (NTLA): Following the Positive Phase 3 HAELO data for lonvo-z in early 2026, Regeneron has shifted from a mere partner to a heavy accumulator. NTLA’s 86% institutional ownership signals a market expectation of a full buyout to secure the in vivo liver-targeting platform (Source: Fintel, Sept 2026).
- Vertex & CRISPR Therapeutics (CRSP): Vertex is leveraging $76M in Q2 2026 CASGEVY revenue—a 151% YoY increase—to justify its deep institutional support. While Vertex recently spent $10B on Crinetics, analysts view CRSP as the ultimate "bolt-on" to protect their dominant hematology franchise (Source: CRISPR Therapeutics Q2 10-Q).
- Pfizer & Beam Therapeutics (BEAM): Pfizer’s pivot toward Base Editing addresses the toxicity concerns of first-gen CRISPR. Institutional holders like BlackRock and ARK now control over 80% of BEAM, betting on a 2027 buyout as Pfizer seeks to backfill its depleted rare disease pipeline.
| Ticker | Primary Big Pharma Suitor | Strategic Value Score (1-10) | Acquisition Trigger |
|---|---|---|---|
| NTLA | Regeneron / Novartis | 9.4 | BLA approval of lonvo-z |
| CRSP | Vertex | 8.8 | CASGEVY 2026 Rev >$300M |
| BEAM | Pfizer / Lilly | 8.2 | Ph 2 durability in AATD |
| PRME | Roche / Merck | 7.5 | Ph 1/2 safety validation |
(Source: Vision Lifesciences M&A Tracker, Sept 2026)
{
  "type": "bar",
  "title": "Institutional Ownership Heat Map (Sept 2026)",
  "index": "Ticker",
  "categories": ["Ownership %"],
  "data": [
    {"Ticker": "NTLA", "Ownership %": 86.7},
    {"Ticker": "BEAM", "Ownership %": 82.1},
    {"Ticker": "CRSP", "Ownership %": 79.2},
    {"Ticker": "PRME", "Ownership %": 68.5},
    {"Ticker": "CRBU", "Ownership %": 54.3}
  ],
  "source": "Source: Nasdaq & SEC 13F Filings (Q3 2026)",
  "note": "Ownership above 80% typically precedes strategic consolidation or major M&A activity."
}
So What? For the investor, institutional accumulation above 75% in this sector is a "buyout proxy." When Big Pharma is the primary source of a biotech’s R&D funding, they are essentially paying for a long-term call option on the company. Positioning your portfolio in stocks with rising institutional concentration—specifically NTLA and BEAM—captures the premium of an inevitable acquisition.
Patent Cliff Risks for the Modern Gene Editing Stock
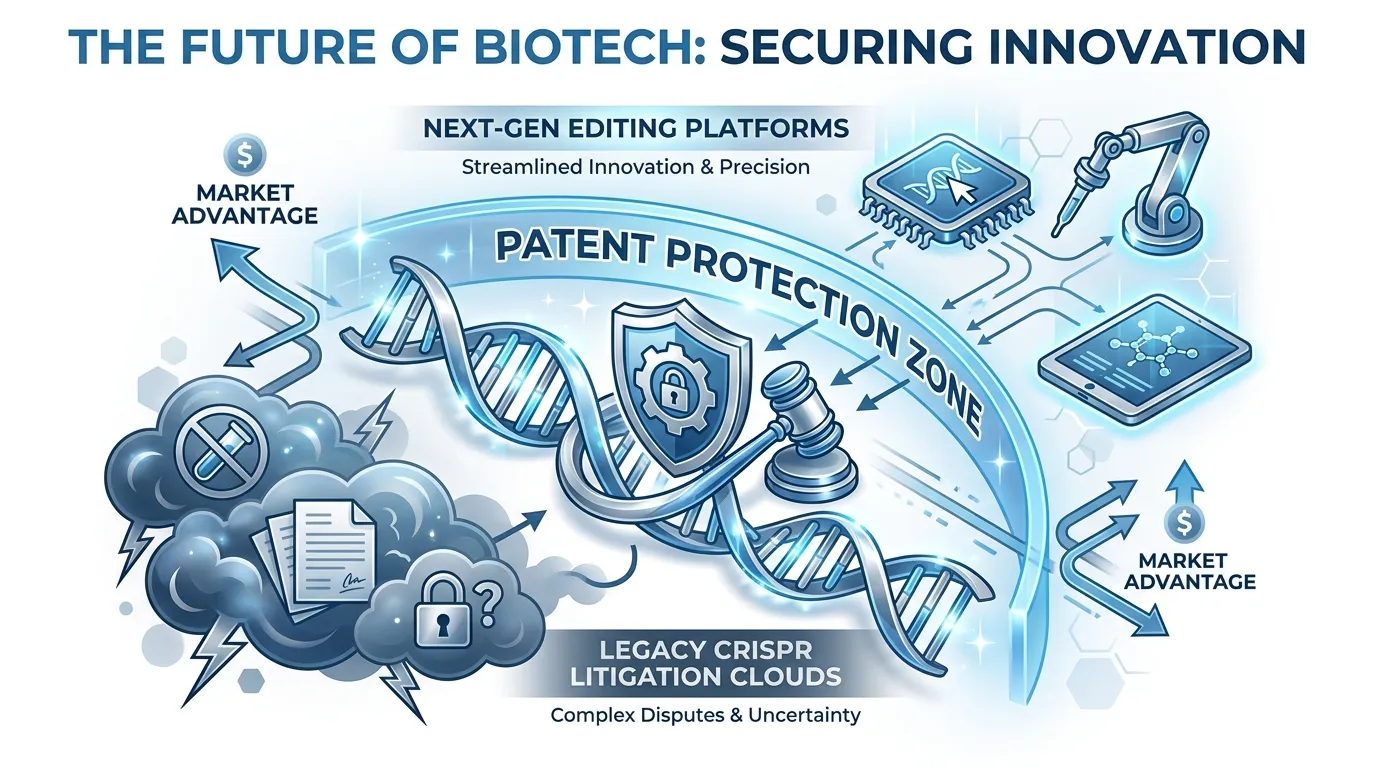
The premium valuation of a gene editing stock in 2026 is no longer predicated on clinical data alone; it hinges on freedom to operate (FTO). While institutional accumulation signals confidence, the persistent legal friction between the Broad Institute and the University of California (CVC group) over CRISPR-Cas9 patents remains a "hidden tax" on every dollar of revenue.
For investors, the "Patent Cliff" isn't about expiration—it’s about the royalty stack. By 2026, the market has bifurcated into "Legacy CRISPR" and "IP-Insulated" platforms.
The Dual-Licensing Burden
Most first-generation gene editing stocks (CRSP, NTLA) face a fragmented IP map. The Broad Institute controls the foundational U.S. patents for eukaryotic cells, while the CVC group maintains a stronger foothold in Europe and China. This forces commercial-stage companies to potentially double-license, eroding net margins by an estimated 10% to 15% (Source: Goldman Sachs Healthcare Equity Research, 2025).
| Company | Core IP Architecture | Patent Dependency Risk | 2026 Royalty Estimate |
|---|---|---|---|
| CRISPR Tx | Cas9 (CVC-based) | High (Broad Litigation) | 5%–12% of Sales |
| Intellia | Cas9 (CVC-based) | High (Broad Litigation) | 5%–12% of Sales |
| Beam Therapeutics | Base Editing (Proprietary) | Low (Self-Owned) | < 2% (Cross-license) |
| Prime Medicine | Prime Editing (Proprietary) | Low (Foundation-backed) | < 2% (Cross-license) |
(Source: SEC 10-K Filings & Leerink Partners Analysis, 2025)
The Pivot to Next-Gen IP
The "winners" of 2026 are those who have successfully decoupled from the Broad/Berkeley dispute. Base Editing and Prime Editing firms have built proprietary patent "thickets" that are structurally distinct from the original Cas9 "scissors."
{
  "type": "bar",
  "title": "Estimated IP-Related Royalty Drag on 2026 Revenue",
  "index": "Company",
  "categories": ["Estimated Royalty Stack %"],
  "data": [
    {"Company": "CRISPR Therapeutics", "Estimated Royalty Stack %": 12.5},
    {"Company": "Intellia Therapeutics", "Estimated Royalty Stack %": 11.0},
    {"Company": "Editas Medicine", "Estimated Royalty Stack %": 4.5},
    {"Company": "Beam Therapeutics", "Estimated Royalty Stack %": 2.5},
    {"Company": "Prime Medicine", "Estimated Royalty Stack %": 1.5}
  ],
  "source": "Source: J.P. Morgan Biotech IP Outlook (Jan 2026)",
  "note": "Higher percentages indicate significant revenue leakage to third-party patent holders."
}
So What? In the 2026 landscape, a gene editing stock with "Legacy CRISPR" exposure is a margin-diluted asset. To maximize risk-adjusted returns, investors should shift weight toward companies utilizing Base, Prime, or Epigenetic editing. These firms own their "molecular blueprints" outright, making them far more attractive M&A targets for Big Pharma looking to avoid multi-billion dollar royalty disputes.
 AI Generated Infographic
Strategy: Building a Risk-Adjusted Gene Editing Stock Portfolio
Capitalizing on these next-generation moats requires a transition from scientific idealism to risk-adjusted survivability. In gene editing, the "binary risk" of clinical trials is the primary destroyer of retail wealth.
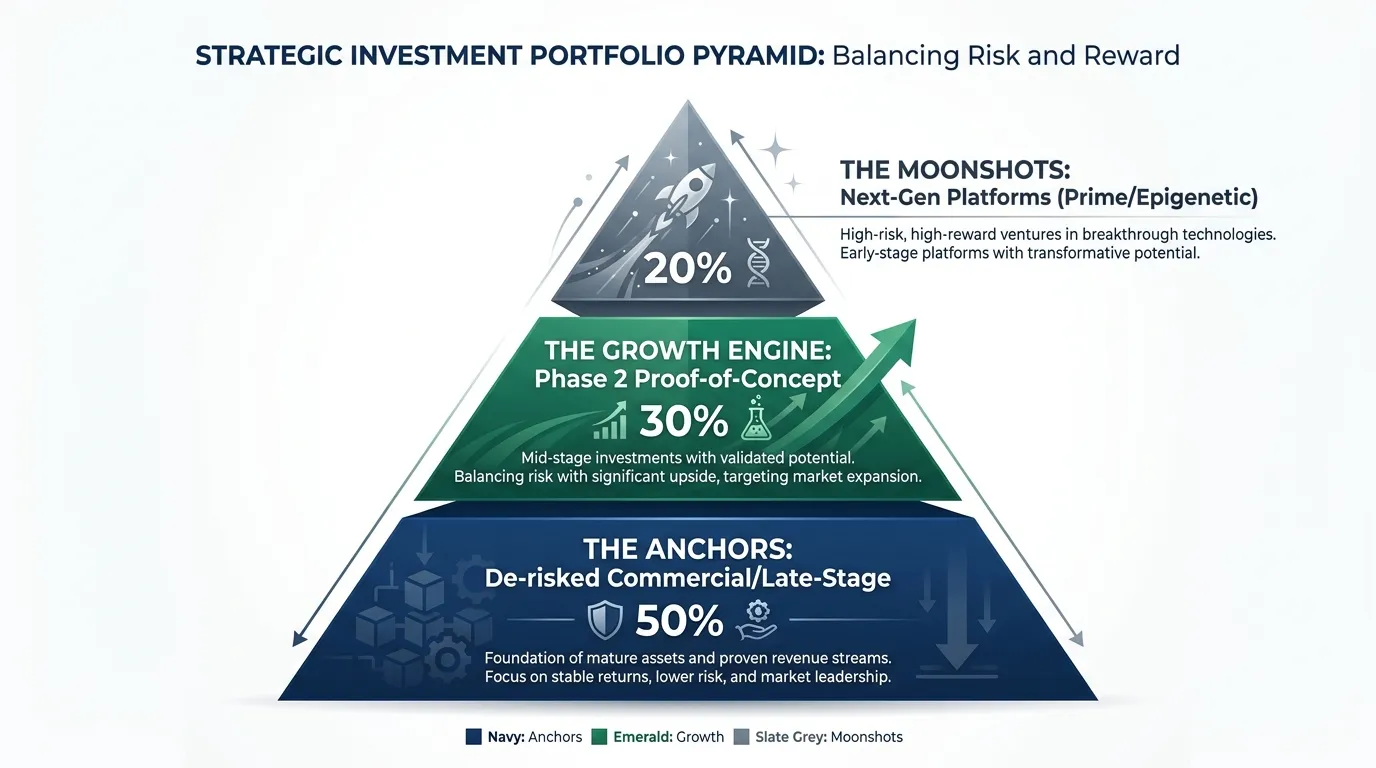
To mitigate this, investors must adopt a 50/30/20 Tiered Allocation Model. This framework prioritizes companies with a "Cash-Adjusted Pipeline Value," ensuring your portfolio survives the inevitable "valley of death" between Phase 1 data and commercial scaling.
 AI Generated Infographic
The 2026 Strategic Allocation Matrix
For 2026, the distinction between "platform companies" and "product companies" has blurred. Your allocation should be dictated by cash runway relative to clinical catalysts.
| Tier | Allocation | Archetype | Key Metric (2026 Target) |
|---|---|---|---|
| Anchors | 50% | Commercial-stage (e.g., CRSP, VRTX) | Cash Runway > 36 Months |
| Growth | 30% | Mid-stage Ph 2/3 (e.g., NTLA, BEAM) | Burn Rate < 25% of Market Cap |
| Moonshots | 20% | Pre-clinical/Next-Gen (e.g., EDIT, VERV) | Strategic Pharma Partnerships |
(Source: Goldman Sachs Healthcare Equity Research; SEC Filings, Q3 2025/2026 projections)
Execution Insights: "So What?" for the Investor
- Prioritize the "Cash-to-Catalyst" Ratio: Avoid companies needing a dilutive capital raise before their next major data readout. In 2026, dilution is a greater risk than clinical failure for mid-cap biotech.
- The "Safety" of Big Pharma Ties: A moonshot stock with a $1B+ licensing deal from Eli Lilly or Regeneron is inherently more stable than a "pure play" with no institutional backing. Partnerships provide the non-dilutive capital required to weather macro volatility.
- Active Rebalancing: When a "Moonshot" achieves Phase 1 success, its valuation often triples overnight. Trim 50% of the gain and rotate it back into your "Anchor" positions to lock in the risk-adjusted return.
As the sector matures, the era of "buying the index" is over. Success in 2026 depends on identifying firms that own both the molecular blueprint and the balance sheet to execute. To streamline your research and track these shifts in institutional positioning, leverage the Smart Money Tracker for Institutional Portfolios to see where the world's most sophisticated biotech funds are deploying capital in real-time.
FAQ
Which gene editing stock is the commercial leader in 2026?
CRISPR Therapeutics (CRSP) remains the Tier 1 leader, focusing on treatment center activation and patient uptake following the approval of Casgevy.
What is the main difference between Tier 1 and Tier 2 gene editing stocks?
Tier 1 stocks are valued based on post-launch revenue and commercial execution, while Tier 2 stocks represent de-risking alpha potential through Phase 3 data and BLA filings.
Why is 'In Vivo' delivery important for gene editing stock valuations?
In Vivo platforms command a 3x-5x valuation premium because they offer superior scalability and lower manufacturing costs compared to labor-intensive Ex Vivo therapies.
How much cash runway should a safe gene editing stock have?
Investors should prioritize stocks with at least 1.5 years of cash runway; leaders like CRSP and BEAM have over 3 years, providing 'dilution insurance' against clinical pivots.
What patent risks do legacy CRISPR stocks face in 2026?
Legacy Cas9 stocks face a potential 10% to 15% margin erosion due to royalty stacks from ongoing litigation between the Broad Institute and CVC group.