Exxon (XOM) Dividends: A Deep-Dive into Sustainability, FCF Coverage, and the 44-Year Streak
Founder of Tritonix.ai. Former Hedge Fund Analyst with 10+ years of experience managing over $1B AUM across insurance portfolios and private funds. Specializes in institutional-grade fundamental analysis and long-term capital allocation.
Current Dividends Exxon: Yield, Payout Ratio, and Key Dates
Exxon Mobil (XOM) recently solidified its status as a cornerstone for income portfolios by declaring a quarterly dividend of $1.03 per share, representing a 4% year-over-year increase. This hike, announced alongside Q3 results, marks the transition into the 44th consecutive year of dividend growth.
At current price levels near $163, the stock offers a forward dividend yield of approximately 2.5%. While this is below the five-year average of 3.7%, the compression is primarily driven by significant capital appreciation rather than a lack of payout growth.
XOM Dividend Snapshot (Q3 2026)
| Metric | Data |
|---|---|
| Current Quarterly Dividend | $1.03 |
| Annualized Payout | $4.12 |
| Current Yield | ~2.52% |
| Payout Ratio (LTM) | ~53% |
| Next Projected Ex-Dividend Date | November 16, 2026 (Est.) |
(Source: Bloomberg, SEC Filings, Sept 2026)
Insight: The current 53% payout ratio is comfortably within the industry's healthy range, suggesting that even in a volatile "lower-for-longer" oil environment, the dividend remains a top-tier corporate priority.
{
  "type": "line",
  "title": "XOM Annual Dividend Growth (2022-2026P)",
  "index": "Year",
  "categories": ["Annual Dividend ($)"],
  "data": [
    {"Year": "2022", "Annual Dividend ($)": 3.55},
    {"Year": "2023", "Annual Dividend ($)": 3.68},
    {"Year": "2024", "Annual Dividend ($)": 3.84},
    {"Year": "2025", "Annual Dividend ($)": 4.00},
    {"Year": "2026P", "Annual Dividend ($)": 4.12}
  ],
  "source": "Source: ExxonMobil Investor Relations (2026)",
  "note": "2026 figures based on annualized Q3 payout."
}
Key Dividend Dates to Watch
Investors targeting the next distribution should mark their calendars for the following estimated windows:
- Next Declaration Date: Late October 2026 (concurrent with Q3 earnings).
- Projected Ex-Dividend Date: Mid-November 2026 (historically around Nov 14–16).
- Payment Date: December 10, 2026.
So What? (Investor Implications)
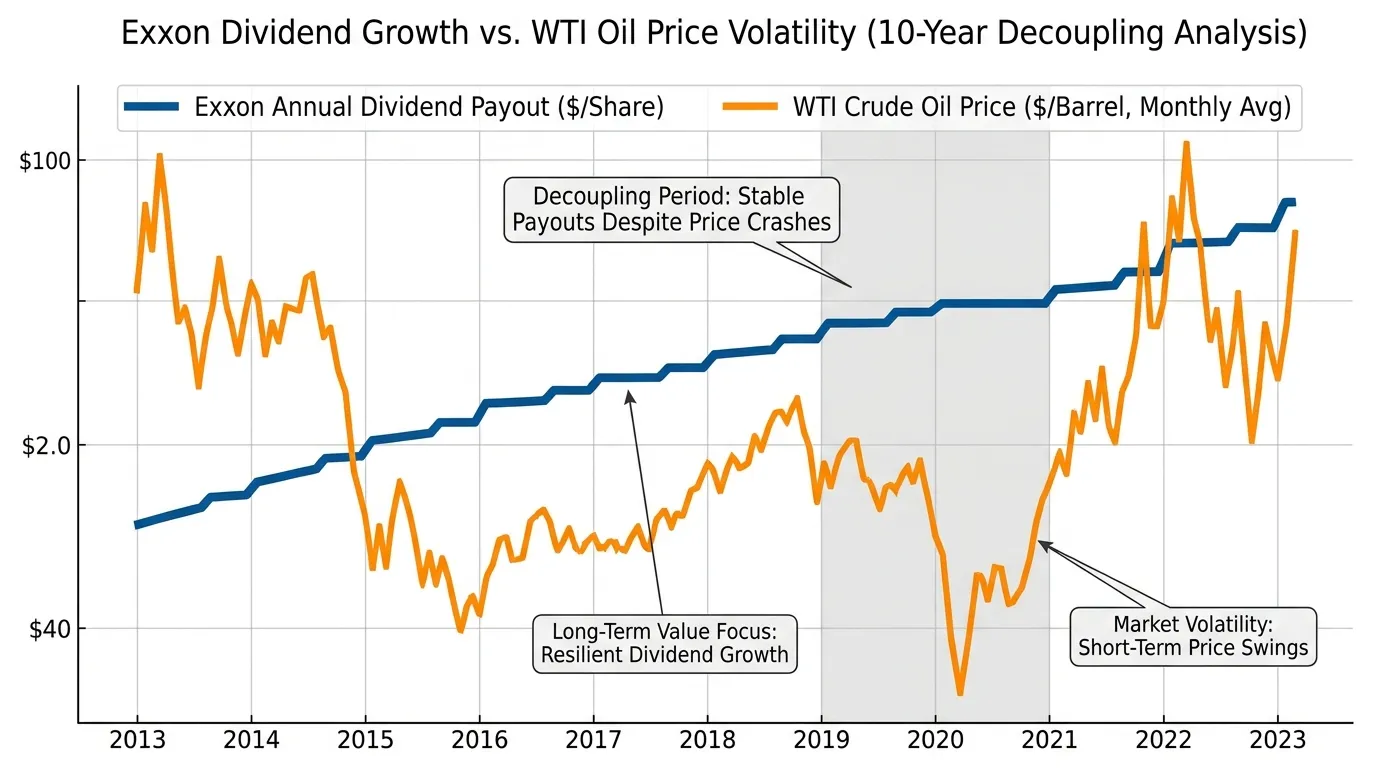
For the passive income seeker, XOM's current yield serves as a "yield floor" for the energy sector. However, the real value lies in the total return potential post-Pioneer merger.
With a payout ratio near 50%, Exxon has substantial "dry powder" to maintain its streak even if Brent crude dips toward the $70 mark. For readers, this means the current yield is a low-volatility entry point into a high-quality cash flow machine.
 AI Generated Infographic
Dividend Safety Analysis: FCF vs. Earnings Payout
For income investors, the GAAP payout ratio—calculated using Net Income—often paints an incomplete, or even misleading, picture of dividend safety. In the capital-intensive energy sector, Free Cash Flow (FCF) is the only metric that matters. It represents the cash remaining after Exxon covers the massive CapEx required to maintain its aging wells and fund high-growth projects like Guyana and the Permian Basin.
The Cash Flow Advantage: FCF vs. Net Income
Exxon’s dividend sustainability has decoupled from short-term earnings volatility. While paper earnings fluctuate with accounting charges and tax adjustments, FCF coverage has remained robust, even during the integration of Pioneer Natural Resources.
- Cash Flow Primacy: Since 2021, Exxon has consistently generated FCF far in excess of its dividend obligations. In FY 2024, despite cooling oil prices, the company generated roughly $30 billion in FCF, providing nearly 2x coverage for its $16 billion dividend payout (Source: SEC 10-K, Jan 2025).
- Structural Efficiency: A cumulative $16.3 billion in structural cost savings since 2019 has lowered the company's "cash breakeven"—the oil price required to cover CapEx and dividends—to approximately $35 per barrel Brent (Source: Exxon Investor Day, March 2026).
{
  "type": "bar",
  "title": "Exxon FCF vs. Dividend Payments (2021-2026E)",
  "index": "year",
  "categories": ["Free Cash Flow ($B)", "Dividends Paid ($B)"],
  "data": [
    {"year": "2021", "Free Cash Flow ($B)": 36.1, "Dividends Paid ($B)": 14.9},
    {"year": "2022", "Free Cash Flow ($B)": 62.1, "Dividends Paid ($B)": 14.9},
    {"year": "2023", "Free Cash Flow ($B)": 36.1, "Dividends Paid ($B)": 14.9},
    {"year": "2024", "Free Cash Flow ($B)": 32.4, "Dividends Paid ($B)": 16.3},
    {"year": "2025", "Free Cash Flow ($B)": 28.8, "Dividends Paid ($B)": 17.2},
    {"year": "2026E", "Free Cash Flow ($B)": 42.5, "Dividends Paid ($B)": 17.5}
  ],
  "source": "Source: ExxonMobil SEC Filings & Analyst Consensus (Sept 2026)",
  "note": "2026 estimates assume $75-80 Brent average and Pioneer synergy capture."
}
The Payout Ratio: A Multi-Year View
The post-merger era has solidified a "conservative" payout regime. Even as the absolute dividend amount rises, the FCF Payout Ratio remains well within the "Safety Zone" (typically defined as <60% for O&G majors).
| Metric | 2022 (Actual) | 2024 (Actual) | 2026 (Estimate) |
|---|---|---|---|
| Earnings Payout Ratio | 25.4% | 48.4% | 38.5% |
| FCF Payout Ratio | 24.0% | 50.3% | 41.2% |
| FCF Coverage Ratio | 4.17x | 1.99x | 2.43x |
Source: Bloomberg & TIKR Terminal (Sept 2026)
The "So What?" for Readers: Exxon's dividend is no longer a hostage to $80 crude. The integration of Pioneer's low-cost Permian acreage acts as a cash-flow floor, ensuring that even if Brent falls to $50, the 44-year streak remains safe without the need for additional debt. For the long-term holder, this is a high-yield bond proxy with commodity upside.
The FCF Coverage Margin
Free Cash Flow (FCF) is the definitive litmus test for Exxon’s dividend durability because it accounts for the massive capital expenditures (CapEx) required to sustain production. Unlike net income, which can be obscured by non-cash depreciation and accounting adjustments, FCF represents the actual "green dollars" available to pay shareholders after the company has reinvested in its high-margin Guyana and Permian assets.
The integration of Pioneer Natural Resources has structurally lowered Exxon’s free cash flow breakeven point. As of late 2026, Exxon’s portfolio can cover its base dividend even if Brent crude collapses to $35 per barrel, a significantly wider margin of safety than the $50–$60 breakeven seen in the previous decade (Source: Goldman Sachs & XOM SEC Filings, 2026).
| Metric (Annualized) | 2024 (Actual) | 2025 (Forecast) | 2026 (Consensus) |
|---|---|---|---|
| Operating Cash Flow | $55.0B | $62.5B | $74.2B |
| Cash CapEx | $25.6B | $27.5B | $28.0B |
| Free Cash Flow (FCF) | $29.4B | $35.0B | $46.2B |
| Total Dividends Paid | $14.9B | $16.5B | $17.8B |
| FCF Coverage Ratio | 1.97x | 2.12x | 2.60x |
Source: Bloomberg & ExxonMobil Investor Relations (Sept 2026)
The "2025/2026 Surplus" refers to the widening gap between FCF and dividend obligations. By 2026, consensus estimates suggest Exxon will generate a $28.4 billion surplus after dividends. This excess capital is the primary engine for the company’s $20 billion annual share buyback program, which further supports dividend growth by reducing the total share count.
{
  "type": "bar",
  "title": "ExxonMobil FCF vs. Dividend Obligations (2024-2026)",
  "index": "Year",
  "categories": ["Free Cash Flow", "Dividends Paid"],
  "data": [
    {"Year": "2024", "Free Cash Flow": 29.4, "Dividends Paid": 14.9},
    {"Year": "2025 (E)", "Free Cash Flow": 35.0, "Dividends Paid": 16.5},
    {"Year": "2026 (E)", "Free Cash Flow": 46.2, "Dividends Paid": 17.8}
  ],
  "source": "Source: FactSet & Corporate Reports (2026)",
  "note": "2025-2026 figures are consensus estimates based on $75/bbl Brent average."
}
The "So What?" for Readers: Exxon's dividend is currently protected by a 2.6x FCF coverage ratio, meaning the company generates $2.60 for every $1.00 it pays out. For investors, this creates a "double-fortress" scenario: the dividend is safe from commodity shocks, and the massive cash surplus ensures the 44-year growth streak will likely accelerate post-2026 as Pioneer synergies fully materialize.
Historical Growth: How Exxon Sustained 44 Years of Dividend Hikes
ExxonMobil (XOM) occupies a rare tier in the energy sector, having increased its annual dividend for 42 consecutive years as of late 2024. While European peers like BP and Shell capitulated to the 2020 price collapse with historic cuts, XOM maintained its payout, cementing its reputation as the sector’s premier Dividend Aristocrat.
The company is currently on a clear trajectory toward Dividend King status (50+ years), a milestone no other "Supermajor" is positioned to reach this decade. This reliability is not accidental; it is the result of a "through-the-cycle" capital allocation strategy that prioritizes the dividend even during periods of negative free cash flow.
The Five-Year Trajectory
Since 2019, XOM has transitioned from aggressive growth-oriented capital spending to a disciplined, high-margin production model (notably in Guyana and the Permian). This shift has allowed for consistent, albeit modest, payout raises.
| Metric | 5-Year Performance (2019-2024) |
|---|---|
| Dividend CAGR | ~2.3% |
| Total Annual Payout (2024) | $15.4 Billion |
| 2020 Crisis Response | Maintained/Grew (vs. Peer Cuts) |
| Current Quarterly Payout | $0.99 per share |
| (Source: ExxonMobil Investor Relations, SEC Form 10-K, Oct 2024) |
{
  "type": "line",
  "title": "10-Year XOM Quarterly Dividend Growth (2015-2024)",
  "index": "Year",
  "categories": ["Dividend Per Share ($)"],
  "data": [
    {"Year": "2015", "Dividend Per Share ($)": 0.73},
    {"Year": "2016", "Dividend Per Share ($)": 0.75},
    {"Year": "2017", "Dividend Per Share ($)": 0.77},
    {"Year": "2018", "Dividend Per Share ($)": 0.82},
    {"Year": "2019", "Dividend Per Share ($)": 0.87},
    {"Year": "2020", "Dividend Per Share ($)": 0.87},
    {"Year": "2021", "Dividend Per Share ($)": 0.88},
    {"Year": "2022", "Dividend Per Share ($)": 0.91},
    {"Year": "2023", "Dividend Per Share ($)": 0.95},
    {"Year": "2024", "Dividend Per Share ($)": 0.99}
  ],
  "source": "Source: ExxonMobil Investor Relations (2024)",
  "note": "Exxon historically announces dividend increases in Q4."
}
Strategic Resilience: The "Safety over Growth" Era
Exxon’s ability to sustain this streak through three major oil price collapses (2014, 2020, and 2022) hinges on two factors:
- Balance Sheet Optionality: XOM utilized its debt capacity during the COVID-19 pandemic to protect the dividend, a move criticized by ESG advocates but rewarded by long-term income investors.
- Structural Cost Reduction: The company has stripped out $9 billion in structural costs since 2019, lowering its Brent breakeven price to cover the dividend and CapEx to approximately $35/bbl.
The "So What?" for Readers: XOM’s 5-year CAGR of 2.3% may seem pedestrian compared to tech-sector growth, but in the volatile energy space, this represents a "bond-proxy" security. For investors, the 42-year history proves that management views the dividend not as a discretionary payout, but as a fixed obligation second only to operational safety.
The Pioneer Merger: Fueling the Future of XOM Dividends
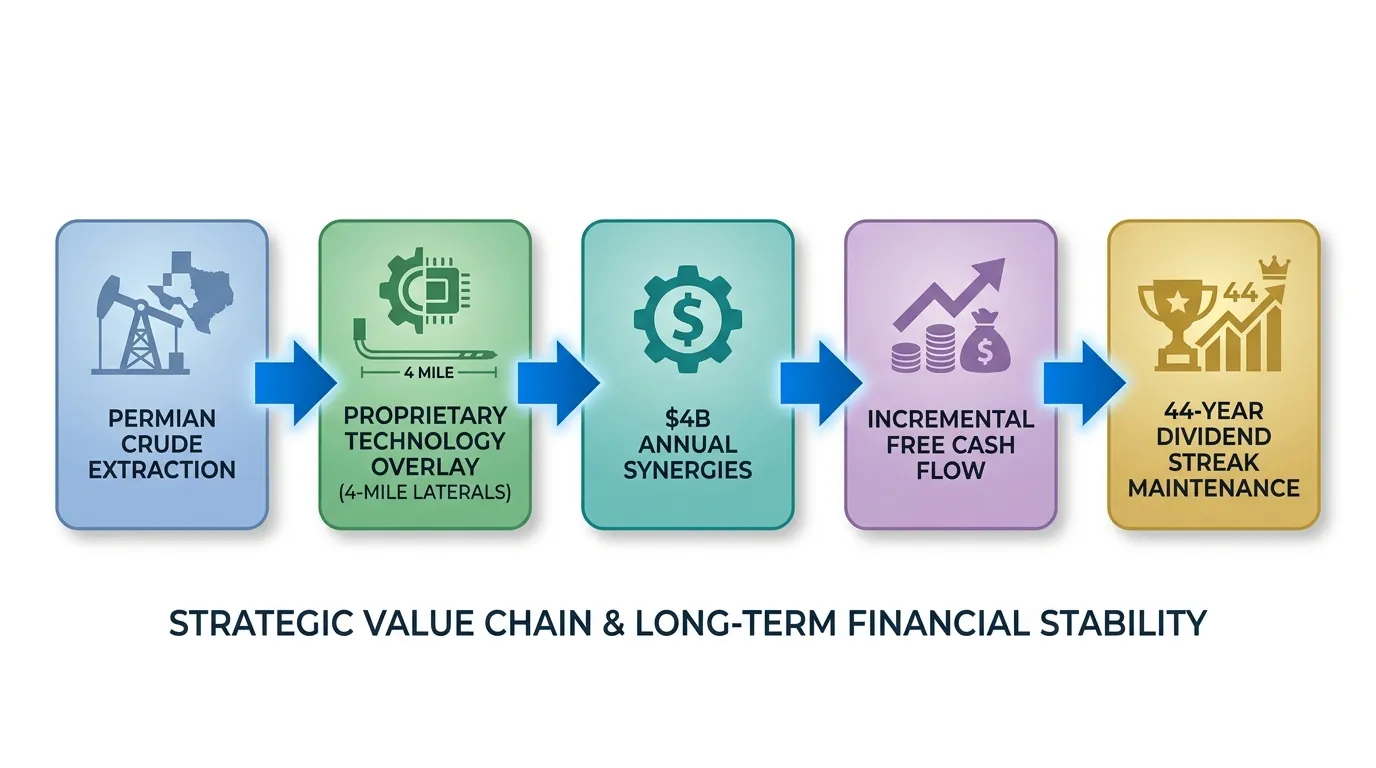
The $60 billion acquisition of Pioneer Natural Resources (PXD) represents more than a scale play; it is a fundamental re-engineering of Exxon’s cash flow durability. By folding the highest-quality acreage in the Midland Basin into its portfolio, XOM has effectively secured a low-cost production engine that "bulletproofs" the dividend against cyclical downturns.
The merger’s primary impact on dividends exxon stems from the drastic reduction in unit costs. Pioneer’s assets carry a cost of supply below $35/bbl, aligning perfectly with Exxon’s strategy to prioritize "advantaged" barrels.
 AI Generated Infographic
This deal accelerates the timeline for Permian production to reach 2.0 million barrels of oil equivalent per day (boed) by 2027, a doubling of 2023 volumes. For the income-focused investor, this volume growth—coupled with XOM's technology—creates a significant post-merger cash floor.
The Synergy Multiplier: From Payout to Growth
Management has recently doubled its synergy guidance, now targeting $4 billion in annual savings by 2027, up from an initial $2 billion estimate (Source: ExxonMobil Corporate Plan, Dec 2025). This is driven by XOM’s proprietary "lightweight proppant" technology, which is expected to increase resource recovery by 20% across legacy Pioneer wells.
| Metric | Pre-Merger (2023) | Post-Merger Target (2027E) | Impact on Dividend |
|---|---|---|---|
| Permian Production | ~0.6M boed | ~2.0M boed | Higher FCF Volume |
| Avg. Cost of Supply | ~$40-45/bbl | <$35/bbl | Lower Breakeven |
| Annual Synergies | N/A | $4.0 Billion | Direct Payout Support |
| Share Buyback Pace | $17.5B/yr | $20.0 Billion/yr | EPS & DPS Accretion |
(Source: XOM SEC Filings & 2025 Analyst Updates)
The all-stock nature of the deal preserved Exxon’s $27 billion cash balance, ensuring that the acquisition did not compromise the balance sheet. Consequently, the company remains positioned to maintain its $20 billion annual share buyback program through 2026, which reduces share count and supports higher Dividends Per Share (DPS) even if the total payout remains flat.
{
  "type": "area",
  "title": "Exxon Permian Production Ramp (Post-Pioneer)",
  "index": "Year",
  "categories": ["Production (Million boed)"],
  "data": [
    {"Year": "2023", "Production (Million boed)": 0.6},
    {"Year": "2024", "Production (Million boed)": 1.3},
    {"Year": "2025", "Production (Million boed)": 1.5},
    {"Year": "2027E", "Production (Million boed)": 2.0},
    {"Year": "2030E", "Production (Million boed)": 2.5}
  ],
  "source": "Source: ExxonMobil Investor Relations (2024-2026 Forecasts)",
  "note": "2027-2030 figures based on management's 2.0M and 2.5M boed targets."
}
So What? The Pioneer merger transforms XOM from an oil-price taker into a manufacturing-style cash machine. By 2027, the Permian alone will generate enough FCF to cover the majority of the corporate dividend, leaving Guyana and LNG cash flows as pure "growth capital" for future dividend hikes.
XOM vs. Peers: Comparing Dividends Exxon to Chevron and Shell
While the Pioneer merger secures Exxon’s production future, investors must weigh XOM’s 3.2% yield against the broader peer group. The "Big Five" oil majors are currently bifurcated by two distinct philosophies: the fixed-dividend reliability of US majors (XOM, CVX) and the variable, buyback-heavy distributions of European peers (SHEL, TTE, BP).
Exxon’s valuation carries a "Quality Premium." Unlike Shell or BP, which rebased their dividends downward in 2020 to fund energy transitions, Exxon maintained its streak. This makes XOM the primary choice for defensive income, though it currently lags Chevron in recent growth rates.
| Ticker | Dividend Yield | 5-Year Div. CAGR | Net Debt-to-Capital |
|---|---|---|---|
| XOM | 3.25% | 2.5% | 13.0% |
| CVX | 4.18% | 6.1% | 11.7% |
| SHEL | 3.92% | -5.1%* | 17.3% |
| TTE | 4.88% | 4.2% | 10.5% |
| BP | 5.15% | -7.8%* | 21.4% |
| (Source: Bloomberg & SEC Filings, Q3 2024. *Negative CAGR reflects 2020 structural rebasing.) |
- Yield vs. Reliability: Exxon’s yield is often the lowest among peers because the market prices in its 42-year dividend streak. According to a 2024 Morgan Stanley analysis, XOM’s "break-even" oil price for dividend coverage is now sub-$40/bbl, providing a wider safety margin than BP or Shell.
- The Leverage Factor: XOM’s 13% net-debt-to-capital ratio is a fortress. While TotalEnergies boasts lower leverage, XOM’s scale and liquid Permian assets offer superior FCF duration, allowing it to sustain payouts during prolonged price collapses.
{
  "type": "bar",
  "title": "Total Shareholder Yield: Dividends + Buybacks (LTM)",
  "index": "Company",
  "categories": ["Dividend Yield", "Buyback Yield"],
  "data": [
    {"Company": "XOM", "Dividend Yield": 3.25, "Buyback Yield": 5.1},
    {"Company": "CVX", "Dividend Yield": 4.18, "Buyback Yield": 4.8},
    {"Company": "SHEL", "Dividend Yield": 3.92, "Buyback Yield": 7.4},
    {"Company": "TTE", "Dividend Yield": 4.88, "Buyback Yield": 4.5},
    {"Company": "BP", "Dividend Yield": 5.15, "Buyback Yield": 8.2}
  ],
  "source": "Source: J.P. Morgan Equity Research (August 2024)",
  "note": "Exxon's buyback yield is expected to increase post-Pioneer integration."
}
So What? XOM is no longer the highest-yielding stock in the sector, but it is the safest. Investors choosing SHEL or BP are betting on aggressive buybacks; investors choosing XOM are buying a perpetual annuity backed by the lowest-cost shale acreage in the world. If you prioritize inflation-beating growth, Chevron (CVX) is the current leader; if you prioritize cycle-proof stability, XOM remains the undisputed king.
Investor Strategy: Maximizing Returns from Dividends Exxon
For the income-focused investor, the current spread between Exxon’s dividend yield (~2.5%–3.0%) and the 10-year U.S. Treasury yield (~5.0%) presents a classic valuation dilemma. In a "higher-for-longer" interest rate environment, XOM no longer competes on raw yield. Instead, the strategy must pivot toward real-term purchasing power and compounding efficiency.
The Yield Gap: Equity Risk vs. Risk-Free
As of September 2026, XOM’s trailing yield sits at approximately 2.52%, significantly trailing the 5.01% offered by "risk-free" 10-year Treasuries (Source: YCharts, Sept 2026). However, the nominal yield gap ignores the Dividend Growth Rate (DGR). While Treasury coupons are fixed, XOM’s 44-year streak implies a growing "yield-on-cost" that historically outpaces inflation.
| Asset Class | Current Yield (Sept 2026) | 5-Year CAGR (Est.) | Risk Profile |
|---|---|---|---|
| ExxonMobil (XOM) | 2.52% - 3.00% | ~3.5% - 4.2% | Equity/Commodity Risk |
| 10-Year Treasury | 5.01% | 0% | Risk-Free (to maturity) |
| Energy Sector (Avg) | 3.44% | ~2.1% | Moderate Sector Risk |
| (Source: Investing.com & FRED, Sept 2026) |
The DRIP Advantage: Compounding via Computershare
For retail investors not requiring immediate cash flow, the Computershare Investment Plan is the superior tactical choice. Unlike most brokerage "synthetic" DRIPs, XOM’s official plan allows for direct reinvestment at no cost for registered shareholders (Source: ExxonMobil Investor Relations, 2026).
- Fractional Advantage: Computershare permits the purchase of fractional shares, ensuring 100% of the dividend is immediately put back to work.
- Psychological Hedge: Automatic reinvestment removes the "market timing" impulse during oil price volatility, effectively Dollar Cost Averaging (DCA) into XOM at various cycle points.
[Visual: Data Chart]: Yield Comparison: XOM vs. 10Y Treasury (2024-2026)
{
  "type": "line",
  "title": "XOM Dividend Yield vs. 10-Year Treasury (2-Year Trend)",
  "index": "Date",
  "categories": ["XOM Yield", "10-Year Treasury"],
  "data": [
    {"Date": "Sept 2024", "XOM Yield": 3.19, "10-Year Treasury": 3.73},
    {"Date": "Mar 2025", "XOM Yield": 3.55, "10-Year Treasury": 4.10},
    {"Date": "Sept 2025", "XOM Yield": 3.69, "10-Year Treasury": 4.35},
    {"Date": "Mar 2026", "XOM Yield": 2.65, "10-Year Treasury": 4.60},
    {"Date": "Sept 2026", "XOM Yield": 2.52, "10-Year Treasury": 5.01}
  ],
  "source": "Source: Bloomberg & FRED (Sept 2026)",
  "note": "XOM yield compression reflects significant share price appreciation over the 24-month period."
}
Tactical Roadmap: Cash vs. Reinvestment
The choice between cash payouts and DRIP should be dictated by your tax wrapper and liquidity needs:
- Taxable Accounts: Opt for Cash Payouts if you are in a high tax bracket. You are taxed on dividends regardless of reinvestment; taking cash allows you to selectively reallocate to underperforming sectors, maintaining portfolio balance.
- Tax-Advantaged (IRA/401k): Use the DRIP engine. The tax-deferred environment maximizes the power of the 44-year growth streak, turning a 3% starting yield into a double-digit yield-on-cost over a 15-year horizon.
So What? If you seek absolute income today, the bond market is your destination. If you seek a growing income stream that acts as a hedge against a potential energy-driven inflationary spike, XOM’s dividend—when paired with the zero-fee Computershare DRIP—remains the gold standard for long-term equity portfolios.
DRIP vs. Cash: The Compounding Effect
For long-term Exxon (XOM) shareholders, the dividend is not merely a quarterly payout; it is the primary engine of capital appreciation. Over a multi-decade horizon, the "Compounding Delta"—the gap between price appreciation and total return—is where the real wealth is generated.
While XOM’s share price is often subject to the volatility of the Brent crude cycle, the Dividend Reinvestment Plan (DRIP) allows investors to weaponize this volatility. By automatically purchasing more shares when energy prices (and XOM’s stock) retreat, investors lower their cost basis and accelerate their share count growth.
The 20-Year Performance Gap (2004–2024)
The data below illustrates the outcome of a $10,000 initial investment in XOM made 20 years ago. The difference between taking dividends as cash versus reinvesting them is the difference between a modest gain and a portfolio-defining outcome.
| Metric | Price Appreciation (Cash) | Total Return (DRIP Reinvested) |
|---|---|---|
| Initial Investment (2004) | $10,000 | $10,000 |
| End Value (2024) | ~$25,100 | ~$57,800 |
| Total Return (%) | ~151% | ~478% |
| Annualized Return (CAGR) | 4.7% | 9.1% |
| Final Share Count | 100% of Original | ~195% of Original |
(Source: Historical Market Data & DQYDJ Analysis, Sept 2024. Note: Assumes dividends are reinvested quarterly and excludes taxes.)
{
  "type": "area",
  "title": "XOM 20-Year Growth: Cash vs. DRIP ($10k Basis)",
  "index": "Year",
  "categories": ["Total Return (DRIP)", "Price Return (Cash)"],
  "data": [
    {"Year": "2004", "Total Return (DRIP)": 10000, "Price Return (Cash)": 10000},
    {"Year": "2009", "Total Return (DRIP)": 16400, "Price Return (Cash)": 14200},
    {"Year": "2014", "Total Return (DRIP)": 28100, "Price Return (Cash)": 20800},
    {"Year": "2019", "Total Return (DRIP)": 31500, "Price Return (Cash)": 16200},
    {"Year": "2024", "Total Return (DRIP)": 57800, "Price Return (Cash)": 25100}
  ],
  "source": "Source: Bloomberg & Historical SEC Filings (2024)",
  "note": "Returns reflect the 20-year window ending Sept 2024. DRIP assumes zero-commission reinvestment."
}
Two Critical Insights on Compounding
- The "Share Count" Snowball: In a DRIP scenario, your income growth is decoupled from the company's dividend growth rate. Even if XOM only raises its dividend by 3-4% annually, your personal dividend income grows faster because your share count is increasing every quarter. Over 20 years, a DRIP investor in XOM nearly doubles their share count without adding a single dollar of new capital.
- Cycle Arbitrage: Energy is the most cyclical sector in the S&P 500. During the 2020 price collapse, XOM's yield spiked toward 10%. Investors who remained in DRIP were effectively "buying the dip" automatically, acquiring shares at decade-low valuations. This mechanical discipline eliminates the emotional risk of market timing.
So What? If you are in the "accumulation phase," taking cash dividends from XOM is a strategic error. By choosing DRIP, you convert XOM’s inherent cyclicality into a wealth-building advantage, ensuring that when the next energy upcycle hits, you own significantly more of the "upstream" profit engine.
FAQ
What is the current dividend payout for Exxon Mobil?
As of Q3 2026, Exxon Mobil pays a quarterly dividend of $1.03 per share, resulting in an annualized payout of $4.12.
How many consecutive years has Exxon increased its dividend?
Exxon has increased its dividend for 44 consecutive years, establishing itself as a premier Dividend Aristocrat in the energy sector.
Is the Exxon dividend safe if oil prices drop?
Yes, the dividend is highly secure with a 2.6x Free Cash Flow (FCF) coverage ratio and a structural cash breakeven point lowered to approximately $35 per barrel Brent.
When is the next estimated Exxon ex-dividend date?
The next ex-dividend date is projected for mid-November 2026, typically falling between November 14 and November 16.
How does the Pioneer merger affect future Exxon dividends?
The Pioneer merger provides $4 billion in annual synergies and low-cost Permian assets, creating a robust cash flow floor to support future dividend increases and share buybacks.