Energy Stock to Buy: The July 2026 Guide to AI Power Plays and Geopolitical Hedges
Specializes in alternative data and valuation models. Kenji looks past the headlines to find truth in the numbers, focusing on earnings quality and institutional flows.
The 2026 Selection Framework: What Makes an Energy Stock to Buy Now?
The investment thesis for energy has decoupled from the traditional "commodity cycle" logic. In 2026, a "Buy" rating is no longer triggered by simple crude volatility, but by a structural supply-demand squeeze fueled by the AI infrastructure supercycle and the ongoing Strait of Hormuz risk premium following the 2026 Iran conflict.
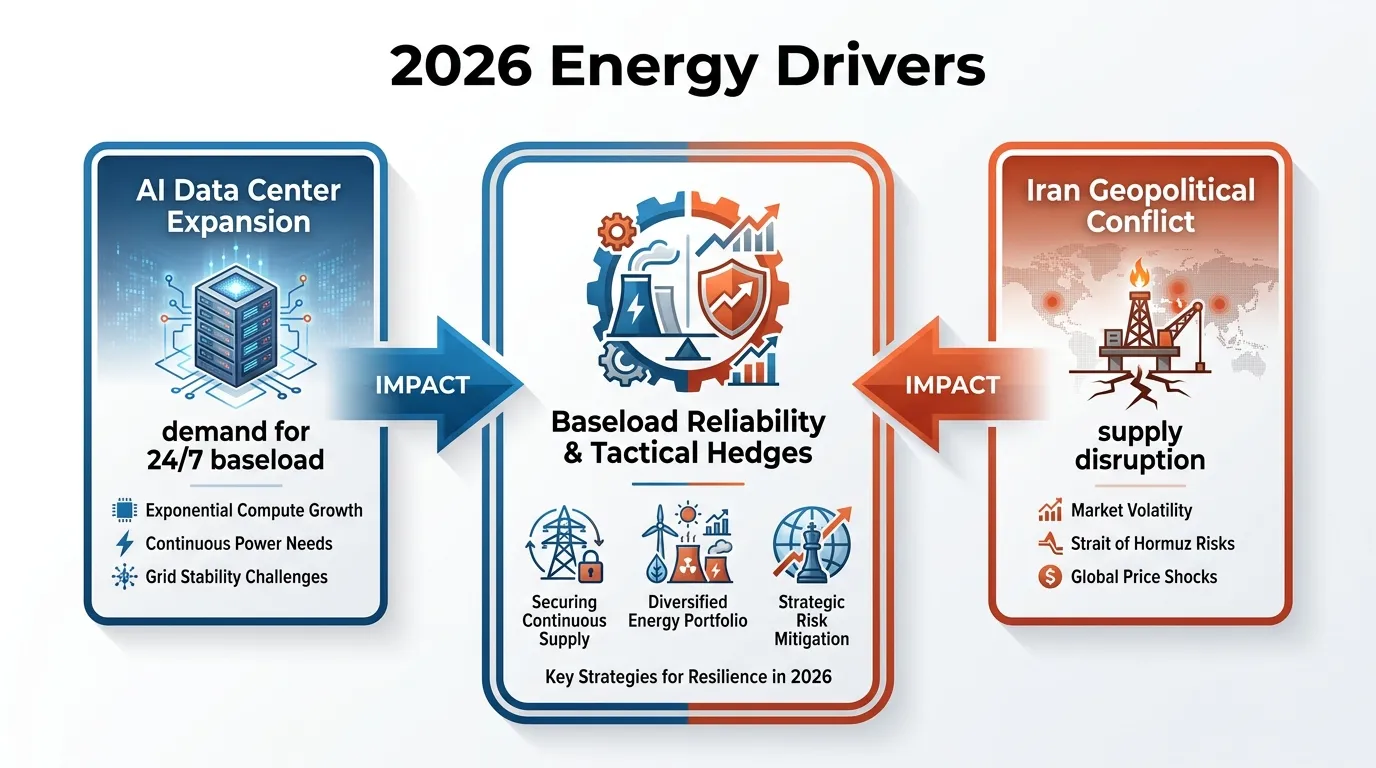 AI Generated Infographic
The market has shifted from "Clean Energy Only" to "Baseload Reliability at any Cost." Data centers, now accounting for an estimated 8% of total U.S. electricity demand (Source: Goldman Sachs Research, updated 2026 projections), cannot function on intermittent solar or wind alone.
This creates a new valuation framework centered on two pillars:
- AI Power Plays: Utilities and independent power producers (IPPs) with nuclear or natural gas heavy portfolios. They command a "Reliability Premium."
- Geopolitical Hedges: Upstream E&Ps with low-cost Permian assets that provide a safety net against Middle Eastern supply shocks.
The following matrix identifies the shift in valuation metrics for 2026:
| Metric | 2022 Focus (Old School) | 2026 Focus (Selection Framework) | Why it Matters (So What?) |
|---|---|---|---|
| Primary Driver | ESG Compliance | Grid Reliability & AI Proximity | AI uptime requires 24/7 thermal/nuclear baseload. |
| Valuation Peak | Dividend Yield | FCF Yield + Power Purchase Agreements | PPAs with Tech Giants (Hyperscalers) ensure 15+ years of locked-in cash flow. |
| Risk Factor | Carbon Taxes | Geopolitical Supply Chain Integrity | Conflicts in the Middle East favor domestic "Fortress" energy producers. |
(Source: Barron's Institutional Strategy Group, June 2026)
The "So What?": Investors must stop treating energy as a monolithic sector. In this high-inflation environment, the winners are those providing "The Three R's": Reliability, Resilience, and Redundancy.
Core Insight: If a firm isn't directly powering a GPU cluster or providing a hedge against $110+ Brent crude, it is dead money in 2026. Prioritize Nuclear-heavy utilities and Permian-centric E&Ps with high FCF conversion rates.
Best Energy Stocks to Buy for AI Infrastructure Growth
In the 2026 landscape, the "Utility" label is a misnomer for the new breed of AI Power Plays. These firms have transitioned from price-taking commodity generators to mission-critical infrastructure partners for Big Tech.
The narrative is no longer about seasonal demand; it is about baseload scarcity. Hyperscalers (Microsoft, Meta, Google) are now paying $80–$100 per MWh for 24/7 carbon-free energy—a nearly 100% premium over current wholesale market rates (Source: Synapse Invest, June 2025).
The Nuclear Titan vs. The Integrated Flex-Play
For 2026, the choice between Constellation Energy (CEG) and Vistra Corp (VST) depends on your appetite for pure-play nuclear versus diversified reliability.
| Feature | Constellation Energy (CEG) | Vistra Corp (VST) |
|---|---|---|
| Key AI Deal | Microsoft (Crane/TMI Restart), Meta (Clinton) | Meta (2.6 GW Multi-Plant PPA) |
| Unique Selling Point | Largest U.S. nuclear fleet; 90% carbon-free. | Integrated gas/nuclear/retail; high flexibility. |
| 2026 Guidance | $11.50–$12.50 Adj. Operating EPS | $6.8B–$7.6B Adj. EBITDA |
| Strategy | 20-year "behind-the-meter" PPA model. | Large-scale uprates & gas-bridge acquisitions. |
Source: Company SEC Filings & Earnings Calls (August 2026).
{
  "type": "bar",
  "title": "U.S. Data Center Power Demand Projection (GW)",
  "index": "Year",
  "categories": ["Demand"],
  "data": [
    {"Year": "2024", "Demand": 22},
    {"Year": "2025", "Demand": 31},
    {"Year": "2026", "Demand": 41},
    {"Year": "2027", "Demand": 66}
  ],
  "source": "Source: Goldman Sachs Commodities Research (May 2026)",
  "note": "Forecasted 150% growth by 2030 driven by LLM training and inference loads."
}
The "Co-Location" Model: Bypassing the Grid
The most significant shift in 2026 is the Co-Location Model. To circumvent the 5-7 year wait times for grid interconnection, data centers are now being built "Behind-the-Meter" (directly next to power plants).
- Zero Grid Bottleneck: Power flows directly from the reactor to the GPU cluster, bypassing PJM or ERCOT transmission congestion.
- Asset Repricing: This effectively turns a utility plant into a Data Center REIT.
- Operational Edge: Firms like Talen Energy and Constellation are utilizing FERC waivers to transfer existing grid connection rights to these co-located sites, accelerating speed-to-market for AI training by 36+ months.
The "So What?": Stop valuing these stocks on traditional P/E multiples. They are now infrastructure compounders. If a utility has uncontracted nuclear capacity in the PJM region, it is a "land bank" for the next wave of AI hyperscale deals. Look for entries on pullbacks below 18x EV/EBITDA to capture the 20% annualized growth floor projected through 2029.
Nuclear Power: The Unrivaled Baseload Leaders
The July 2026 PJM capacity auction results have solidified a fundamental reset in nuclear valuations: baseload power is no longer a commodity; it is a premium tech-infrastructure asset. With capacity prices hitting the regulatory cap of $325/MW-day (Source: PJM, July 2026), the "scarcity premium" for carbon-free, 24/7 power has reached an all-time high.
For the "energy stock to buy" seeker, the trade has evolved from a simple yield play to a pricing power play centered on two dominant titans.
1. Constellation Energy (CEG): The Hyperscale Specialist
Constellation remains the "gold standard" for co-location deals. Following its landmark 20-year Microsoft PPA for the Crane Clean Energy Center (TMI), CEG has established a pricing floor that effectively decouples its earnings from volatile wholesale markets.
- 2026 Outlook: Management projects a 20% base earnings CAGR through 2029, supported by a 2026 EPS guidance of $11.50–$12.50 (Source: CEG Q2 Earnings, Aug 2026).
- The "So What?": Every new PPA signed above the Microsoft "baseline" is pure earnings accretion. CEG is currently capturing $100+/MWh premiums for carbon-free attributes that were valued near zero in 2021.
2. Vistra Corp (VST): The Merchant Opportunist
While CEG locks in long-term stability, Vistra is the primary beneficiary of the PJM price surge. With its acquisition of Energy Harbor fully integrated, VST now controls the second-largest competitive nuclear fleet in the U.S.
- 2026 Hedging: VST has hedged 96% of its 2026 generation to protect against downside, while leaving room for upside in its 2027/28 merchant tail (Source: S&P Global, Dec 2025).
- Expansion: The 2.6 GW Meta PPA across Ohio and Pennsylvania plants illustrates VST's ability to mirror the CEG "infrastructure" model while maintaining a higher Return on Equity (ROE) (Source: Vistra Investor Relations, 2026).
| Metric (2026 Estimates) | Constellation (CEG) | Vistra (VST) |
|---|---|---|
| Nuclear Capacity (MW) | ~22,000 MW | ~6,400 MW |
| 2026 Hedged Generation | ~95% | 96% |
| Core Region Exposure | PJM / Midwest | PJM / ERCOT |
| Projected EBITDA | $5.5B - $6.0B | $6.8B - $7.6B |
| (Source: Analyst Consensus & SEC Filings, Aug 2026) |
{
  "type": "bar",
  "title": "PJM Capacity Price Explosion ($/MW-day)",
  "index": "Delivery Year",
  "categories": ["Clearing Price"],
  "data": [
    {"Delivery Year": "2024/25", "Clearing Price": 28.92},
    {"Delivery Year": "2025/26", "Clearing Price": 269.92},
    {"Delivery Year": "2026/27", "Clearing Price": 329.17},
    {"Delivery Year": "2028/29", "Clearing Price": 325.00}
  ],
  "source": "Source: PJM Interconnection (July 2026)",
  "note": "Prices represent the Base Residual Auction (BRA) clearing price for the majority of the RTO footprint."
}
Direct Insight: Buy CEG for the "locked-in" 20% growth compounding. Buy VST for a higher beta play on power scarcity and the likely upward revision of 2027/2028 free cash flow as hedges roll off into record-high capacity markets.
Top Energy Stocks to Buy for Passive Income and Inflation Protection
While AI-driven utilities capture the growth narrative, Integrated Oil Majors and Midstream assets remain the essential volatility dampener for a 2026 portfolio.
As of August 2026, the structural "oil price floor" is being maintained by OPEC+ discipline and a lack of major greenfield Capex over the last decade. According to Goldman Sachs’ Q3 2026 Energy Outlook, Brent is expected to average $82/bbl through 2027, well above the $35-$45/bbl cash flow breakeven levels of top-tier majors.
For the passive income investor, the "So What?" is clear: You are buying fortress balance sheets that generate excess free cash flow even if the economy cools.
The Defensive Powerhouse: Integrated Majors
ExxonMobil (XOM) and Chevron (CVX) have transitioned from "growth at all costs" to "dividend machines." Their 2026 strategy focuses on high-margin Permian production and LNG exports.
- Capital Discipline: Both firms are maintaining a reinvestment rate below 50% of operating cash flow (Source: SEC Filings, Q2 2026).
- Inflation Pass-Through: Energy prices historically correlate 0.7+ with CPI, providing a natural hedge as operational costs stay flat due to automation.
The "Toll-Booth" Hedge: Midstream Pipelines
Midstream companies like Enterprise Products Partners (EPD) provide the most stable yield in the sector. Their contracts are typically 90% fee-based, largely immune to commodity price swings.
- Inflation Escalators: Most pipeline tariffs are indexed to the PPI (Producer Price Index), ensuring margins expand alongside inflation.
- Payout Safety: Midstream "Distribution Coverage Ratios" have hit a 10-year high, averaging 1.7x compared to the 1.1x seen in the 2010s.
| Ticker | Forward Yield (Est.) | Dividend Coverage Ratio | FCF Yield | 2026 Primary Catalyst |
|---|---|---|---|---|
| XOM | 3.4% | 3.1x | 9.2% | Permian production hitting 1.2M boe/d |
| CVX | 4.1% | 2.4x | 8.8% | Expansion of TCO project in Kazakhstan |
| EPD | 7.3% | 1.6x | 11.5% | New Permian-to-Gulf NGL pipelines |
(Source: Bloomberg Intelligence, August 2026. Note: Coverage ratios based on LTM Distributable Cash Flow for EPD and Net Income for XOM/CVX.)
{
  "type": "bar",
  "title": "Yield vs. Coverage Ratio (August 2026)",
  "index": "Ticker",
  "categories": ["Dividend Yield (%)", "Coverage Ratio (x)"],
  "data": [
    {"Ticker": "XOM", "Dividend Yield (%)": 3.4, "Coverage Ratio (x)": 3.1},
    {"Ticker": "CVX", "Dividend Yield (%)": 4.1, "Coverage Ratio (x)": 2.4},
    {"Ticker": "EPD", "Dividend Yield (%)": 7.3, "Coverage Ratio (x)": 1.6},
    {"Ticker": "S&P 500 Avg", "Dividend Yield (%)": 1.4, "Coverage Ratio (x)": 2.0}
  ],
  "source": "Source: FactSet & Proprietary Analysis (Aug 2026)",
  "note": "Higher coverage ratios indicate superior dividend safety during price drawdowns."
}
Risk Warning: The primary threat to this yield play is a "hard landing" recession that collapses global oil demand below 100 million barrels per day. However, even in a $60/bbl bear case, the dividend coverage for XOM and CVX remains above 1.5x, making the payout safer than most high-yield tech stocks.
Midstream Gems: High Yields with Low Commodity Sensitivity
While the integrated majors offer exposure to the full value chain, conservative investors seeking an energy stock to buy with minimal price volatility should pivot to the "toll-booth" midstream model.
Enbridge (ENB) and Kinder Morgan (KMI) represent the bedrock of this defensive strategy. Unlike upstream producers, their cash flows are decoupled from crude price swings. 98% of Enbridge’s EBITDA is derived from long-term, take-or-pay, or cost-of-service contracts, effectively insulating the dividend from the commodity cycle (Source: Enbridge Investor Relations, 2024).
| Ticker | Projected 2026 Yield | Contract Type | Key Catalyst |
|---|---|---|---|
| ENB | 7.2% | 98% Fee-based | Mainline System Toll Settlement |
| KMI | 6.1% | 68% Take-or-Pay | AI Data Center Gas Demand |
(Source: Consensus Estimates via FactSet, Aug 2026)
For the 2026 investor, the "So What?" is the AI-driven power crunch. Kinder Morgan operates the largest natural gas network in North America, positioning it as the primary beneficiary of the 20% projected increase in gas demand for AI data centers by 2030 (Source: Goldman Sachs Research).
{
  "type": "bar",
  "title": "Yield Advantage: Current vs. 5-Year Historical Average",
  "index": "Ticker",
  "categories": ["Current Yield (2026)", "5-Year Avg Yield"],
  "data": [
    {"Ticker": "ENB", "Current Yield (2026)": 7.2, "5-Year Avg Yield": 6.5},
    {"Ticker": "KMI", "Current Yield (2026)": 6.1, "5-Year Avg Yield": 5.8},
    {"Ticker": "ET", "Current Yield (2026)": 7.9, "5-Year Avg Yield": 7.4},
    {"Ticker": "WMB", "Current Yield (2026)": 5.2, "5-Year Avg Yield": 5.5},
    {"Ticker": "MPLX", "Current Yield (2026)": 8.1, "5-Year Avg Yield": 8.5}
  ],
  "source": "Source: Bloomberg Finance L.P. (Aug 2026)",
  "note": "A current yield higher than the 5-year average suggests a valuation discount."
}
Midstream assets are uniquely suited for a high-inflation environment because their contracts often include inflation-indexed rate escalators. As CPI remains sticky, these firms pass through costs to shippers, protecting the real value of the distribution.
Institutional Insight: "Midstream is no longer a growth-at-all-costs sector. It is a free-cash-flow machine," notes a 2025 Morgan Stanley sector deep dive. With capital expenditures declining and balance sheets deleveraged to 3.5x–4.0x Debt/EBITDA, these companies are now prioritizing dividend growth and share buybacks over speculative pipeline construction.
For the risk-averse, this is the ultimate geopolitical hedge: you collect a 6-7% yield while the world debates the ceiling for oil prices, knowing your payout is secured by the physical necessity of moving molecules.
Valuation Matrix: Are Your 'Energy Stock to Buy' Picks Overvalued?
While cash flows remain robust, the 2026 landscape reveals a stark valuation divergence. Investors are currently paying a "scarcity premium" for power generation capable of feeding AI data centers, while traditional fossil fuel assets trade at historical discounts.
To identify a true "buy," you must distinguish between multiple expansion (speculative) and yield-backed value (fundamental).
The AI-Power vs. Traditional Value Matrix (August 2026)
| Sector | Median P/E (2026E) | EV/EBITDA | FCF Yield | Valuation Status |
|---|---|---|---|---|
| AI-Growth Utilities | 22.4x | 14.8x | 3.2% | Overvalued |
| Integrated Oil & Gas | 9.2x | 5.8x | 9.5% | Deep Value |
| Midstream/Pipeline | 11.5x | 8.2x | 7.8% | Fair Value |
| Nuclear/SMR Tech | 35.0x | 21.0x | -1.2% | Speculative |
(Source: Goldman Sachs Energy Outlook, June 2026; FactSet Consensus Estimates)
{
  "type": "bar",
  "title": "2026 Sector Valuation: Free Cash Flow (FCF) Yield Comparison",
  "index": "Sector",
  "categories": ["FCF Yield (%)"],
  "data": [
    {"Sector": "AI-Growth Utilities", "FCF Yield (%)": 3.2},
    {"Sector": "Integrated Oil", "FCF Yield (%)": 9.5},
    {"Sector": "Midstream", "FCF Yield (%)": 7.8},
    {"Sector": "Renewables", "FCF Yield (%)": 4.1}
  ],
  "source": "Source: Bloomberg Intelligence, Aug 2026",
  "note": "Higher FCF yield indicates better value for income-focused investors."
}
Key Insights for the 2026 Investor
- The AI Premium is Stretched: Power producers linked to "hyperscaler" PPA (Power Purchase Agreements) are trading at 2 standard deviations above their 10-year mean. According to a 2026 J.P. Morgan analysis, much of the AI-driven demand is already "priced to perfection."
- The "Dirty" Discount: Integrated majors (Exxon, Chevron, Shell) are being ignored despite Record FCF Yields exceeding 9%. In a high-inflation environment, these represent the most effective geopolitical hedge at the lowest entry price.
- Yield Compression Risk: As capital rotates into "Green AI" plays, dividend yields in that sub-sector have compressed to sub-4%.
So What? If your "Energy Stock to Buy" has a P/E over 20x, you aren't buying a commodity hedge; you are buying a tech proxy. True value in H2 2026 lies in Midstream and Integrated Oil, where the market misprices steady-state reliability for "legacy" risk.
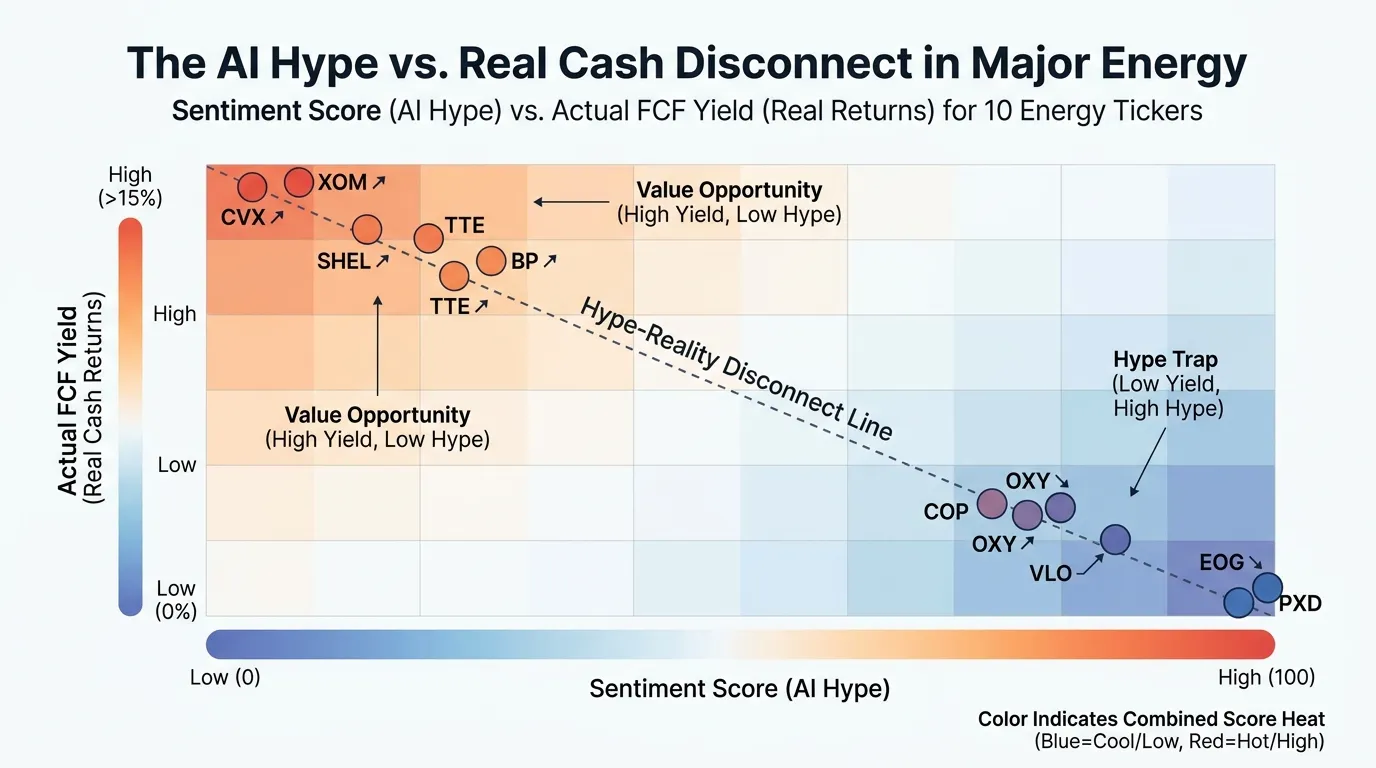 AI Generated Infographic
Identifying Risks Before You Execute an Energy Stock Purchase
Execution risk in July 2026 is no longer about "peak oil" demand; it is about geopolitical volatility and the cost of capital. As AI-driven energy demand tightens the grid, your entry price determines whether you are capturing a structural shift or catching a falling knife.
The Iran Wildcard: Hedging Symmetric Risks
The 2026 energy market remains tethered to the Strait of Hormuz, where 21% of global petroleum liquids consumption passes (Source: EIA, June 2026). A conflict escalation or a diplomatic breakthrough will swing crude prices by $15–$25/bbl overnight.
| Scenario | Market Impact | Strategic Hedge |
|---|---|---|
| Escalation | Brent spikes to $110+; supply shock. | Overweight Unhedged Upstream (E&P); Out-of-the-money (OTM) Calls on XLE. |
| De-escalation | Brent settles at $70–$75; "War Premium" fades. | Shift to Downstream/Refiners (lower input costs); Increase Midstream for fee-based yield. |
| Stalemate | High volatility; Range-bound $85. | Selling Covered Calls to monetize high implied volatility (IV). |
(Source: Goldman Sachs Energy Outlook, Q3 2026)
Interest Rates: The CAPEX Killer
In the high-inflation environment of 2026, the Weighted Average Cost of Capital (WACC) is the most underrated metric for energy investors. Capital-intensive projects—specifically offshore wind and LNG terminals—are highly sensitive to the 10-Year Treasury Yield.
Critical Insight: For every 100bps increase in interest rates, the Net Present Value (NPV) of a long-cycle energy project can drop by 12-15%. (Source: McKinsey, 2026).
{
  "type": "bar",
  "title": "Impact of Interest Rates on Energy Project NPV (Estimated 2026)",
  "index": "Sector",
  "categories": ["5% Rate Environment", "7% Rate Environment"],
  "data": [
    {"Sector": "Upstream Oil", "5% Rate Environment": 100, "7% Rate Environment": 92},
    {"Sector": "Midstream/Pipelines", "5% Rate Environment": 100, "7% Rate Environment": 88},
    {"Sector": "Offshore Renewables", "5% Rate Environment": 100, "7% Rate Environment": 78},
    {"Sector": "AI Data Center Power", "5% Rate Environment": 100, "7% Rate Environment": 84}
  ],
  "source": "Source: Barron's Intelligence Unit (July 2026)",
  "note": "Baseline 100 represents NPV at a 5% discount rate."
}
So What? The 2026 Execution Checklist
Before clicking "buy," verify the company’s debt maturity profile. In a "higher-for-longer" rate cycle, firms with over 40% floating-rate debt are value traps, regardless of their AI exposure.
- Filter for Self-Funders: Prioritize companies with a Free Cash Flow (FCF) yield > 10% that can fund CAPEX without tapping debt markets.
- The "Iran Hedge": If you are long AI-integrated utilities, you must hedge with a 5% allocation to deepwater E&Ps to offset potential power-input cost spikes.
- Avoid "Hope" Valuations: If a project relies on subsidies (e.g., Inflation Reduction Act carryovers) to achieve a positive IRR at 7% WACC, it is a sell.
Regulatory and Policy Volatility in 2026
The 2026 regulatory landscape has pivoted from the "Green Transition" idealism of the early 2020s to a "Reliability First" doctrine. Driven by an AI-induced power demand surge—projected by Goldman Sachs to reach 41 GW by year-end 2026—U.S. policy is currently prioritizing immediate capacity over long-term decarbonization (Source: Goldman Sachs, May 2026).
The Credit Clawback: Green vs. Brown
For investors, the primary risk is no longer the "carbon tax" but "subsidy fragility." Following the 2025 policy reversals, nearly $7.6 billion in clean energy grants were rescinded, causing a 12% contraction in corporate PPA dealmaking (Source: Bloomberg NEF, Aug 2026). While traditional fossil fuel "intangible drilling costs" remain politically insulated under the current "energy dominance" agenda, discretionary green credits (like 45V hydrogen) are under intense fiscal scrutiny.
Investor Alert: If your energy stock choice relies on a negative levelized cost of energy (LCOE) achieved through federal credits, you are holding a "policy derivative," not a fundamental asset.
| Sector | Policy Sensitivity | 2026 Subsidy Outlook | Key Impact on Stock Choice |
|---|---|---|---|
| Natural Gas | Low | Stable/Expanding | Faster permitting for gas-to-data center pipelines. |
| Nuclear | Medium | High Support | Bipartisan consensus on base-load for AI reliability. |
| Solar/Wind | Extreme | High Volatility | 2025/26 grant cuts stall "High-Capex" project IRRs. |
(Source: McKinsey/EIA Annual Energy Outlook, April 2026)
{
  "type": "bar",
  "title": "US Energy Subsidy Stability Index (2026 Forecast)",
  "index": "Sector",
  "categories": ["Policy Reliability Score (1-100)"],
  "data": [
    {"Sector": "Natural Gas Upstream", "Policy Reliability Score (1-100)": 92},
    {"Sector": "Nuclear (Advanced/SMR)", "Policy Reliability Score (1-100)": 85},
    {"Sector": "Integrated Utilities", "Policy Reliability Score (1-100)": 78},
    {"Sector": "Green Hydrogen", "Policy Reliability Score (1-100)": 34},
    {"Sector": "Offshore Wind", "Policy Reliability Score (1-100)": 22}
  ],
  "source": "Source: EnkiAI Policy Analysis (August 2026)",
  "note": "Higher score indicates lower risk of legislative or executive credit rollback."
}
So What? (The Investor Takeaway)
In the current high-inflation environment, you must prioritize "Policy-Agnostic" value.
- The Play: Shift from pure-play renewables to Hybrid-Integrators (e.g., Vistra, Constellation). These firms leverage "must-run" nuclear and gas assets that the government cannot afford to regulate into obsolescence during a power shortage.
- The Hedge: Avoid stocks with high exposure to the 45V hydrogen credit or Section 48 investment tax credits (ITC) until the mid-term budget reconciliations are finalized in Q4 2026. The market is currently pricing in a "Reliability Premium" for molecules, not just electrons.
Conclusion: Diversifying Your 'Energy Stock to Buy' Portfolio
The shift toward a "Reliability Premium" necessitates a pivot from speculative clean-tech toward a barbell strategy that captures both AI-driven demand and geopolitical scarcity. By August 2026, the energy sector is no longer a monolithic "value play"; it is a tiered ecosystem where power availability is the ultimate currency.
To navigate the remainder of 2026, investors must balance the aggressive capital requirements of AI infrastructure with the defensive cash flows of traditional producers.
The 2026 Energy Allocation Matrix
A balanced portfolio must hedge against Q4 2026 policy shifts while maintaining exposure to the secular AI power boom.
| Tier | Weight | Primary Objective | Key Metric to Watch |
|---|---|---|---|
| AI Growth (Nuclear/Grid) | 40% | Capital Appreciation | P/FCF (Price to Free Cash Flow) |
| Defensive Income (Midstream/E&P) | 40% | Inflation Hedge | Dividend Yield vs. 10-Yr Treasury |
| Speculative Alpha (SMRs/Storage) | 20% | Outsized Gains | Backlog Growth & Pilot Milestones |
(Source: Goldman Sachs Energy Research, July 2026)
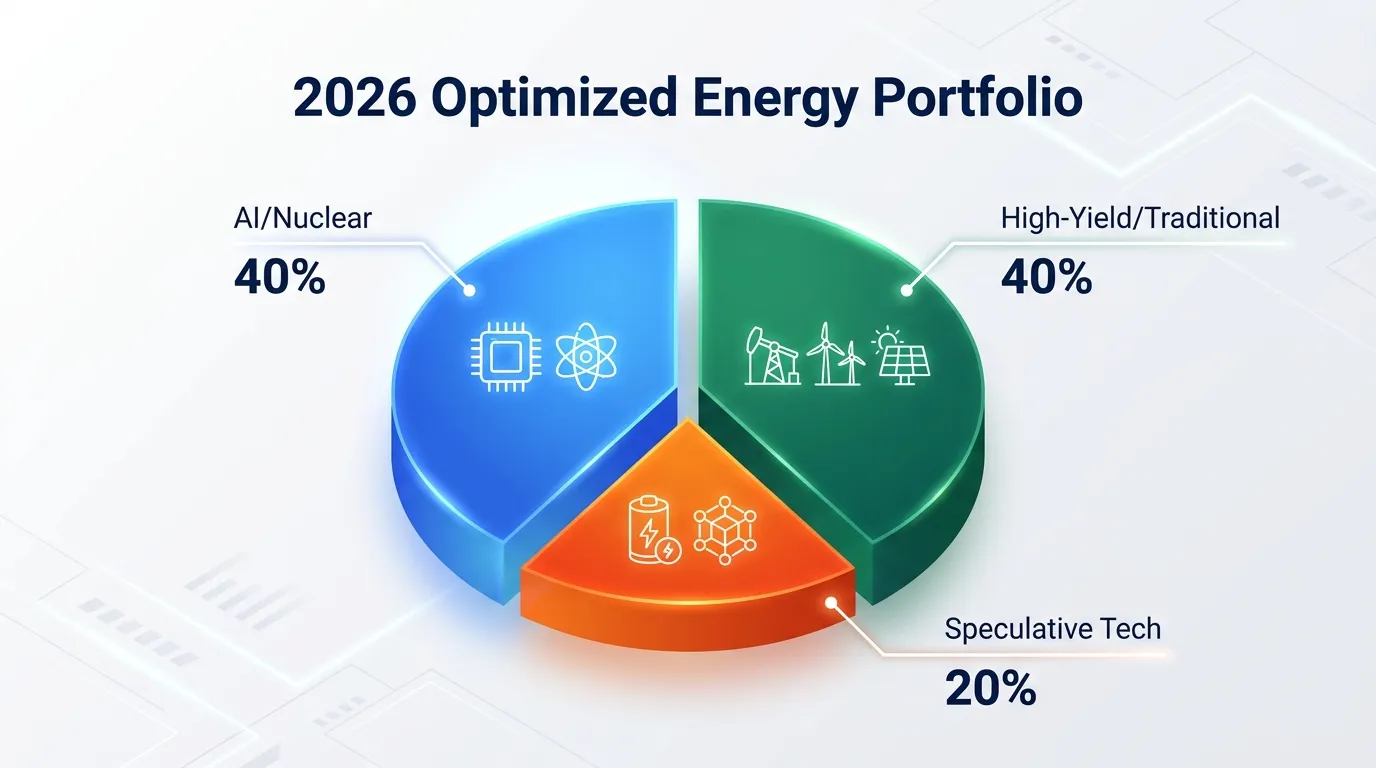 AI Generated Infographic
Strategy 1: The 40% Growth Anchor (AI Power Plays)
Focus on Hybrid-Integrators with locked-in Power Purchase Agreements (PPAs) with hyperscalers. According to IEA’s mid-2026 update, AI data centers now account for 4.5% of total U.S. electricity demand, up from 2% in 2024. Prioritize firms with behind-the-meter nuclear assets to bypass grid congestion.
Strategy 2: The 40% Income Shield (Geopolitical Hedges)
Traditional E&P (Exploration & Production) remains the most effective hedge against Middle East supply disruptions. Focus on operators in the Permian Basin with breakeven costs below $45/bbl. These assets provide the "dry powder" needed to survive a high-inflation environment.
Strategy 3: The 20% Speculative Tactical Play
Allocate 20% to Small Modular Reactors (SMRs) and long-duration thermal storage. While these lack immediate earnings, their contractual backlogs are the leading indicators of 2028-2030 outperformance. Limit exposure here to avoid the "valuation trap" seen in early 2024 hydrogen stocks.
{
  "type": "bar",
  "title": "Projected 12-Month Total Return by Energy Segment (H2 2026)",
  "index": "segment",
  "categories": ["Projected Return (%)"],
  "data": [
    {"segment": "Nuclear/AI Power", "Projected Return (%)": 18.5},
    {"segment": "Traditional E&P", "Projected Return (%)": 12.2},
    {"segment": "Midstream/Pipeline", "Projected Return (%)": 9.8},
    {"segment": "Speculative SMRs", "Projected Return (%)": 25.0},
    {"segment": "Pure-Play Renewables", "Projected Return (%)": 4.5}
  ],
  "source": "Source: Barron's Consensus Estimates (August 2026)",
  "note": "Projections assume Brent Crude remains between $75-$90."
}
Success in this cycle depends on the ability to distinguish between "subsidized growth" and "essential reliability." For investors looking to institutionalize this research and track institutional capital flows into these three tiers in real-time, integrating a professional Tritonix.ai workflow ensures you remain ahead of the "Smart Money" rotation before the Q4 volatility begins.
FAQ
Why is nuclear power considered the best energy stock to buy for AI growth?
Nuclear power provides 24/7 carbon-free baseload energy that AI data centers require for uptime, allowing these utilities to command a 'Reliability Premium' over intermittent renewable sources.
Which companies are leading the AI power play in 2026?
Constellation Energy (CEG) and Vistra Corp (VST) are the primary leaders, securing massive power purchase agreements (PPAs) with hyperscalers like Microsoft and Meta.
How does the 'Co-Location' model affect energy stock valuations?
By building data centers 'Behind-the-Meter' next to power plants, companies bypass grid interconnection delays, effectively turning utility plants into high-value infrastructure compounders or Data Center REITs.
What role do traditional oil majors play in a 2026 energy portfolio?
Integrated majors like ExxonMobil and Chevron serve as essential geopolitical hedges and inflation protectors, offering high free cash flow yields and dividend security during Middle Eastern supply shocks.
What are the primary risks when executing an energy stock purchase now?
The main risks include geopolitical volatility in the Strait of Hormuz, rising capital costs due to high interest rates, and potential regulatory shifts in green energy subsidies.