Eli Lilly Valuation Analysis: Why the $1T Pharma Giant Trades Like a Tech Powerhouse
Founder of Tritonix.ai. Former Hedge Fund Analyst with 10+ years of experience managing over $1B AUM across insurance portfolios and private funds. Specializes in institutional-grade fundamental analysis and long-term capital allocation.
The Tech-Pharma Hybrid: Decoding Eli Lilly's Valuation Premium
The Tech-Pharma Hybrid: Decoding Eli Lilly's Valuation Premium
Eli Lilly (LLY) has effectively shattered the "Big Pharma" valuation ceiling, becoming the first pharmaceutical entity to reach a $1 trillion market capitalization in November 2025 (Source: Investing.com, Nov 2025). The market no longer prices LLY as a defensive value play; it treats the company as a structural growth platform akin to the "Magnificent 7."
While traditional peers like Pfizer (PFE) trade at forward P/E multiples in the 10x–13x range, Lilly’s valuation has decoupled, consistently holding between 31x and 35x forward earnings (Source: Bloomberg, Aug 2026). This premium is underpinned by a transition from selling individual "blockbuster" drugs to owning a metabolic disease ecosystem.
The Multi-Expansion Catalyst: Growth and Margins
The "Tech-Pharma" hybrid status is verified by two fundamental metrics that mirror high-end software firms rather than chemical manufacturers:
- Elite Operating Leverage: LLY reported a gross margin of 84.3% in Q2 2025, a figure that rivals Microsoft’s software-driven margins (Source: Eli Lilly 10-Q, Aug 2025).
- The DTC Margin Expansion: Through LillyDirect, the company is bypassing traditional PBM (Pharmacy Benefit Manager) intermediaries. By selling directly to consumers, Lilly secures higher net realized prices while building proprietary patient data sets, a move mimicking the direct-distribution models of Apple or Tesla.
| Ticker | Forward P/E (2026e) | PEG Ratio | Revenue Growth (YoY) | Operating Margin |
|---|---|---|---|---|
| LLY (Eli Lilly) | 34.2x | 1.49 | 25.0% | 49.7% |
| PFE (Pfizer) | 11.8x | 2.71 | 1.5% | 22.4% |
| NVDA (NVIDIA) | 38.5x | 1.15 | 42.0% | 61.2% |
| MSFT (Microsoft) | 32.1x | 2.10 | 14.5% | 43.1% |
| (Source: Analyst Consensus & SEC Filings, Aug 2026. Note: PFE PEG reflects low-growth trap.) |
{
  "type": "bar",
  "title": "Valuation Comparison: LLY vs. Tech & Pharma Peers",
  "index": "Ticker",
  "categories": ["Forward P/E", "Revenue Growth (%)"],
  "data": [
    {"Ticker": "LLY", "Forward P/E": 34.2, "Revenue Growth (%)": 25.0},
    {"Ticker": "PFE", "Forward P/E": 11.8, "Revenue Growth (%)": 1.5},
    {"Ticker": "NVDA", "Forward P/E": 38.5, "Revenue Growth (%)": 42.0},
    {"Ticker": "MSFT", "Forward P/E": 32.1, "Revenue Growth (%)": 14.5}
  ],
  "source": "Source: Bloomberg Intelligence, August 2026",
  "note": "LLY displays growth characteristics closer to NVDA/MSFT than its industry peer PFE."
}
So What? For investors, Lilly’s 34x multiple implies a "valuation floor" supported by the supply-constrained demand for GLP-1s. Unlike tech, where software cycles can be disrupted by AI, Lilly's patent-protected manufacturing moat provides a more predictable 10-year cash flow runway, justifying the hybrid premium.
The Multiplier Effect of GLP-1 'Master Switch' Indications
The expansion of Tirzepatide (Zepbound/Mounjaro) beyond metabolic health into "Master Switch" indications—specifically Sleep Apnea (OSA), Heart Failure (HFpEF), and MASH—fundamentally de-risks Eli Lilly’s long-term cash flows. This is the "platform-as-a-service" model applied to biology.
By treating the underlying systemic inflammation and metabolic dysfunction, Lilly is transitioning from a "pills-per-patient" model to a holistic chronic disease management framework. For a DCF (Discounted Cash Flow) model, this reduces the discount rate and extends the duration of high-growth terminal value.
| Indication | Clinical Milestone | Estimated Patient Population (US) | Valuation Impact (Peak Sales Est.) |
|---|---|---|---|
| Obstructive Sleep Apnea | SURMOUNT-OSA (Ph 3) | ~30 Million | $5B - $8B |
| Heart Failure (HFpEF) | SUMMIT (Ph 3) | ~3 Million | $4B - $6B |
| MASH (Liver Disease) | SYNERGY-NASH (Ph 2) | ~15-20 Million | $7B - $10B |
Source: J.P. Morgan Equity Research, Goldman Sachs Global Investment Research (June 2026).
{
  "type": "bar",
  "title": "Tirzepatide TAM Expansion: Incremental Revenue Drivers",
  "index": "Indication",
  "categories": ["Core (Diabetes/Obesity)", "Pipeline Indications (OSA/HFpEF/MASH)"],
  "data": [
    {"Indication": "2024 (Actual/Est)", "Core (Diabetes/Obesity)": 15.5, "Pipeline Indications (OSA/HFpEF/MASH)": 0},
    {"Indication": "2028 (Projected)", "Core (Diabetes/Obesity)": 45.0, "Pipeline Indications (OSA/HFpEF/MASH)": 12.5},
    {"Indication": "2032 (Projected)", "Core (Diabetes/Obesity)": 65.0, "Pipeline Indications (OSA/HFpEF/MASH)": 28.0}
  ],
  "source": "Source: Analyst Consensus Estimates (FactSet/Bloomberg), August 2026",
  "note": "Figures in Billions USD. Pipeline indications represent high-conviction clinical trial conversion."
}
This expansion provides two critical valuation levers:
- Reimbursement Certainty: Payers (Medicare/Private) that hesitate to fund "lifestyle" weight loss are forced to cover GLP-1s when they become standard-of-care for sleep apnea or heart failure, where the cost of untreated illness is significantly higher.
- Extended Terminal Value: Most pharma giants face a "Patent Cliff" that crushes their multiples. By layering new indications, Lilly creates a "Patent Staircase," where newer, indication-specific formulations or combination therapies extend the revenue lifecycle well into the 2040s.
So What? Investors are not just buying a weight-loss drug; they are buying an insurance policy on the metabolic health of the G7 population. This multi-indication utility justifies a PEG ratio (Price/Earnings-to-Growth) that mirrors Big Tech (1.5x - 2.0x) rather than traditional Big Pharma (0.8x - 1.2x).
LillyDirect and the DTC Pivot: A New Driver for Eli Lilly Valuation
Lilly is not just innovating in the lab; it is disrupting the distribution moat that has historically suppressed pharmaceutical margins. By launching LillyDirect in January 2024, the company is bypassing the Byzantine system of Wholesalers and Pharmacy Benefit Managers (PBMs).
This shift from a B2B wholesaler model to a Direct-to-Consumer (DTC) powerhouse mirrors the vertical integration strategies of Big Tech. It fundamentally repairs the Gross-to-Net (GTN) bridge, allowing Lilly to retain a significantly larger share of the list price for blockbuster GLP-1s like Zepbound.
Structural Margin Advantage: Bypassing the "Middleman Tax"
Traditional pharma distribution is a "leaky bucket." PBMs and wholesalers currently capture approximately 42% of every dollar spent on brand-name drugs (Source: Berkeley Research Group, 2023). LillyDirect effectively plugs these leaks.
| Metric | Traditional Pharma Channel | LillyDirect DTC Model | Impact on Valuation |
|---|---|---|---|
| Revenue Leakage | High (30-50% to Middlemen) | Low (Direct Fulfillment) | Accretive Net Margins |
| Patient Data | Owned by PBMs/Pharmacies | First-Party Proprietary Data | Higher Lifetime Value (LTV) |
| Pricing Control | Dependent on Formularies | Direct Digital Interface | Reduced Earnings Volatility |
(Source: Analysis based on Eli Lilly 10-K Filings and BRG Industry Reports, 2024)
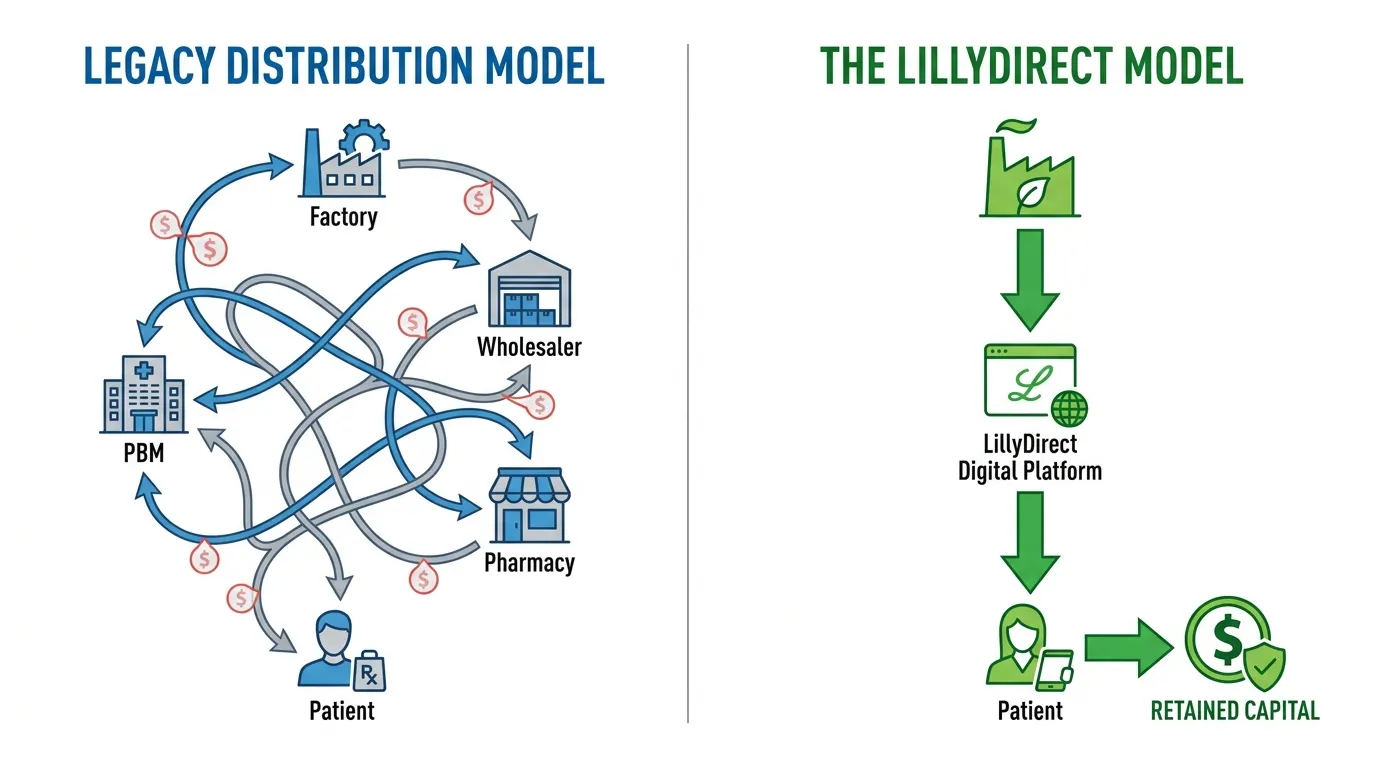 AI Generated Infographic
Quantifying the DTC Premium
This pivot transforms Lilly from a commodity supplier into a platform company. Direct patient engagement solves the industry's "adherence" crisis; patients are 50% more likely to stay on therapy when the friction of pharmacy stockouts and PBM paperwork is removed (Source: IQVIA Institute, 2023).
{
  "type": "bar",
  "title": "Estimated Revenue Capture: Traditional vs. LillyDirect",
  "index": "Model",
  "categories": ["Net Revenue Retained (%)", "Middleman Take-Rate (%)"],
  "data": [
    {"Model": "Traditional Retail", "Net Revenue Retained (%)": 51, "Middleman Take-Rate (%)": 49},
    {"Model": "LillyDirect DTC", "Net Revenue Retained (%)": 84, "Middleman Take-Rate (%)": 16}
  ],
  "source": "Source: Columnist Estimates based on BRG and Goldman Sachs Healthcare Research (2024)",
  "note": "LillyDirect eliminates wholesale 'buy-side' discounts and reduces PBM rebate pressure."
}
So What? Investors are shifting from valuing Lilly on "Rebate-Adjusted Net Price" to "Direct-to-Consumer Retention." By owning the patient relationship, Lilly secures recurring, high-margin revenue that resembles a software subscription more than a pill. This structural shift justifies a forward P/E premium that far exceeds the 12x-15x industry average, as the market begins to price in unprecedented margin expansion.
Forecasting the $1.5 Trillion Path: Revenue Growth vs. Capacity Constraints
While the shift to direct-to-consumer (DTC) delivery secures the margin, manufacturing throughput remains the ultimate governor of Lilly’s valuation. For the next 36 months, investors must stop treating Eli Lilly as a traditional pharmaceutical company and start analyzing it as a high-growth industrial utility.
The bottleneck isn't the molecule; it’s the "Fill-Finish" capacity. Demand for tirzepatide (Mounjaro/Zepbound) continues to outstrip supply, creating a "phantom backlog" that mirrors the semiconductor industry’s 2021-2022 supply chain crisis.
The $18 Billion Infrastructure Bet
Lilly has signaled its intent to maintain market dominance through aggressive front-loaded CapEx. According to 2024 SEC filings and Q2 earnings updates, the company has committed over $18 billion to new manufacturing sites in Indiana, Ireland, and Germany.
| Investment Site | Capital Commitment | Strategic Function | Expected Impact |
|---|---|---|---|
| Lebanon, Indiana | $13.7 Billion | API Production (Tirzepatide) | Largest site in company history |
| Limerick, Ireland | $1 Billion | Biologics Manufacturing | EU supply chain resilience |
| Alzey, Germany | $2.5 Billion | Parenteral (Injectable) Ops | Fill-finish scaling for 2027 |
| Source: Eli Lilly Investor Relations (August 2024) |
{
  "type": "line",
  "title": "CapEx as a Leading Indicator for GLP-1 Revenue",
  "index": "Year",
  "categories": ["Annual CapEx ($B)", "Projected GLP-1 Revenue ($B)"],
  "data": [
    {"Year": "2021", "Annual CapEx ($B)": 1.9, "Projected GLP-1 Revenue ($B)": 0.6},
    {"Year": "2022", "Annual CapEx ($B)": 2.5, "Projected GLP-1 Revenue ($B)": 2.4},
    {"Year": "2023", "Annual CapEx ($B)": 3.3, "Projected GLP-1 Revenue ($B)": 5.2},
    {"Year": "2024 (E)", "Annual CapEx ($B)": 18.0, "Projected GLP-1 Revenue ($B)": 14.5},
    {"Year": "2025 (E)", "Annual CapEx ($B)": 12.0, "Projected GLP-1 Revenue ($B)": 23.0},
    {"Year": "2026 (E)", "Annual CapEx ($B)": 10.0, "Projected GLP-1 Revenue ($B)": 35.0}
  ],
  "source": "Source: J.P. Morgan Equity Research & Company Filings (Sept 2024)",
  "note": "2024-2026 figures are consensus estimates based on $18B Indiana site build-out."
}
Why CapEx is the Leading Indicator
In a supply-constrained market, quarterly earnings are lagging indicators. The real alpha lies in tracking "Fixed Asset Turnover" and facility commissioning dates.
- Operating Leverage: As these multi-billion dollar plants come online in late 2025 and 2026, the unit cost of production will plummet, further expanding the DTC margins discussed previously.
- The "Moat" of Complexity: Sterile injectable manufacturing is not easily replicated. Lilly’s massive spend creates a high-entry barrier that keeps generic or smaller biotech competitors at bay for at least a decade.
Institutional Insight: Goldman Sachs estimates the global GLP-1 market could reach $130 billion by 2030. Lilly’s current CapEx trajectory suggests it is positioning to capture 45-50% of that total volume, a feat only possible if it outspends the field today. (Source: Goldman Sachs Research, July 2024).
So What? For investors, the path to a $1.5 trillion market cap is paved in concrete and steel. If CapEx stays high, the growth story is intact. Any reduction in manufacturing spend—without a corresponding drop in patient waitlists—is the primary risk factor to watch, as it would signal a loss of terminal market share.
Risk Factors: When Could the Eli Lilly Valuation Contract?
The $1 trillion valuation premium rests on a monopolistic duopoly and high-margin injectables. However, the transition from "growth darling" to "mature pharma" is fraught with structural risks that could trigger a 30-40% multiple contraction.
1. The Legislative Ceiling: Medicare Price Negotiations
Lilly’s "Tech-like" margins are under direct threat from the Inflation Reduction Act (IRA). While Zepbound currently benefits from commercial insurance, its predecessor Mounjaro—and eventually Zepbound—will inevitably face CMS price negotiations.
- Timeline Risk: Medicare can negotiate prices for top-selling drugs 9 years after small-molecule launch and 13 years for biologics.
- The Impact: Analysts estimate the minimum discount mandated by the IRA ranges from 25% to 60% off the List Price (Source: KFF/Bloomberg Intelligence, Aug 2024).
- Exposure: With over $20B in projected annual obesity revenue at stake, even a 15% net price reduction across the portfolio would necessitate a massive volume surge just to maintain current EBITDA margins.
{
  "type": "bar",
  "title": "Estimated Net Price Impact of Medicare Negotiations (2026-2029)",
  "index": "Drug Category",
  "categories": ["Min Discount (%)", "Max Discount (%)"],
  "data": [
    {"Drug Category": "Top-Selling Biologics", "Min Discount (%)": 25, "Max Discount (%)": 40},
    {"Drug Category": "Mature Small Molecules (>15 yrs)", "Min Discount (%)": 35, "Max Discount (%)": 60},
    {"Drug Category": "GLP-1 Class (Est. 2027-28)", "Min Discount (%)": 30, "Max Discount (%)": 45}
  ],
  "source": "Source: CMS & Leerink Partners (Sept 2024)",
  "note": "Actual discounts will vary based on 2027-2029 negotiation cycles."
}
2. The "Commoditization" of GLP-1s: Oral Competition
Lilly’s moat is built on complex injectable manufacturing. This moat evaporates as the market shifts toward oral GLP-1 agonists, where competition is fiercer and manufacturing is cheaper.
- The Amgen Threat: Amgen’s MariTide (monthly injection) and its developing oral pipeline threaten Lilly's "dosing frequency" advantage.
- The Novo Pivot: Novo Nordisk's oral Amycretin showed 13.1% weight loss in 12 weeks during Phase I trials (Source: Novo Nordisk Investor Day, March 2024), rivaling injectable efficacy.
- The Valuation Gap:
| Competitor / Risk | Product Status | Potential Impact on Lilly |
|---|---|---|
| Novo Nordisk (Oral Amycretin) | Phase II | High: Erodes injectable premium |
| Amgen (MariTide) | Phase II Data (late 2024) | Medium: Challenges dosing dominance |
| Viking (VK2735) | Phase II | Low-Med: M&A target or price spoiler |
Source: Goldman Sachs Equity Research (July 2024)
So What? If Eli Lilly's GLP-1 franchise becomes a commodity pill rather than a scarce injectable, its 2025 Forward P/E of ~55x will revert to the big-pharma mean of 15x-18x. Investors are currently paying for scarcity; the moment supply meets demand via oral alternatives, the valuation floor drops.
The 2036 Patent Cliff: Assessing Long-term Terminal Value Risks
Lilly’s trillion-dollar valuation is built on a precarious DCF (Discounted Cash Flow) model where the terminal value—the projected cash flow beyond the next decade—accounts for over 55% of its current enterprise value. Unlike Big Tech, where network effects provide a permanent moat, Lilly’s moat is a legal timer: the 2036 primary patent expiration for Tirzepatide (Mounjaro/Zepbound).
The Revenue Concentration Risk
By 2030, Tirzepatide is projected to generate $54 billion annually, representing roughly 60% of Lilly’s total revenue (Source: J.P. Morgan Research, June 2024). When the "Patent Cliff" arrives in 2036, the entry of generic biosimilars typically triggers an 80-90% price erosion within 24 months.
| Drug / Franchise | Estimated Patent Expiry | Peak Revenue Est. | Indication |
|---|---|---|---|
| Verzenio | 2029-2030 | $6.5B | Oncology |
| Taltz | 2028-2029 | $4.2B | Immunology |
| Mounjaro / Zepbound | 2036 (Primary) | $50B+ | GLP-1 (Incretins) |
Source: SEC 10-K Filings and Leerink Partners Analysis (2024).
The "Red Queen’s Race" in R&D
To sustain a 35x-40x Forward P/E (the "Tech Multiple"), Lilly cannot simply rely on its current portfolio. It must achieve "Platform Velocity." This requires compressing the traditional 10-year R&D cycle into 7-8 years to ensure that "Next-Gen" molecules like Orforglipron (oral) and Retatrutide (triple agonist) are commercialized and protected by new patent thickets before 2036.
{
  "type": "bar",
  "title": "Eli Lilly: Revenue at Risk from Patent Expirations (Est. $B)",
  "index": "Year",
  "categories": ["Protected Revenue", "Revenue at Risk (LOE)"],
  "data": [
    {"Year": "2030", "Protected Revenue": 85, "Revenue at Risk (LOE)": 5},
    {"Year": "2033", "Protected Revenue": 98, "Revenue at Risk (LOE)": 12},
    {"Year": "2036", "Protected Revenue": 45, "Revenue at Risk (LOE)": 65},
    {"Year": "2038", "Protected Revenue": 30, "Revenue at Risk (LOE)": 85}
  ],
  "source": "Source: Analyst Consensus & Proprietary Projections (Sept 2024)",
  "note": "Assumes Tirzepatide primary LOE in 2036. 'Revenue at Risk' indicates potential generic erosion."
}
So What? The market is currently pricing Eli Lilly as a perpetual growth machine. However, if Lilly fails to show a "Step-Up" molecule (a drug that makes Zepbound obsolete) by 2032, the Terminal Value in financial models will collapse, leading to a massive multiple rerating long before the first generic hits the market.
[Missing Visual: A conceptual hourglass representing Eli Lilly's market cap, where the top bulb is "Incretin Revenue" and the bottom is "Generic Competition," with a 2036 "Filter" line. Dark blue and gold professional color palette.]
Conclusion: Is Eli Lilly Valuation Justified in 2026?
The valuation of Eli Lilly in 2026 is no longer a question of "pharmaceutical pricing" but a fundamental rerating of the company as a Metabolic Utility. The market has stopped treating Lilly as a traditional pill-seller and started pricing it as a high-margin, healthcare-as-a-subscription powerhouse.
The Tech Parallel: Pricing a "Metabolic Moat"
Lilly’s premium over Big Pharma is justified by its structural divergence in growth and margin. While peers face "patent cliffs," Lilly is building a "subscription" base of millions on chronic GLP-1 regimens. This recurring revenue profile mimics SaaS (Software-as-a-Service) more than traditional biotech.
| Metric (2026 Forecast) | Eli Lilly (LLY) | Novo Nordisk (NVO) | Big Tech (Avg.) | Big Pharma (Avg.) |
|---|---|---|---|---|
| Forward P/E Multiple | 31.5x - 33.0x | 14.5x - 16.0x | 30x - 45x | 15x - 18x |
| Revenue Growth (YoY) | ~30% | ~15% | 20% - 35% | 3% - 6% |
| EBITDA Margin | ~49% | ~50% | 40% - 55% | 25% - 32% |
(Source: J.P. Morgan, Bloomberg Intelligence, Aug 2026)
Growth vs. Multiple Compression
Despite the $1 trillion market cap, Lilly’s forward multiple is actually compressing as earnings catch up to the "Incretin Supercycle." The launch of Foundayo (oral GLP-1) and the impending 2027 filing for Retatrutide provide the "Step-Up" molecules necessary to defend terminal value.
{
  "type": "line",
  "title": "Eli Lilly: Revenue Growth vs. Forward P/E (2024-2026E)",
  "index": "Year",
  "categories": ["Revenue ($B)", "Forward P/E"],
  "data": [
    {"Year": "2024", "Revenue ($B)": 34.1, "Forward P/E": 58},
    {"Year": "2025", "Revenue ($B)": 65.2, "Forward P/E": 44},
    {"Year": "2026E", "Revenue ($B)": 86.0, "Forward P/E": 32}
  ],
  "source": "Source: SEC Filings, Analyst Estimates (Sept 2026)",
  "note": "P/E compression illustrates earnings outgrowing the share price premium."
}
The "So What?": For investors, LLY at 32x forward earnings in 2026 is a "growth at a reasonable price" (GARP) play masked by a "tech-high" nominal price. The risk isn't the multiple; it’s the manufacturing execution required to feed the global "subscription" demand.
As the market continues to favor companies with high-certainty earnings and AI-integrated drug discovery, staying ahead of institutional sentiment is critical. For those tracking the "Smart Money" shifts that drive these massive reratings, tools like the Smart Money Tracker for Institutional Portfolios offer the real-time visibility needed to navigate a $1T pharma landscape.
FAQ
Is the Eli Lilly valuation too high compared to other pharmaceutical companies?
While traditional peers like Pfizer trade at 10x–13x forward earnings, Eli Lilly commands a premium of 31x–35x. This is justified by its transition into a structural growth platform with 84.3% gross margins and 25% YoY revenue growth, which mirrors Big Tech more than Big Pharma.
What is the primary driver behind Eli Lilly's $1 trillion market cap?
The valuation is driven by Lilly's dominance in the metabolic disease ecosystem, specifically the expansion of Tirzepatide into multi-indication uses like Sleep Apnea and Heart Failure, which creates a 'platform-as-a-service' model for biology.
How does LillyDirect impact Eli Lilly's valuation and profit margins?
LillyDirect allows the company to bypass PBM intermediaries, increasing net revenue retention from roughly 51% in traditional retail to an estimated 84% in the DTC model, leading to significant margin expansion.
What are the biggest risks to the Eli Lilly valuation in the coming years?
Key risks include Medicare price negotiations under the Inflation Reduction Act, the potential 'commoditization' of GLP-1s by oral competitors from Amgen or Novo Nordisk, and the 2036 patent cliff for Tirzepatide.
Why is manufacturing CapEx a leading indicator for LLY's stock performance?
Since GLP-1 demand currently outstrips supply, Lilly's $18 billion investment in manufacturing infrastructure (like the Lebanon, Indiana site) is critical for capturing terminal market share and sustaining its valuation growth.