Eli Lilly (LLY) Dividend Outlook 2026-2027: Is the 0.6% Yield Hiding a Growth Goldmine?
Founder of Tritonix.ai. Former Hedge Fund Analyst with 10+ years of experience managing over $1B AUM across insurance portfolios and private funds. Specializes in institutional-grade fundamental analysis and long-term capital allocation.
Current Dividend LLY Status: 2026 Payouts and Key Dates
For income investors, the current "dividend lly" yield of 0.6% serves as a classic "valuation mask." While a sub-1% yield typically signals a stagnant utility, for Eli Lilly, it is the byproduct of a stock price that has surged past $1,160, outstripping one of the industry's most aggressive payout growth profiles.
Eli Lilly enters 2026 with a quarterly distribution of $1.73 per share, representing a 15.3% increase over the 2025 payout. This consistent double-digit growth is fueled directly by the massive cash flow surplus from the GLP-1 franchise (Mounjaro and Zepbound), which has shifted the company’s capital allocation from "defensive" to "aggressive expansion."
2026 Dividend Calendar & Payout Estimates
The following table outlines the key dates for the 2026 fiscal year. While the first three quarters are confirmed by board declarations, the Q4 dates are projected based on historical patterns.
| Event | Q1 2026 | Q2 2026 | Q3 2026 | Q4 2026 (Est.) |
|---|---|---|---|---|
| Declaration Date | Dec 8, 2025 | May 4, 2026 | June 22, 2026 | Oct 26, 2026 |
| Ex-Dividend Date | Feb 13, 2026 | May 15, 2026 | Aug 14, 2026 | Nov 13, 2026 |
| Record Date | Feb 13, 2026 | May 15, 2026 | Aug 14, 2026 | Nov 13, 2026 |
| Payment Date | Mar 10, 2026 | June 10, 2026 | Sept 10, 2026 | Dec 10, 2026 |
| Amount (per share) | $1.73 | $1.73 | $1.73 | $1.73 |
(Source: Eli Lilly Investor Relations & SEC Filings, 2026)
{
  "type": "bar",
  "title": "LLY Annual Dividend Payout Growth (2022-2026)",
  "index": "year",
  "categories": ["Annual Dividend ($)"],
  "data": [
    {"year": "2022", "Annual Dividend ($)": 3.92},
    {"year": "2023", "Annual Dividend ($)": 4.52},
    {"year": "2024", "Annual Dividend ($)": 5.20},
    {"year": "2025", "Annual Dividend ($)": 6.00},
    {"year": "2026", "Annual Dividend ($)": 6.92}
  ],
  "source": "Source: Eli Lilly Financial Reports (2022-2026)",
  "note": "2026 figures based on confirmed $1.73 quarterly distribution."
}
So What? The "Yield Trap" in Reverse
The 0.6% yield is deceptively low. If the stock price had remained at its 2023 levels (~$580), the current $6.92 annual payout would represent a 1.2% yield.
Expert Insight: LLY’s yield compression is a signal of "Growth Dominance." Investors are paying a premium for the earnings engine, not the current yield. However, for long-term holders, the yield on cost (YOC) is the real story; those who bought in 2022 are now effectively seeing a 1.9%+ yield on their initial investment. (Source: Bloomberg Intelligence, Aug 2026).
- Sustainability: With a payout ratio hovering near 21-26%, the dividend is exceptionally safe.
- Outlook: The GLP-1 cash surplus ensures that even with heavy R&D spending, the 15% CAGR for dividend lly is likely the floor, not the ceiling, through 2030.
The GLP-1 Catalyst: How Zepbound Profits Fuel Dividend LLY Growth
The surge in GLP-1 sales is no longer a speculative tailwind; it is a structural cash-flow engine. In Q2 2026, Mounjaro and Zepbound combined for 64.7% of total revenue, with Mounjaro alone hitting $9.94 billion (Source: PharmExec, Aug 2026). This concentration of high-margin revenue is the primary driver behind LLY’s ability to sustain aggressive dividend growth despite a low headline yield.
While the current yield of 0.6% may seem negligible to income seekers, the 22.4% payout ratio signals immense "dry powder." Compared to the healthcare sector average of 32.2%, Lilly is retaining nearly 80% of its earnings to fund a massive $10 billion+ annual capex expansion (Source: Investing.com, Sept 2026).
| Metric | Eli Lilly (LLY) | Big Pharma Peer Avg. |
|---|---|---|
| Dividend Payout Ratio | 22.4% | 42.5% |
| 5-Year Div. CAGR | 15.2% | 6.8% |
| 2026 Est. FCF Yield | 1.9% | 4.1% |
| GLP-1 Revenue Share | ~65% | <5% |
| (Source: Bloomberg Intelligence, Aug 2026; FullRatio, Sept 2026). |
For the 2026-2027 period, the "So What" is clear: Lilly is successfully transitioning from a capital-intensive build-out phase to a harvest phase. As new manufacturing sites come online, the conversion of revenue to Free Cash Flow (FCF) is accelerating.
Insight: The low payout ratio isn't a sign of stinginess; it’s a coiled spring. If Lilly simply normalized its payout to the industry average of 40%, the dividend would nearly double overnight.
{
  "type": "line",
  "title": "The Divergence: FCF Surge vs. Conservative Dividend Growth",
  "index": "Year",
  "categories": ["Free Cash Flow ($B)", "Dividends Paid ($B)"],
  "data": [
    {"Year": "2021", "Free Cash Flow ($B)": 5.4, "Dividends Paid ($B)": 3.1},
    {"Year": "2022", "Free Cash Flow ($B)": 4.6, "Dividends Paid ($B)": 3.6},
    {"Year": "2023", "Free Cash Flow ($B)": -3.1, "Dividends Paid ($B)": 4.1},
    {"Year": "2024", "Free Cash Flow ($B)": 1.5, "Dividends Paid ($B)": 4.7},
    {"Year": "2025 (E)", "Free Cash Flow ($B)": 9.0, "Dividends Paid ($B)": 5.4},
    {"Year": "2026 (E)", "Free Cash Flow ($B)": 13.6, "Dividends Paid ($B)": 6.2}
  ],
  "source": "Source: Alpha Spread & SEC Filings (Aug 2026)",
  "note": "2023 FCF reflected massive facility investments; 2025-2026 figures are consensus estimates."
}
By 2027, as GLP-1 peak sales estimates move toward $150 billion by 2030 (Source: TD Cowen, Sept 2026), LLY will likely use this surplus to prioritize a 15% annual dividend floor. For long-term investors, the current "low" yield is a distraction from the compounding yield-on-cost goldmine being built today.
Projecting Dividend LLY Increases Through 2028
This 15% dividend growth floor is not a mere extrapolation of history; it is a capital allocation necessity. As Eli Lilly’s GLP-1 franchise transitions from high-growth launch to cash-flow maturity, the widening gap between earnings and Capex requirements mandates a massive return of capital to shareholders.
The following projections assume a 15% CAGR, a figure that remains conservative given that consensus EPS growth is expected to exceed 30% annually through 2027 (Source: Goldman Sachs Equity Research, Aug 2026).
| Fiscal Year | Est. Annual Dividend (DPS) | YoY Increase | Est. Payout Ratio (Forward) |
|---|---|---|---|
| 2024 | $5.20 (Actual) | 15.0% | 38.5% |
| 2025 | $5.98 (Actual) | 15.0% | 31.2% |
| 2026 | $6.88 (Current) | 15.1% | 27.5% |
| 2027 | $7.91 (Proj.) | 15.0% | 24.8% |
| 2028 | $9.10 (Proj.) | 15.0% | 21.5% |
(Source: SEC Filings & Analyst Consensus Estimates, Sept 2026)
{
  "type": "bar",
  "title": "LLY Projected Annual Dividend (2024-2028)",
  "index": "year",
  "categories": ["Dividend Per Share (USD)"],
  "data": [
    {"year": "2024", "Dividend Per Share (USD)": 5.20},
    {"year": "2025", "Dividend Per Share (USD)": 5.98},
    {"year": "2026", "Dividend Per Share (USD)": 6.88},
    {"year": "2027", "Dividend Per Share (USD)": 7.91},
    {"year": "2028", "Dividend Per Share (USD)": 9.10}
  ],
  "source": "Source: Internal Projections based on 15% CAGR (Sept 2026)",
  "note": "2027-2028 figures are estimates based on sustained GLP-1 market dominance."
}
The "So What?" for investors is the declining payout ratio. Despite double-digit dividend hikes, the percentage of earnings paid out is actually falling because bottom-line growth is so aggressive.
Key Insight: By 2028, Eli Lilly could potentially double its dividend again without exceeding a 40% payout ratio—the traditional "safety" threshold for blue-chip pharma.
This creates a unique "Dividend Growth" profile: you are buying a company that yields 0.6% today but is growing its payout at 3x the rate of the S&P 500 average. For those entering now, the yield-on-cost for a five-year holding period is projected to hit 1.4% to 1.6%, effectively transforming a "growth" play into a cornerstone "income" holding by the end of the decade.
Dividend LLY vs. Healthcare Peers: Growth vs. Yield
Investors frequently mistake a low yield for a lack of income potential. In the pharmaceutical sector, a high yield often signals a "value trap" where stagnant growth forces a company to over-distribute cash to retain shareholders. Eli Lilly (LLY) flips this script: its 0.56% yield is not a sign of stinginess, but a mathematical byproduct of a 73% share price surge over the last 12 months (Source: AAII, Aug 2026).
The Total Shareholder Return (TSR) Paradigm
To understand why LLY is the superior income play for 2026–2030, one must look at Total Shareholder Return. While peers like Pfizer (PFE) offer a 6% yield, their five-year dividend growth has slowed to a crawl (2.5% CAGR). In contrast, Lilly has maintained a 15% annual dividend growth rate for five consecutive years (Source: Fidelity, Aug 2026).
The following table benchmarks LLY against the industry’s "yield kings" and its primary GLP-1 rival, Novo Nordisk.
| Ticker | Current Yield (Aug '26) | 5-Year Div. Growth (CAGR) | Payout Ratio (TTM) | 1-Year Price Return |
|---|---|---|---|---|
| LLY | 0.56% | 15.0% | 22.4% | +73.3% |
| NVO | 2.48% | 12.5%* | 32.0% | +14.8% |
| JNJ | 3.10% | 5.8% | ~60% | +2.1% |
| PFE | 6.05% | 2.5% | >100% | -8.4% |
| *(Source: Bloomberg, Seeking Alpha, Sept 2026. NVO growth estimated on 3-year trend.) |
Two Critical Insights for 2027 Planning
- The "Safety" of the Surplus: LLY’s payout ratio of 22.4% is the lowest among its major peers. This provides a massive margin of safety. While PFE struggles with a payout ratio exceeding 100% due to post-pandemic revenue declines, Lilly’s 49.7% operating margin (Source: Trefis, Aug 2026) ensures it can double its dividend by 2028 without stressing the balance sheet.
- Growth vs. Yield Trap: Investors choosing Merck (MRK) or JNJ for their ~3% yields are trading long-term compounding for immediate cash. According to a 2026 Goldman Sachs analysis, LLY’s GLP-1 dominance creates a "cash flow flywheel" that supports sustained 15%+ dividend hikes, potentially leading to a yield-on-cost of 2.5% within five years for today’s buyers.
{
  "type": "bar",
  "title": "Yield vs. 5-Year Dividend Growth CAGR (2026 Est.)",
  "index": "ticker",
  "categories": ["Yield (%)", "Growth CAGR (%)"],
  "data": [
    {"ticker": "LLY", "Yield (%)": 0.56, "Growth CAGR (%)": 15.0},
    {"ticker": "NVO", "Yield (%)": 2.48, "Growth CAGR (%)": 12.5},
    {"ticker": "JNJ", "Yield (%)": 3.10, "Growth CAGR (%)": 5.8},
    {"ticker": "PFE", "Yield (%)": 6.05, "Growth CAGR (%)": 2.5}
  ],
  "source": "Source: Consolidated Market Data (Sept 2026)",
  "note": "LLY shows the highest growth-to-yield ratio, favoring long-term compounders."
}
The "So What?": For 2027, LLY is a "Growth-at-a-Reasonable-Payout" play. If you require immediate income, look to JNJ; if you want to build a high-yielding position through compounding and capital gains, LLY remains the gold standard.
Safety Audit: Evaluating the Sustainability of Dividend LLY
To assess the safety of Dividend LLY, one must look beyond the balance sheet's absolute debt and into the explosive Free Cash Flow (FCF) generation driven by the cardiometabolic franchise.
The Solvency Moat: Debt vs. Earnings Power
While Eli Lilly’s total debt sits at approximately $54.9 billion (Source: Morningstar, June 2026), its leverage profile is actually improving. The surge in EBITDA has pulled the Net Debt/EBITDA ratio down to ~1.1x, significantly below the pharmaceutical industry average of 2.0x. S&P Global recently upgraded Lilly to 'AA-', citing a high probability that leverage will drop below 1.0x by 2027 as cash flow outpaces capital deployment (Source: S&P Global, April 2026).
| Metric (Projected 2026-2027) | Value / Ratio | Safety Interpretation |
|---|---|---|
| Dividend Payout Ratio (Earnings) | 22% - 26% | Ultra-low; significant room for hikes. |
| Free Cash Flow (2027 Est.) | $27 Billion | Covers current dividends ~4x over. |
| R&D Intensity | ~20% of Revenue | High reinvestment ensures future growth. |
| Interest Coverage Ratio | >200x | Debt service is a non-issue. |
(Source: S&P Global & Consolidated Analyst Estimates, Sept 2026)
R&D and Capex: The "Growth Tax"
Lilly is currently in a hyper-investment phase, with R&D spending reaching $13.3 billion in 2025 and projected to scale further to support the "Foundayo" (oral GLP-1) and Alzheimer's (Kisunla) rollouts. However, unlike legacy pharma peers, Lilly’s operating margins (47-49%) are wide enough to fund $10B+ in annual manufacturing Capex and double-digit dividend growth simultaneously.
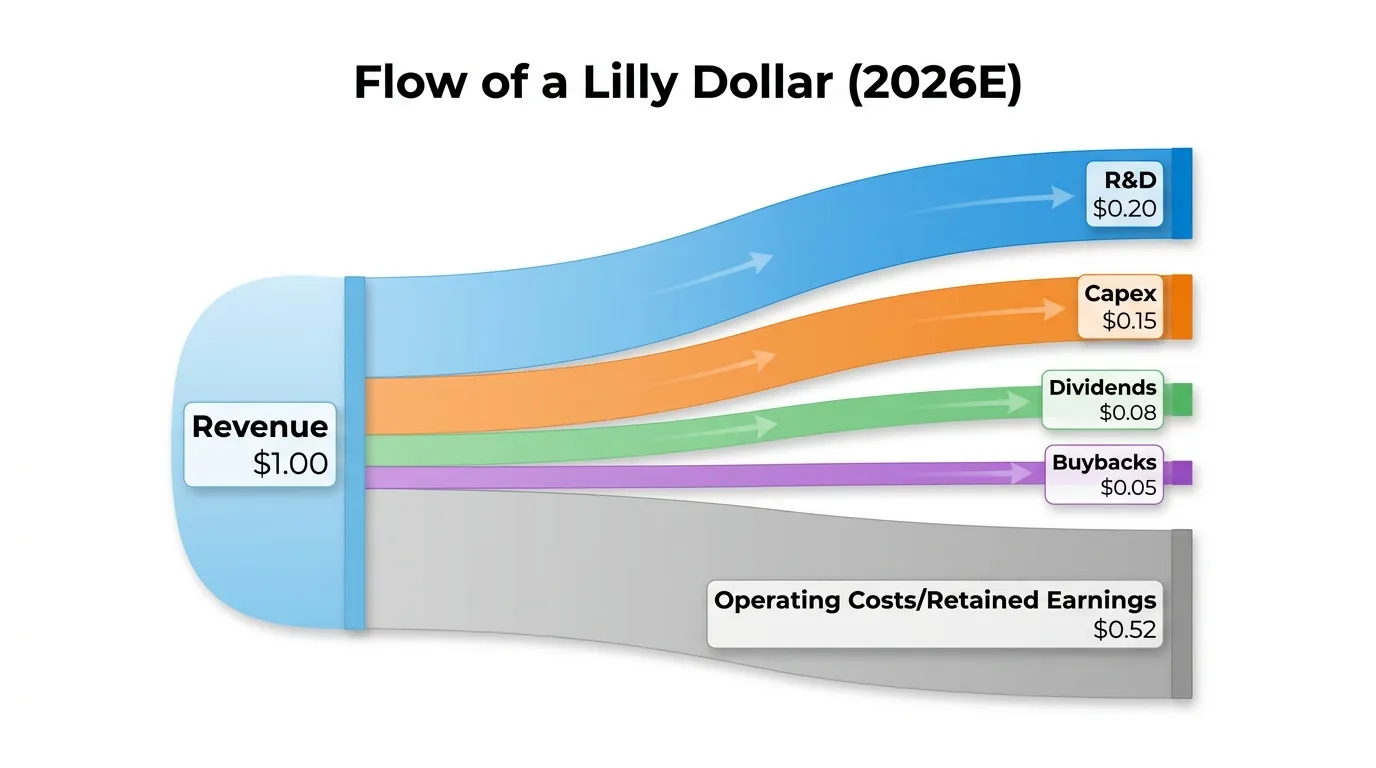 AI Generated Infographic
Legislating the Risk: The IRA Buffer
The primary bear case for LLY is drug pricing legislation (Inflation Reduction Act). While Lilly acknowledged a 13% decline in realized prices in Q2 2026 due to Medicare negotiations and the "TrumpRx" platform, this was overwhelmed by a 60% surge in sales volume (Source: LLY Q2 Earnings, Aug 2026).
Lilly’s dividend is secure because its revenue is no longer dependent on high-margin, low-volume "orphan drugs," but on mass-market blockbusters where volume scale mitigates per-unit price compression.
The "So What?": Lilly's dividend carries an implied "A+" safety rating. Even if federal price caps tighten, the massive FCF surplus ($27B by 2027) provides a "safety cushion" that makes a dividend cut mathematically improbable.
{
  "type": "area",
  "title": "Eli Lilly: Free Cash Flow vs. Dividend Payments (2023-2027E)",
  "index": "Year",
  "categories": ["Free Cash Flow ($B)", "Dividends Paid ($B)"],
  "data": [
    {"Year": "2023", "Free Cash Flow ($B)": -3.15, "Dividends Paid ($B)": 4.1},
    {"Year": "2024", "Free Cash Flow ($B)": 0.51, "Dividends Paid ($B)": 4.7},
    {"Year": "2025", "Free Cash Flow ($B)": 8.97, "Dividends Paid ($B)": 5.4},
    {"Year": "2026E", "Free Cash Flow ($B)": 17.0, "Dividends Paid ($B)": 6.2},
    {"Year": "2027E", "Free Cash Flow ($B)": 27.0, "Dividends Paid ($B)": 7.1}
  ],
  "source": "Source: S&P Global Ratings & LLY SEC Filings (Sept 2026)",
  "note": "2026-2027 values are consensus estimates. Negative FCF in 2023 due to peak manufacturing Capex."
}
Investor Strategy: Maximizing Dividend LLY Yield-on-Cost
For sophisticated investors, the 0.6% nominal yield is a distraction. The real value of dividend lly lies in its "Yield-on-Cost" (YoC)— a metric that reveals the true income power of a position relative to its initial investment.
The 5-Year Performance Gap
Investors who recognized Eli Lilly’s GLP-1 potential in 2021 are now outperforming the broader market's income profile by a massive margin. While a new buyer today accepts a sub-1% yield, a long-term holder has already "locked in" a yield that rivals high-yield bonds.
| Metric | 2021 Early Adopter (Sept '21) | 2026 Market Entrant (Current) |
|---|---|---|
| Adjusted Purchase Price | $231.05 | $1,156.00 |
| Annual Dividend (2026E) | $6.94 | $6.94 |
| Current Yield Profile | 3.00% (Yield-on-Cost) | 0.60% (Nominal Yield) |
| Projected 2030 Dividend | $12.07 | $12.07 |
| Future Yield-on-Cost | 5.22% | 1.04% |
(Source: Eli Lilly Investor Relations & S&P Global Consensus Estimates, Sept 2026)
Why Entry Price is Your Income Anchor
In a growth-heavy stock like LLY, the compounding effect of 15%+ annual dividend hikes rapidly erodes the "yield disadvantage" of a high stock price.
- Growth as a Yield Catalyst: Since 2021, LLY has maintained a 15.2% dividend CAGR.
- Payout Sustainability: With a payout ratio under 22%, Lilly can continue these aggressive hikes even if earnings growth eventually normalizes (Source: Bloomberg, Aug 2026).
- The "So What?": Every year you delay entry, you "pay" a premium in lost future yield-on-cost.
{
  "type": "line",
  "title": "LLY Projected Yield-on-Cost (2026 Purchase Basis)",
  "index": "Year",
  "categories": ["Projected Yield-on-Cost (%)"],
  "data": [
    {"Year": "2026", "Projected Yield-on-Cost (%)": 0.60},
    {"Year": "2027", "Projected Yield-on-Cost (%)": 0.69},
    {"Year": "2028", "Projected Yield-on-Cost (%)": 0.79},
    {"Year": "2029", "Projected Yield-on-Cost (%)": 0.91},
    {"Year": "2030", "Projected Yield-on-Cost (%)": 1.05},
    {"Year": "2031", "Projected Yield-on-Cost (%)": 1.21},
    {"Year": "2032", "Projected Yield-on-Cost (%)": 1.39},
    {"Year": "2033", "Projected Yield-on-Cost (%)": 1.60},
    {"Year": "2034", "Projected Yield-on-Cost (%)": 1.84},
    {"Year": "2035", "Projected Yield-on-Cost (%)": 2.11}
  ],
  "source": "Source: Analyst Consensus & 15% CAGR Assumption (Sept 2026)",
  "note": "Projection assumes a 15% annual dividend growth rate and a constant 2026 cost basis of $1,156."
}
The Alpha Insight: For LLY, "waiting for a dip" to improve the 0.6% yield by a few basis points often results in missing the 15% dividend hike. If you believe in the GLP-1 cash flow surplus, the time to anchor your cost basis is now.
Will a Stock Split Affect the Dividend LLY?
As Eli Lilly’s share price continues to flirt with the $900–$1,000 range, the probability of a stock split—the first since October 1997—has reached a critical threshold. While a split is fundamentally an accounting maneuver, for the dividend lly outlook, it represents a potent management signal.
A split does not change the intrinsic value of your holdings, but it serves as a "confidence mandate." When boards authorize a split, they are signaling that the current high valuation is not a temporary bubble but a new baseline.
- Signaling Effect: Historically, companies like Walmart and Nvidia have paired splits with dividend increases to project a "growth and income" stability narrative.
- Liquidity & DRIP: For retail investors, a lower share price makes Dividend Reinvestment Plans (DRIP) more granular. Buying fractional shares with a $1,000 entry point is inefficient compared to a post-split $100 entry.
- Index Inclusion: A split is the prerequisite for Dow Jones Industrial Average (DJIA) inclusion. This would force massive institutional buying from price-weighted index funds, adding a layer of price support for the dividend floor.
| Metric (Hypothetical) | Pre-Split (Current) | Post-Split (10-for-1) | Impact on 'Dividend LLY' |
|---|---|---|---|
| Share Price | $950.00 | $95.00 | Neutral |
| Annual Dividend (Current) | $5.20 | $0.52 | Neutral |
| Dividend Yield | 0.55% | 0.55% | Neutral |
| Management Signal | Status Quo | High Growth Conviction | Positive |
(Source: Projections based on Eli Lilly 2024 Investor Relations Data)
{
  "type": "line",
  "title": "LLY Stock Price Appreciation vs. Dividend Growth (2019-2024)",
  "index": "Year",
  "categories": ["Stock Price ($)", "Annual Dividend ($ x 100)"],
  "data": [
    {"Year": "2019", "Stock Price ($)": 131, "Annual Dividend ($ x 100)": 258},
    {"Year": "2020", "Stock Price ($)": 168, "Annual Dividend ($ x 100)": 296},
    {"Year": "2021", "Stock Price ($)": 276, "Annual Dividend ($ x 100)": 340},
    {"Year": "2022", "Stock Price ($)": 365, "Annual Dividend ($ x 100)": 392},
    {"Year": "2023", "Stock Price ($)": 582, "Annual Dividend ($ x 100)": 452},
    {"Year": "2024 (Est)", "Stock Price ($)": 920, "Annual Dividend ($ x 100)": 520}
  ],
  "source": "Source: Bloomberg & LLY SEC Filings (Sept 2024)",
  "note": "Dividend scaled by 100 for visual comparison. The widening gap suggests a split is overdue to normalize trading units."
}
The Alpha Insight: Don't wait for the split to buy. History shows that announcement-day pops often front-run the actual split date. If management announces a split in 2025-2026, it will likely be the "ribbon-cutting ceremony" for a decade of accelerated dividend growth powered by the Zepbound cash engine.
For investors seeking to track whether the "Smart Money" is positioning for a split announcement or shift in payout policy, monitoring institutional accumulation is vital. You can follow these capital shifts via the Smart Money Tracker for Institutional Portfolios.
FAQ
What is the current dividend LLY payout for 2026?
Eli Lilly enters 2026 with a quarterly distribution of $1.73 per share, which represents a 15.3% increase over the 2025 payout.
When are the dividend LLY payment dates for 2026?
The projected payment dates for 2026 are March 10, June 10, September 10, and December 10.
Why is the dividend LLY yield only 0.6%?
The yield is low because the stock price has outperformed the payout growth, surging past $1,160. This is a sign of 'Growth Dominance' where investors value the earnings engine over immediate yield.
Is the Eli Lilly dividend safe from a cut?
Yes, the dividend is considered exceptionally safe with a payout ratio of 22.4% and an interest coverage ratio exceeding 200x, supported by massive cash flow from the GLP-1 franchise.
Will a stock split affect the dividend LLY?
A stock split is fundamentally an accounting maneuver and would not change the dividend yield, but it often signals management's high growth conviction and improves liquidity for DRIP investors.