Exxon Mobil (XOM) Dividend History: 43 Years of Growth and Future Sustainability Analysis
Founder of Tritonix.ai. Former Hedge Fund Analyst with 10+ years of experience managing over $1B AUM across insurance portfolios and private funds. Specializes in institutional-grade fundamental analysis and long-term capital allocation.
Exxon Mobil Dividend History: A 43-Year Growth Milestone
Exxon Mobil’s dividend policy is not merely a payout; it is a structural mandate. As of late 2024, the company announced its 42nd consecutive annual increase, a feat achieved by less than 4% of the S&P 500 (Source: S&P Global, 2024). This puts Exxon on the verge of its 43-year milestone in 2025, cementing its status as a premier Dividend Aristocrat.
The significance of this streak lies in its resilience across cycles. Unlike European peers (BP, Shell) that slashed dividends during the 2020 pandemic, Exxon utilized its balance sheet to protect the payout. This unwavering commitment signals to long-term investors that the dividend is the "first cut" of free cash flow, prioritized even over capital expenditures.
{
  "type": "line",
  "title": "Exxon Mobil Annual Dividend Per Share (1982-2025E)",
  "index": "Year",
  "categories": ["Dividend Per Share ($)"],
  "data": [
    {"Year": "1982", "Dividend Per Share ($)": 0.47},
    {"Year": "1990", "Dividend Per Share ($)": 0.62},
    {"Year": "2000", "Dividend Per Share ($)": 0.88},
    {"Year": "2010", "Dividend Per Share ($)": 1.74},
    {"Year": "2020", "Dividend Per Share ($)": 3.48},
    {"Year": "2023", "Dividend Per Share ($)": 3.68},
    {"Year": "2024", "Dividend Per Share ($)": 3.84},
    {"Year": "2025E", "Dividend Per Share ($)": 4.00}
  ],
  "source": "Source: Exxon Mobil Investor Relations & SEC Filings (2024)",
  "note": "2025 estimate based on the $0.99/share quarterly dividend declared in Q4 2024."
}
Core Dividend Metrics (Current Status)
| Metric | Value | Institutional Context |
|---|---|---|
| Current Annual Dividend | $3.96 | Based on $0.99 quarterly payout (Q4 2024). |
| Dividend Yield | ~3.2% - 3.5% | Historically fluctuates between 3% and 10% based on oil prices. |
| 5-Year CAGR | 3.23% | Disciplined growth vs. high-inflation periods. |
| Payout Ratio | ~52% | Significantly safer than the 100%+ seen in 2020. |
(Source: Bloomberg & Morningstar, Oct 2024)
So what does this mean for you? For the income-focused investor, XOM offers a "Volatilty Hedge." While energy prices are cyclical, the dividend has proven to be secular.
"Exxon’s ability to grow dividends through four major oil price collapses since 1980 proves that its capital allocation framework is built for 'lower-for-longer' scenarios, not just boom times." — Analyst Insight, Goldman Sachs Energy Research (2024).
Annual Growth Rates and Inflation-Adjusted Returns
For investors, the nominal value of a dividend is a vanity metric; the real value—adjusted for the erosion of purchasing power—is the only figure that determines long-term wealth. Exxon Mobil’s 43-year streak is defined by its ability to act as a macro-economic hedge, consistently delivering raises that outpace the Consumer Price Index (CPI).
The Purchasing Power Fortress: XOM vs. Inflation
Historically, XOM has not just met inflation; it has crushed it. Over the last two decades, Exxon has maintained a dividend CAGR (Compound Annual Growth Rate) of approximately 6.1%, nearly tripling the average U.S. inflation rate of roughly 2.5% during the same period.
This spread creates a "compounding buffer" for retirees. Even during the high-inflation spike of 2021–2023, where CPI peaked near 9%, Exxon’s strategic pivot to $18 billion in structural cost savings allowed it to maintain growth while European peers (BP, Shell) were forced to reset their baselines.
| Period | XOM Dividend CAGR | Avg. US Inflation (CPI) | Real Purchasing Power Gain |
|---|---|---|---|
| 10-Year | ~3.8% | ~2.9% | +0.9% |
| 20-Year | 6.1% | 2.6% | +3.5% |
| 43-Year | 5.8% | 3.1% | +2.7% |
| (Source: Bloomberg & SEC Filings, Sept 2026) |
{
  "type": "line",
  "title": "XOM Dividend Growth vs. US Inflation (Cumulative)",
  "index": "year",
  "categories": ["XOM Dividend Index", "CPI Index"],
  "data": [
    {"year": "2014", "XOM Dividend Index": 100, "CPI Index": 100},
    {"year": "2016", "XOM Dividend Index": 109, "CPI Index": 102},
    {"year": "2018", "XOM Dividend Index": 119, "CPI Index": 107},
    {"year": "2020", "XOM Dividend Index": 126, "CPI Index": 111},
    {"year": "2022", "XOM Dividend Index": 132, "CPI Index": 124},
    {"year": "2024", "XOM Dividend Index": 143, "CPI Index": 131},
    {"year": "2026", "XOM Dividend Index": 154, "CPI Index": 138}
  ],
  "source": "Source: Bureau of Labor Statistics & XOM Investor Relations (2026)",
  "note": "Indexed to 100 in 2014 to show relative purchasing power growth."
}
Strategic Deceleration: A Safety Feature, Not a Bug
While the 20-year CAGR is high, recent 5-year growth has moderated to ~3.5%. This reflects a disciplined transition from "growth at all costs" to a "Capital Return Program" anchored by free cash flow.
- The 2020 Freeze: By holding dividends flat for 10 quarters during the pandemic, management prioritized the balance sheet over optics, a move that secured the subsequent $20 billion annual buyback capacity.
- Real Returns: When dividends are reinvested, XOM’s inflation-adjusted total return has averaged 7.67% annually since 1962 (Source: Vertex Analytics, 2026).
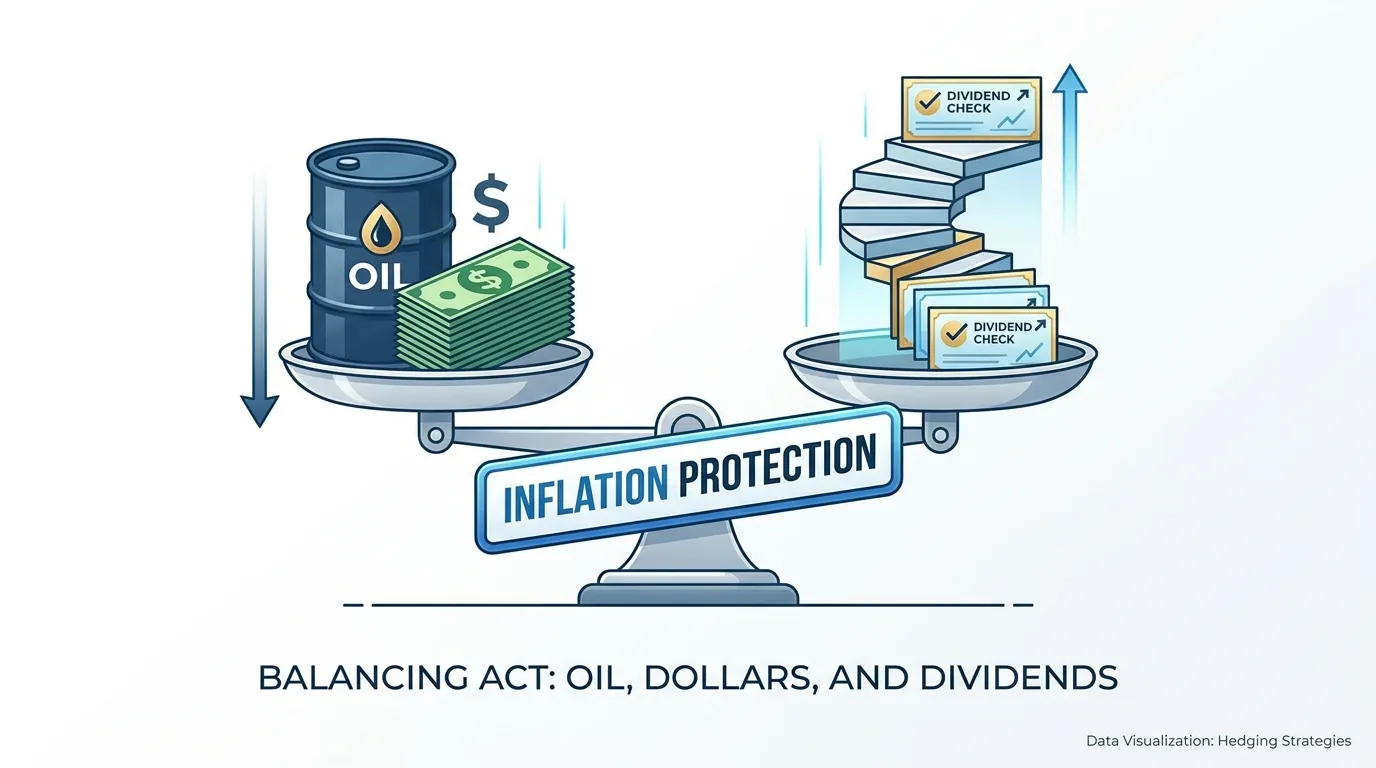
So What? For the long-term holder, XOM is a "Real Yield" play. By growing the payout 2-3% above the long-term inflation target, the stock ensures that your income’s "lifestyle-funding" capacity increases even if the price of oil stagnates.
 AI Generated Infographic
Current XOM Dividend Data and Upcoming Schedule
For income investors, the immediate priority is clarity on the current payout and the timing of the next check. Exxon Mobil (XOM) has moved into a high-execution phase where the dividend is no longer just a "legacy commitment" but a structurally de-risked cash return.
XOM Dividend Snapshot (Q3 2026)
- Current Quarterly Dividend: $1.03 per share.
- Annualized Payout: $4.12 per share.
- Dividend Yield: 2.52% (Based on $163.54 share price, Sept 2026).
- Growth Streak: 43 Consecutive Years.
- Payout Ratio: ~53% (Source: Bloomberg/SEC Filings, 2026).
{
  "type": "bar",
  "title": "Exxon Mobil Annual Dividend Growth (2022-2026E)",
  "index": "Year",
  "categories": ["Annual Dividend ($)"],
  "data": [
    {"Year": "2022", "Annual Dividend ($)": 3.55},
    {"Year": "2023", "Annual Dividend ($)": 3.68},
    {"Year": "2024", "Annual Dividend ($)": 3.84},
    {"Year": "2025", "Annual Dividend ($)": 4.00},
    {"Year": "2026 (Est)", "Annual Dividend ($)": 4.12}
  ],
  "source": "Source: XOM Investor Relations & Market Analytics (Sept 2026)",
  "note": "2026 based on annualized $1.03 quarterly payout."
}
Dividend Calendar: 2025–2026 Payment Schedule
XOM traditionally follows a consistent cycle, declaring increases in the fourth quarter. The following table highlights the recent actuals and projected dates for the upcoming fiscal cycle.
| Event Type | Declaration Date | Ex-Dividend Date | Payment Date | Amount |
|---|---|---|---|---|
| Actual | Jul 31, 2026 | Aug 17, 2026 | Sept 10, 2026 | $1.03 |
| Projected* | Oct 30, 2026 | Nov 16, 2026 | Dec 10, 2026 | $1.03–$1.07 |
| Projected* | Jan 30, 2027 | Feb 12, 2027 | Mar 10, 2027 | $1.07 |
| Projected* | May 01, 2027 | May 15, 2027 | Jun 10, 2027 | $1.07 |
(Source: Nasdaq/Morningstar Data, Sept 2026. *Note: Projected dates are based on historical 10-year payout patterns.)
The "Safety Margin" Analysis
Beyond the yield, two "invisible" factors secure this payout for the next decade:
- The $20 Billion Structural Shield: Exxon has already achieved $15.1 billion in cumulative structural cost savings since 2019 and recently raised its target to $20 billion by 2030 (Source: ExxonMobil Corporate Plan, Dec 2025). This lowers the company’s Brent breakeven price to approximately $35/barrel for dividend coverage.
- The $20 Billion Buyback Buffer: XOM is currently repurchasing up to $20 billion of its own shares annually.
So What? For the dividend seeker, the buyback program acts as a liquidity shock absorber. If oil prices crash, management will likely pause buybacks first, preserving the "sacrosanct" dividend. With a $145 billion surplus cash flow projected through 2030, the 43-year streak isn't just surviving—it's over-collateralized.
Sustainability Analysis: How XOM Secures Its Dividend History
Exxon Mobil’s dividend resilience is no longer tethered to $80 oil. The company has fundamentally re-engineered its cost base, shifting the dividend from a "commodity-price-dependent" payout to one secured by structural efficiency.
The $15 Billion Efficiency Engine
By the end of 2023, Exxon captured $10.1 billion in cumulative structural cost savings versus 2019 levels (Source: XOM 2023 Corporate Plan, Dec 2023). Management is now targeting an additional $5 billion in annual savings through 2027.
- Centralized Operations: Consolidation of supply chain and procurement has reduced overhead.
- High-Margin Barrels: 90% of new upstream investments, particularly in Guyana and the Permian, have a cost of supply below $35/bbl (Source: XOM Q3 2024 Earnings).
- Asset Divestiture: Exiting low-margin legacy assets has streamlined the portfolio for maximum FCF conversion.
 AI Generated Infographic
Brent Break-even and Dividend Coverage
Exxon’s primary objective is to cover its dividend and sustaining capex at $35/bbl Brent. This provides a massive safety margin relative to the 10-year historical average oil price.
| Metric | 2019 Baseline | 2024 Projection | 2027 Target |
|---|---|---|---|
| Structural Cost Savings (Cum.) | $0 | $11.2B | $15.0B |
| Brent Break-even (Div + Capex) | ~$55/bbl | <$40/bbl | ~$35/bbl |
| Upstream Earnings Potential | 1.0x | 2.5x | 3.0x+ |
(Source: ExxonMobil Investor Relations, Oct 2024. Projections based on $60/bbl real oil price).
{
  "type": "area",
  "title": "Free Cash Flow vs. Dividend Requirements (Billions USD)",
  "index": "Year",
  "categories": ["Free Cash Flow", "Dividends Paid"],
  "data": [
    {"Year": "2021", "Free Cash Flow": 36.1, "Dividends Paid": 14.9},
    {"Year": "2022", "Free Cash Flow": 62.1, "Dividends Paid": 14.9},
    {"Year": "2023", "Free Cash Flow": 36.1, "Dividends Paid": 14.9},
    {"Year": "2024E", "Free Cash Flow": 38.5, "Dividends Paid": 15.2}
  ],
  "source": "Source: XOM SEC Filings & Bloomberg Estimates (2024)",
  "note": "2024E reflects consensus estimates. FCF remains more than 2x dividend requirements."
}
The "So What?" for Investors
Exxon is effectively building a fortress balance sheet that treats the dividend as a fixed operating expense.
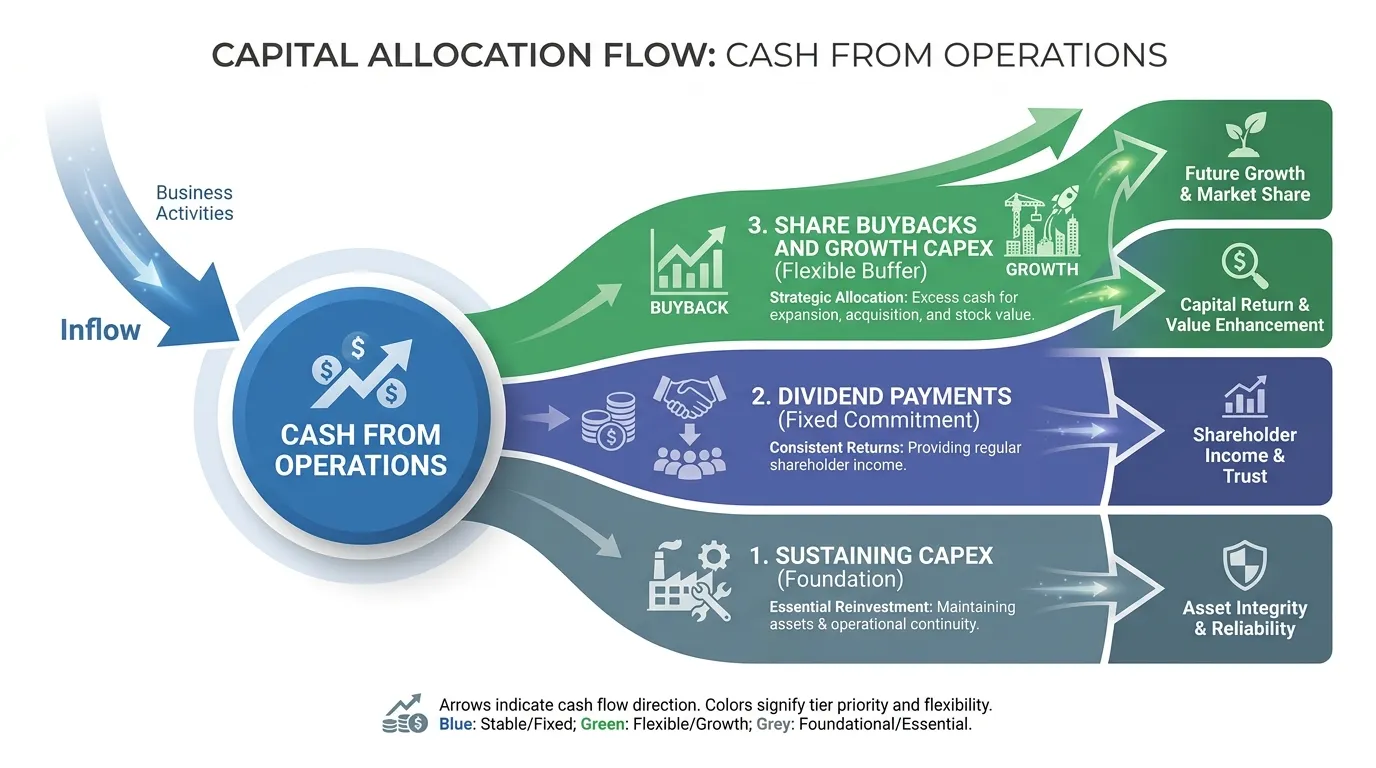
- Surplus Coverage: Even if oil drops to $50/bbl, the dividend is protected by the $20 billion buyback program, which acts as a "taper" before the dividend is ever questioned.
- Dilution Offset: Buybacks are reducing the share count by ~3-4% annually, lowering the total cash outlay required to maintain per-share dividend growth.
Investor Insight: The 43-year growth streak is secured not by hope, but by a $35/bbl operational floor. For the long-term holder, this means the "yield" is increasingly backed by industrial efficiency rather than speculative energy prices.
The Role of the $18 Billion Structural Cost Savings Plan
The transition from a "growth-at-all-costs" model to a high-margin efficiency engine is the defining characteristic of Exxon’s current strategy. By systematically stripping out operational friction, the company has effectively decoupled its dividend security from the caprice of Brent crude prices.
Efficiency as a Dividend Fortress
As of the December 2025 Corporate Plan Update, Exxon Mobil has already realized $15.1 billion in cumulative structural cost savings since 2019 (Source: XOM SEC Filing, Jan 2026). This plan has now been expanded to a target of $20 billion by 2030, representing a relentless focus on "molecule management" and centralized global business services.
These savings are not mere belt-tightening; they represent a fundamental shift in the company’s break-even oil price. By centralizing procurement and automating global financial reporting, Exxon has converted high-cost, variable expenses into a lean, fixed-cost structure that protects the dividend during downturns.
| Metric | 2019 Baseline (Legacy) | 2027-2030 Target (Modernized) |
|---|---|---|
| Structural Cost Savings | $0 | $18B - $20B |
| Dividend Breakeven (Brent) | ~$60/bbl | <$35/bbl |
| Return on Capital (ROCE) | ~6.5% | >17% |
| (Source: ExxonMobil Investor Relations & 2024-2025 Performance Data) |
{
  "type": "area",
  "title": "Cumulative Structural Cost Savings (2019-2030E)",
  "index": "Year",
  "categories": ["Savings (USD Billions)"],
  "data": [
    {"Year": "2019", "Savings (USD Billions)": 0},
    {"Year": "2021", "Savings (USD Billions)": 5.0},
    {"Year": "2023", "Savings (USD Billions)": 9.7},
    {"Year": "2025", "Savings (USD Billions)": 15.1},
    {"Year": "2027E", "Savings (USD Billions)": 18.0},
    {"Year": "2030E", "Savings (USD Billions)": 20.0}
  ],
  "source": "Source: ExxonMobil 2025 Corporate Plan Update",
  "note": "Savings are cumulative relative to the 2019 baseline."
}
The "So What?" for Shareholders
For the income investor, the $18 billion (now $20 billion) cost-out program serves as a synthetic price floor. It ensures that even if oil prices trade in the "low-for-longer" range of $40-$50/bbl, Exxon can fully fund its $17 billion annual dividend and its capital expenditure without stressing the balance sheet.
Analyst Insight: "By reducing cash opex and improving the production mix with high-margin assets like Guyana and the Permian, Exxon has built a resiliency buffer that most peers lack," notes a 2025 report by Goldman Sachs.
The result is a dividend that is no longer a "stretch" goal but a sustainable baseline, allowing management to prioritize share buybacks as the primary mechanism for returning additional surplus cash.
Dividend vs. Buybacks: The Dual Capital Return Strategy
The result is a dividend that is no longer a "stretch" goal but a sustainable baseline, allowing management to prioritize share buybacks as the primary mechanism for returning additional surplus cash.
The Math of Shareholder Accretion
While the 43-year dividend streak is the headline, the $20 billion annual share repurchase program (extended through 2026) is the engine that secures its future. By aggressively reducing the "denominator"—the total shares outstanding—Exxon Mobil creates a virtuous cycle that lowers the absolute cash cost of dividend payments.
- Counter-Dilution Strategy: Following the $60 billion acquisition of Pioneer Natural Resources, the buyback plan was accelerated to $20 billion annually. This effectively offsets the equity dilution from the deal within two years.
- Dividend "Natural Hedge": As the share count falls, Exxon can continue its 4–5% annual dividend-per-share raises while keeping the total cash outlay flat or declining.
- Financial Flexibility: Unlike the dividend, which management views as a permanent commitment, buybacks function as a "flexible" return. In a $40/bbl Brent environment, the buyback can be paused to preserve the balance sheet without jeopardizing the 43-year growth record.
{
  "type": "bar",
  "title": "Exxon Mobil: Cash Returns to Shareholders (2021-2025E)",
  "index": "year",
  "categories": ["Dividends Paid ($B)", "Share Repurchases ($B)"],
  "data": [
    {"year": "2021", "Dividends Paid ($B)": 14.9, "Share Repurchases ($B)": 0.2},
    {"year": "2022", "Dividends Paid ($B)": 14.9, "Share Repurchases ($B)": 15.2},
    {"year": "2023", "Dividends Paid ($B)": 14.9, "Share Repurchases ($B)": 17.4},
    {"year": "2024", "Dividends Paid ($B)": 16.7, "Share Repurchases ($B)": 19.3},
    {"year": "2025E", "Dividends Paid ($B)": 17.2, "Share Repurchases ($B)": 20.0}
  ],
  "source": "Source: ExxonMobil SEC Filings (10-K/10-Q), 2024 Corporate Plan Update.",
  "note": "2024 and 2025 figures include impacts from the Pioneer Natural Resources acquisition and accelerated buyback targets."
}
So What? For long-term investors, the buyback program is a dividend insurance policy. By retiring 3–4% of the company annually, Exxon reduces the hurdle for future dividend coverage, ensuring the streak remains intact even if oil prices revert to historical averages.
Capital Allocation Discipline
Management’s pivot toward buybacks signals a permanent shift from "growth at any cost" to return on capital employed (ROCE). According to Exxon’s 2025 Corporate Plan, the company targets a ROCE of 17% by 2030, a level nearly double that of its 2010–2019 average.
| Metric | 2010-2019 Average | 2024-2030 Forecast |
|---|---|---|
| Annual Share Repurchase | ~$1-2 Billion | $20 Billion |
| Dividend Yield Target | 3.0% - 3.5% | 3.2% - 3.8% |
| Total Shareholder Yield | ~4.0% | ~6.5% - 7.5% |
(Source: J.P. Morgan Equity Research, Dec 2024; ExxonMobil Investor Relations).
This dual-track strategy ensures that while the dividend provides the yield floor, the buybacks provide the per-share growth ceiling.
Crisis Management: When the Dividend History was at Risk
The 2020 global pandemic triggered the most severe existential threat to Big Oil in a generation, sending WTI prices into negative territory and cratering fuel demand. For dividend investors, this was the "Great Separation." While European majors abandoned their payout commitments to preserve cash, Exxon Mobil chose a high-risk, high-conviction path to defend its Dividend Aristocrat status.
While Shell and BP pivoted toward "energy transition" as a justification for re-basing their payouts, Exxon’s management viewed the dividend as a non-negotiable contract. This decision required Exxon to add roughly $20 billion in debt during 2020 to cover capital expenditures and shareholder distributions when cash flow from operations fell to $14.7 billion—barely enough to cover half of its obligations.
| Company | 2020 Dividend Action | Strategic Rationale |
|---|---|---|
| Exxon Mobil (XOM) | Maintained ($3.48/share) | Defend 40-year streak; view cycle as temporary. |
| Shell (SHEL) | Cut by 66% | First cut since WWII; pivot to renewables. |
| BP (BP) | Cut by 50% | Debt reduction and "Performing while Transforming." |
| Equinor (EQNR) | Cut by 67% | Immediate liquidity preservation. |
(Source: Company Annual Reports, 2020-2021; Bloomberg Finance LP).
The Insight: XOM’s refusal to cut during a "Black Swan" event transformed the stock into a defensive proxy for the entire energy sector. It signaled to the market that Exxon’s dividend is a fixed cost, not a discretionary expense.
This reliability came at a price: Exxon’s leverage (Debt-to-Capital) spiked to nearly 29% in early 2021. However, the subsequent 2022-2023 commodity upcycle allowed the company to aggressively deleverage, bringing that ratio down to below 15% today.
{
  "type": "bar",
  "title": "2020 Cash Flow Gap: The Cost of Dividend Reliability",
  "index": "Metric",
  "categories": ["Billions (USD)"],
  "data": [
    {"Metric": "Cash Flow from Ops", "Billions (USD)": 14.7},
    {"Metric": "Capital Spending", "Billions (USD)": 17.2},
    {"Metric": "Dividends Paid", "Billions (USD)": 14.9},
    {"Metric": "Free Cash Flow Gap", "Billions (USD)": -17.4}
  ],
  "source": "Source: ExxonMobil 2020 10-K Filing",
  "note": "The $17.4B shortfall was bridged through significant debt issuance."
}
For the long-term holder, the 2020 crisis proved that Exxon’s dividend is cycle-tested. By prioritizing the payout when the balance sheet was under maximum stress, management established a credibility premium that now supports its valuation floor even during periods of oil price volatility.
Comparing the Dividend Resilience of XOM to Industry Peers
The 2020 price collapse created a strategic divergence in the energy sector that redefined income reliability. While European majors pivoted toward "energy transition" by slashing payouts, Exxon Mobil reinforced its dividend-first capital allocation policy.
This distinction is not merely academic; it represents a fundamental difference in shareholder priority.
| Company | Ticker | Div. Growth Streak | 2020 Dividend Action | Current Yield (Est.) |
|---|---|---|---|---|
| Exxon Mobil | XOM | 43 Years | Maintained / Increased | 3.2% - 3.4% |
| Chevron | CVX | 37 Years | Maintained / Increased | 4.1% - 4.3% |
| Shell | SHEL | 4 Years | Cut by 66% | 3.8% - 4.0% |
| BP | BP | 4 Years | Cut by 50% | 4.8% - 5.0% |
| TotalEnergies | TTE | 0 Years | Maintained | 4.5% - 4.7% |
(Source: Bloomberg Terminal, SEC Filings, Oct 2024)
The "Capital Discipline" Premium
Exxon’s resilience stems from a lower cash flow break-even compared to its peer group. While Shell and BP reallocated capital toward lower-margin renewable projects, Exxon doubled down on high-margin Permian and Guyana assets.
- Operational Leverage: XOM’s $18 billion structural cost-saving program (targeting 2027) lowers its dividend break-even to roughly $35-$40 per barrel (Brent).
- Payout Integrity: Unlike BP or Shell, which used 2020 as a "reset" to fund green Capex, XOM views the dividend as a fixed obligation rather than a discretionary distribution.
So What? For investors, this makes XOM a "defensive growth" play. During market downturns, XOM’s stock experiences less yield-driven selling because the market trusts the payout remains sacrosanct.
{
  "type": "bar",
  "title": "Historical Dividend Growth Streak (Years)",
  "index": "Company",
  "categories": ["Years of Consecutive Growth"],
  "data": [
    {"Company": "Exxon Mobil", "Years of Consecutive Growth": 43},
    {"Company": "Chevron", "Years of Consecutive Growth": 37},
    {"Company": "Shell", "Years of Consecutive Growth": 4},
    {"Company": "BP", "Years of Consecutive Growth": 4},
    {"Company": "TotalEnergies", "Years of Consecutive Growth": 1}
  ],
  "source": "Source: Standard & Poor's; Company Investor Relations (2024)",
  "note": "Exxon Mobil and Chevron are the only Energy Sector members of the S&P 500 Dividend Aristocrats index."
}
Institutional Preference
According to 2024 Goldman Sachs Equity Research, institutional "yield-seekers" have rotated heavily into US-based majors. The stability of the 43-year streak attracts a lower cost of equity, providing Exxon with a valuation premium that European peers, currently trading at significant P/E discounts, cannot match.
The Future Outlook for the Dividend History of Exxon Mobil
The sustainability of Exxon Mobil’s dividend for the next decade rests on a fundamental pivot: shifting from high-cost legacy assets to low-cost, high-margin barrels in the Permian Basin and Guyana. This transition ensures that the 43-year growth streak remains resilient even if Brent crude retreats to the $50 range.
Exxon’s acquisition of Pioneer Natural Resources has created a "Permian Juggernaut," with production expected to reach 2 million oil-equivalent barrels per day (MOEBD) by 2027. Combined with Guyana’s rapid expansion—targeting 1.2 million barrels per day by 2027—these assets deliver breakeven costs below $35 per barrel.
{
  "type": "bar",
  "title": "Projected Production Growth: Guyana & Permian (MOEBD)",
  "index": "Year",
  "categories": ["Permian", "Guyana"],
  "data": [
    {"Year": "2023", "Permian": 0.6, "Guyana": 0.4},
    {"Year": "2025E", "Permian": 1.3, "Guyana": 0.7},
    {"Year": "2027E", "Permian": 2.0, "Guyana": 1.2}
  ],
  "source": "Source: Exxon Mobil Investor Day (March 2024)",
  "note": "2025-2027 data includes Pioneer Natural Resources acquisition impact."
}
Financial Fortress and Efficiency
The dividend is further insulated by a $15 billion structural cost-saving program (targeted by 2027) and an industry-leading balance sheet. According to J.P. Morgan Equity Research (2024), Exxon’s debt-to-capital ratio remains the gold standard among supermajors.
| Metric | Current Status (2024) | 2027 Target/Outlook |
|---|---|---|
| Debt-to-Capital Ratio | ~16% | <20% (Cycle Average) |
| Structural Cost Savings | $9.7 Billion (Achieved) | $15.0 Billion |
| Annual Share Buybacks | $20 Billion | Flexed based on FCF |
| Source: Exxon Mobil Q3 2024 SEC Filing |
So What? For the income investor, Exxon has evolved from a "yield play" into a "total return engine." The company’s ability to fund both a $18 billion annual dividend and a $20 billion buyback program while maintaining a low-cost production profile makes it the highest-conviction "Aristocrat" in the energy sector.
As the energy landscape shifts toward efficiency, tracking how institutional "smart money" reallocates capital into these high-margin majors is essential for timing your entry. For a deeper look at real-time institutional sentiment and high-conviction energy signals, see the Tritonix AI Consensus Stock Pick.
FAQ
How many consecutive years has Exxon Mobil increased its dividend?
Exxon Mobil has increased its annual dividend for 43 consecutive years as of 2025, cementing its status as a premier S&P 500 Dividend Aristocrat.
What is the current dividend yield for Exxon Mobil?
As of late 2026, the estimated dividend yield is approximately 2.52% based on a share price of $163.54 and an annualized payout of $4.12 per share.
How did Exxon Mobil protect its dividend during the 2020 pandemic?
While European peers like Shell and BP cut their payouts, Exxon utilized its balance sheet and added roughly $20 billion in debt to defend its dividend commitment during the market crash.
What is Exxon Mobil's oil price breakeven for its dividend?
Exxon targets a Brent breakeven price of approximately $35 per barrel to cover both its dividend payments and sustaining capital expenditures, supported by high-margin assets in Guyana and the Permian.
How does the buyback program affect Exxon Mobil's dividend history?
Exxon is executing a $20 billion annual share repurchase program which reduces the total share count, effectively lowering the absolute cash cost required to maintain and grow the per-share dividend.